Subscribers questions (FLT, LYC, CGC, WHC, DCN, QMS, FLC, CLQ, BSL)
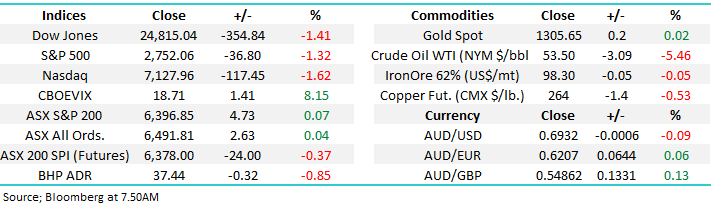
Last week saw President Trump lift the ante on trade with ongoing pressure towards China and a threat of a 5% tariff on all goods from Mexico commencing this week – many may be surprised to know that Mexico is the US’s largest trade partner having recently surpassed both China and Canada. In an economic sign of aggression Trump has said the tariff will increase slowly to 25% until Mexico stops the flow of illegal immigration into the US – potentially more effective than a physical wall and he did say Mexico would pay for it.
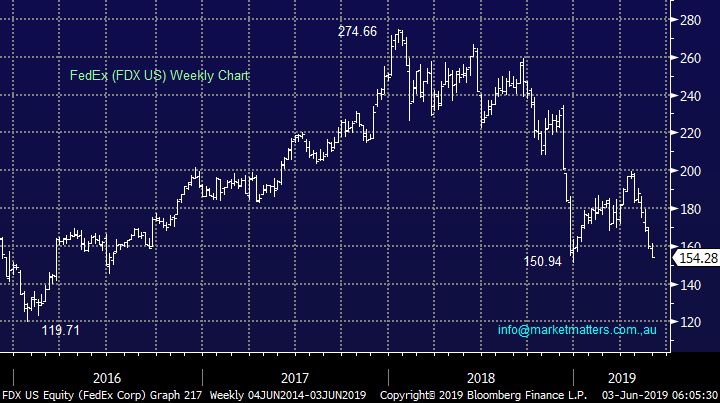
Over the weekend China has launched an investigation into FedEx after apparent “complaints from users” in a move that feels like a retaliatory action on the US’s hostile moves towards Huawei, its hard to imagine the market enjoying this development early on this week – the US futures have opened down -0.5% this morning which wont help local sentiment when we start trading at 10am.
Basically we are in the middle of a geo-political storm which is continuing to intensify and until leaders Trump and Xi Jinping can find some amicable middle ground market volatility appears likely to continue rising – all we can do rather than second guess future tweets is continually evaluate both risk / reward and our valuations of specific stocks.
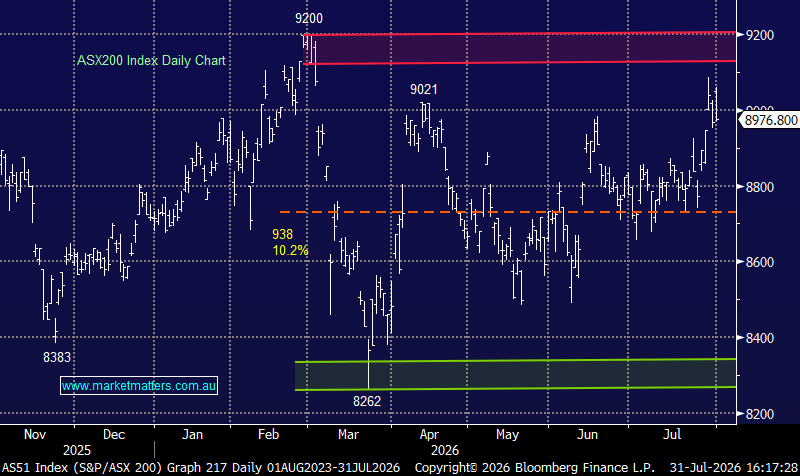
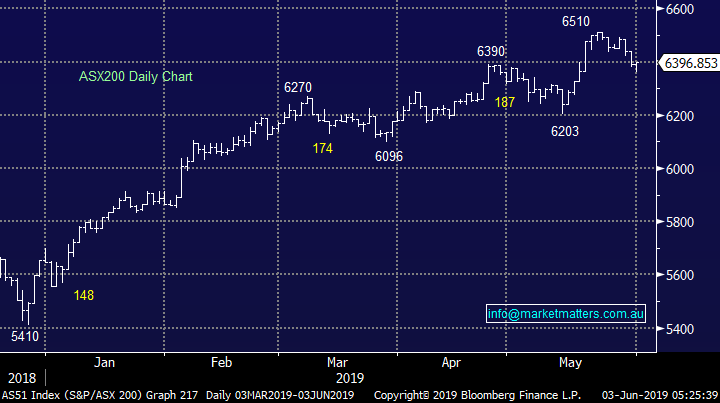
MM remains bullish the ASX200 while it can hold onto the 6370 area – likely to be tested in a major way today.
We continue to receive some excellent very topical market questions, please keep them coming!
ASX200 Index Chart
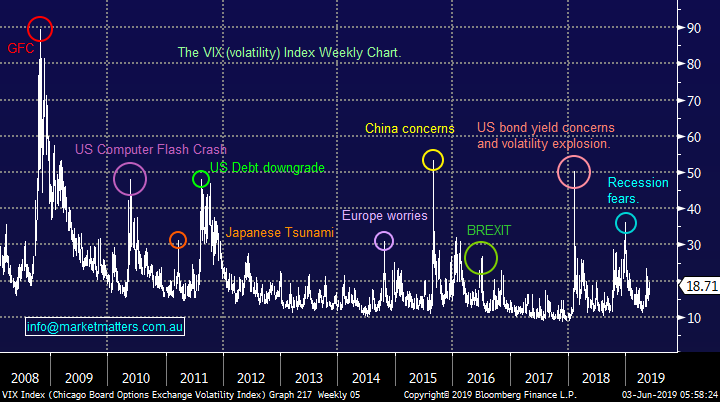
As mentioned above the fear in markets is slowly increasing and the chart of the VIX illustrates this perfectly as the index sits ~50% above its mid-April level. We have 2 very different forces at work here with geopolitical tensions pushing up the VIX while falling bond yields has the complete opposite influence.
MM expects 2019/ 2020 to provide periods of elevated volatility compared to average of the last 7/8-years.
The Volatility “VIX” Index (Fear gauge) Chart
FedEx shares have already been falling for the last few years and this weeks likely to see the stock make fresh 2-year lows. The global package and freight deliverer is clearly unpopular with investors as its Est P/E for this year looks likely to break 10x this week. Technically a panic style fall into the wide $US120-140 would be interesting as an aggressive buy.
MM thinks FDX will be interesting for traders below $US140.
FedEx (FDX US) Chart
Question 1
“Thank you for your continuing excellent service in providing sound, honest and feet-on-the-ground information and interpretation in this uncertain financial world. I was wondering how you see FLT moving in future months with likely increased sales and improved confidence in the travel world following the election result.” - Best wishes, Brian E.
Morning Brian,
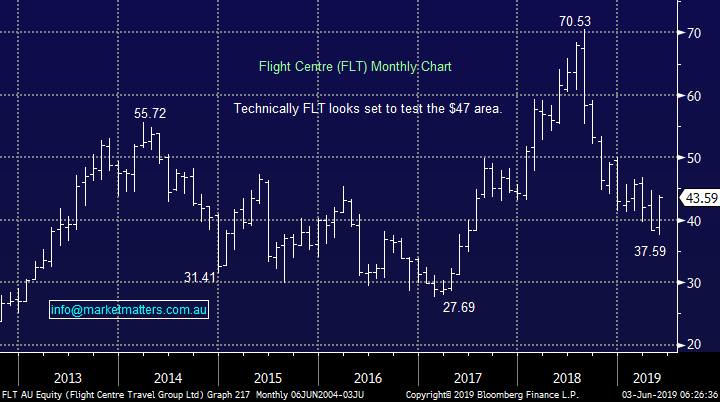
Firstly a big thanks for the kind words, always a nice way to start both the week and questions. FLT is finally looking good and we saw clear evidence of the post-election improved consumer confidence on the weekend through higher auction clearance rates. Obviously time will tell whether this is just a short-term sigh of relief or a medium-term positive trend about to reassert itself but it’s a positive either way.
Most people I speak to on a day to day basis are feeling better after the election although that’s no great surprise considering the industry I work in. However by definition of the election result shows many people want the Liberals driving our economy and improved confidence filters down to a number of different industries including arguably the greatest feel good factor of all holidays, which is where FLT steps in.
FLT is trading on an ok valuation with an Est P/e for 2019 of 17.7x while yielding ~4% fully franked, and that multiple is based on their downgraded guidance . We hold FLT in our Income Portfolio for the combination of these reasons.
MM remains bullish FLT initially targeting the high $40’s.
Flight Centre (FLT) Chart
Question 2
“Hi Team, A question for Q&A. Lynas LYC. Malaysian PM Mahathir appears to have given the green light for the continuation of their Malaysian plant. Wesfarmers are still sniffing around. JV processing facility in Texas continues full steam ahead with US govt encouragement. China is threatening to use rare earths in retaliation for Trump's tariffs. Lynas's Mount Weld is one of the largest and highest quality rare earth deposits globally. I have seen quotes of $7.20 share valuations. Should we all be jumping aboard the good ship Lynas?” - Jeff M.
Hi Jeff,
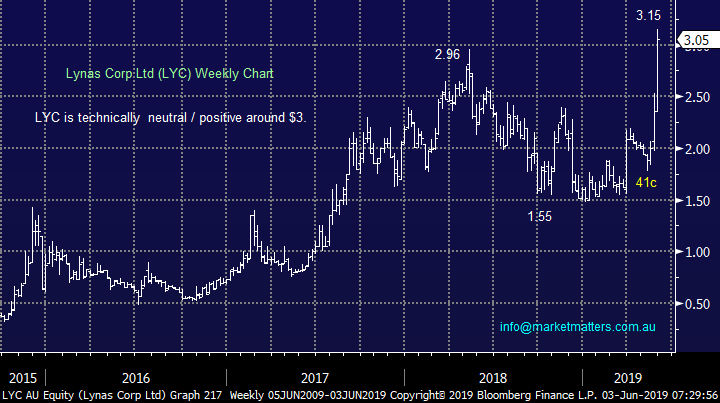
LYC is the largest non-Chinese producer of rare earths in the world and the combination of record production and continued trade tensions has sent its share price to a multi-year high. The failed $2.25 bid by WES certainly looks opportunistic today.
At these levels we believe investors / traders are playing LYC with one eye firmly on potential Chinese tariffs / sanctions on rare earths which will be literally Christmas for LYC. While there are a lot of moving parts to this story, the price action in LYC is hard to argue with.
MM is bullish LYC as an aggressive play with stops under $2.50.
Lynas Corp (LYC) Chart
Question 3
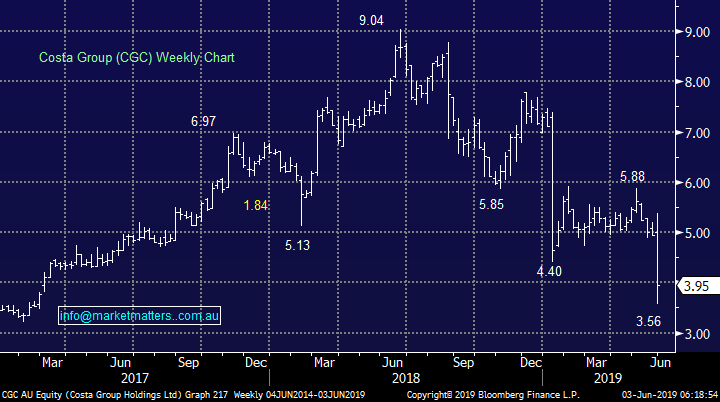
“Hi MM Team, question for Monday from a shattered investor. How can 2 or more brokers look at a company and come up with completely different recommendations looking at the same figures. Recent example your Friday report ( part of the reason my portfolio is in tatters ). CGC - upgraded at Morgans $4.77, downgraded at Macquarie $4.05. This is a large discrepancy ( I Believe) , these people are paid the big $ and someone must be wrong in a big way. MM could also be included in this, calling CGC lower at $4.80 ish, buy at $5.40 ish, add at $5.75 ish and now trading at $ 3.95 ish.” – Regards Neil W.
Hi Neil,
It’s Important to remember that MM and the broader analyst community are making an assessment about the future earnings of a company and then determining the multiple to pay for those future earnings. The future is fluid and irrespective of pay packets, determining what happens in the future has a lot of moving parts. In terms of Costa, they themselves re-confirmed earnings guidance in April at the Macquarie conference. In early April, the company hosted a trip to China for analysts and those that attended had a positive view on the company. Citi for instance initiated coverage with a Buy & $5.80 price target Credit Suisse upped their target to $6. Fast forward to last week and the company says the deteriorating outlook happened during May.
This second major downgrade last week was due primarily to adverse weather conditions and a “crumbly fruit’ disease impacting its raspberry crop – obviously extremely tough for analysts to predict these events. All weather / nature impacted companies run risks of negative surprises but we believe this is the time to step up and buy well run companies experiencing cyclical rather than structural issues, hence we averaged our CGC position last week.
On the day of the downgrade, we wrote the following….
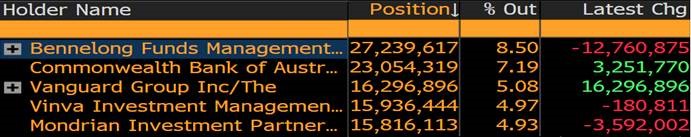
In terms of today’s selling, it was sustained throughout the day. A lot of volume through on the open at $3.94 before the stock rallied to a $4.35 high, however it was all one way traffic thereafter, and the stock closed on the low. It felt like there was a large holder with an axe to sell the stock and the massive volume supports that thesis. The top five holders of CGC are outlined below and of the top 5, only Bennelong has been a major seller during calendar 2019. They’re also the major holder of the stock with 27m shares on board. Being a substantial holder, it will be interesting if we see any changes here over the coming day – we’ll keep you posted.
Top 5 holders of CGC
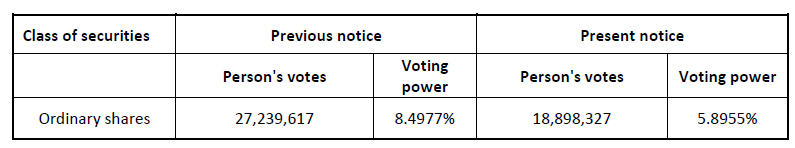
Late Friday afternoon Bennelong put through a change of substantial holder announcement, confirming they had sold more than 8m shares on the day of the downgrade. These guys had an axe to sell the stock, and we would presume they did another big line on Friday taking them below substantial. The difference on Friday being that buyers overcame the selling presume.
Bennelong change in substantial.
MM likes CGC around current levels (yes again!) but its unlikely to be an instant turnaround, we feel investors will want to see some improvement before pushing the stock hard.
Costa Group (CGC) Chart
Question 4
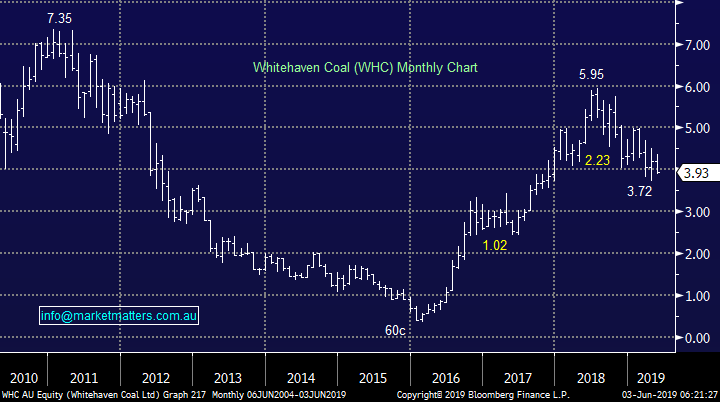
“Hi James, Just like to know your thought on WHC at this stage, looks like not much demand on this stock and has been going down since your buy alert recommendations on the 22nd.” - Regards, Catherine.
Hi Catherine,
MM purchased Whitehaven Coal (WHC) for our Income Portfolio in late May and as you say its been relatively friendless since but at this stage we are comfortable with the stocks valuation and attractive yield. We’re expecting some form of capital return by year end and out 3% weighting gives us room to average the position.
Technically the stock has corrected over 30% from its 2018 high and is slowly reaching major support.
MM still likes WHC into current weakness.
Whitehaven Coal (WHC) Chart
Question 5
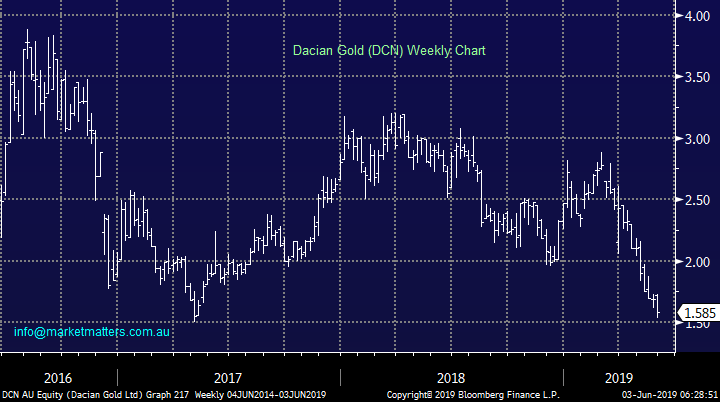
“Hi James and Team, can you please comment on the reasons for the DCN share price fall.?” – Regards John R.
Hi John,
Dacian Gold (DCN) downgraded production in late March and the stock has simply continued to drift lower. The company is a relatively high cost producer at above $1400/oz and to MM it’s not an attractive option in the gold sector.
MM is neutral / bearish DCN.
Dacian Gold (DCN) Chart
Question 6
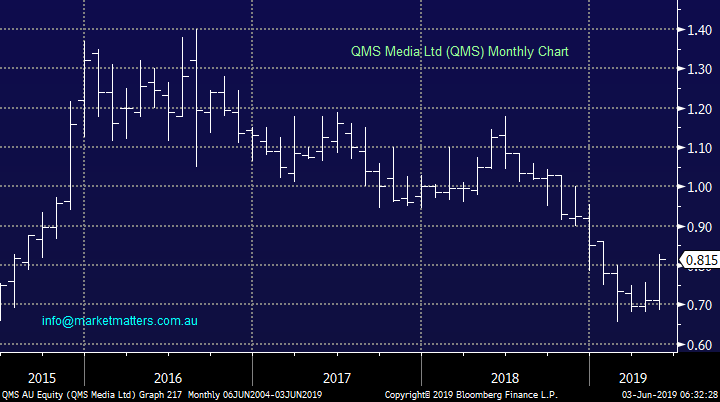
“Great note, as always. One maybe to look at is QMS - looks to have broken out technically from its range. The company is spitting out cash, with high ROIC 35% +. Further the industry is consolidating. Key call outs for review:
- None of the majors institutions cover it. Perfect.
- Regal just recently has come on the register, I believe at 68 cents.
- For FY19 paying only 7.5x for also a 7.9% yield (which long run P/E has been 20x). This is based on the annualised benefit of the three acquisitions. They already guided to $60m EBITDA.
- Buyouts on EV EBITDA mutiples have been x11-x13 for the sector (i.e. APN and Adshell). QMS is on only 5.4x.
- CEO and founder owns 15% of business. Skin in the game.
- Put in no NPAT growth assumed an 8.0% WACC and 3.0% terminal and still get $1.36 valuation (+90%).
Thanks Rodney F.
Hi Rodney,
Thanks for another interesting and thorough question, advertising services business QMS Media Ltd (QMS) has endured a tough few years falling ~50% while the overall market rallied but the recent merger with MediaWorks may be the tonic for better days.
With a market cap of only $266m it’s not a stock for either of the MM Portfolios but technically Its interesting with stops under 74c.
MM likes QMS as a trade with stops below 74c.
QMS Media Ltd (QMS) Chart
Question 7
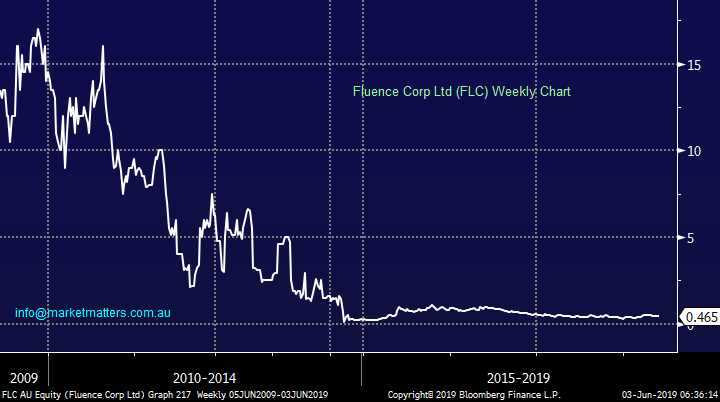
“Hi James, I am a relatively recent subscriber and this is my first question to you. The reintroduction of water restrictions in Sydney got me thinking about global scarcity of clean water as an investment thematic. Along these lines do you have any knowledge of a company called Fluence (FLC) which claims to be an emerging global leader in supply, installation and operation of water and waste water processing facilities. EVs is another investment thematic I have been thinking about. I have a modest position currently in Orecobre (ORE) and Galaxy Resources (GXY), which you have recently written about, but would be interested in any views you have on Clean TeQ (CLQ) which has significant nickel/cobalt reserves and an upcoming FID.” - Thanks, and I enjoy your insights each day. Regards Guy F.
Hi Guy,
Welcome on board!
I think the chart below of FLC tells us the market is not a believer in the companies “claims” or the financial viability of the business moving forward – a simple leave alone for us.
Fluence Corp (FLC) Chart
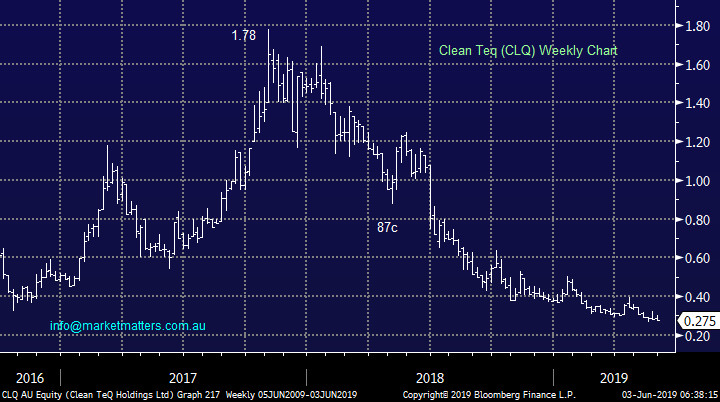
Clean TeQ (CLQ) has its fingers in a number of pies including metals recovery and industrial water treatment but again the markets voting with both feet to avoid the stock.
The company has claimed its flagship project, Clean TeQ Sunrise, to be “one of the highest grade and largest nickel and cobalt deposits outside of Africa and one of the largest and highest grade scandium deposits in the world” and if this is close to reality perhaps a suitor might be interested in the ~$200m business otherwise a lot of water needs to go under the bridge before we will consider the stock as anything more than a “punt”.
A lot of these companies that sound good on paper, have a compelling story etc, in my experience just eat up shareholder capital waiting for illusive commercialisation opportunities.
Clean TeQ (CLQ) Chart
Question 8
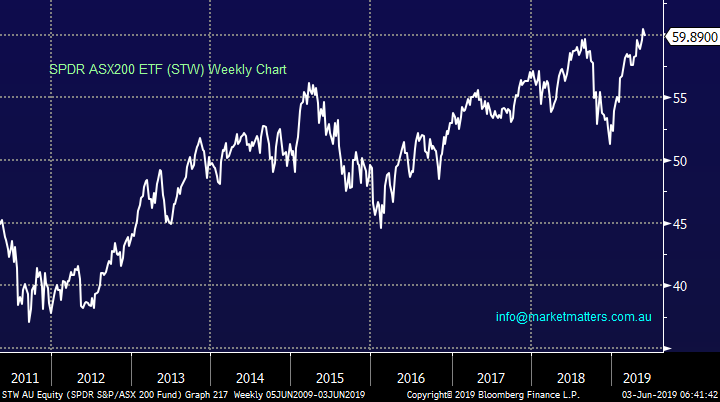
“Hello If you are using an Index ETF which one do you use, I'm using STW because I can sell covered calls, do they all have the same yield ? Also do you know how the ETF Gear works, the yield is high so I'm guessing they are selling XJO calls, I'm wondering also if there is some risk buying GEAR instead of say STW. Thanks Jeff C.
Hi Jeff,
Within the MM Portfolios we have only used ETF’s to hedge (e.g. BBOZ) as opposed to simply gaining long market exposure which we would rather do via our stock selection.
RE STW – this is the only ETF to my knowledge that can be lodged as collateral at the ACH, so it’s the only ETF to do covered calls on.
The BetaShares Gear ETF rallied ~50% from its December low compared to the underlying ASX200 which advanced ~20% illustrating its leverage which obviously carries increased risk if you buy at the wrong time. The GEAR works simply be holding leveraged positions on the market as opposed to unleveraged positions. i.e. If I put $100 of my own money in the market and the market rallies 10%, my return is 10%. If I put $50 of my own money in and borrow $50 and the market rallies 10%, I’m up 20%.
The yield is higher because the underlying market exposure within the fund is higher, which amplifies the return but also the risks.
SPDR ASX200 (STW) ETF Chart
Question 9
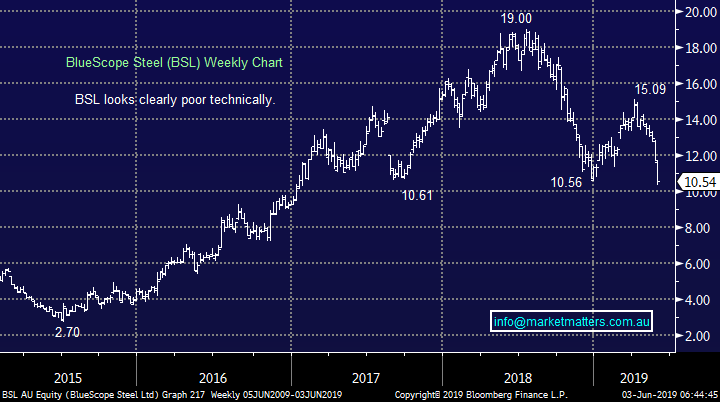
“G’Day James BSL which I own, seems to have taken a gradual turn for the worst over the last month or so, despite a fairly positive presentation to Asia/America a month ago. I can’t find any particular negatives about the business. Maybe the is a US/China implication. Do you have any views on what is going on to cause a daily drift? Or better still what might turn it around?” - Kind regards Ron O.
BSL looks set to make a fresh 4-month low this morning as increased trade tensions between US and China / Mexico continues to escalate meaning that a miss to guidance estimates is also growing since US President Donald Trump lifted steel tariffs.
There is an outside possibility of a major $1bn stock buyback if management decide not to expand its Northern Star operations.
Due to the significant uncertainty surrounding its trading environment BSL is theoretically cheap trading on an Est P/E of below 6x but it can stay cheap for a while. This is a highly leverage play on Us / China trade.
Aggressive investors could slowly accumulate BSL into current weakness.
BlueScope Steel (BSL) Chart
Overnight Market Matters Wrap
· The US equity markets sold off last Friday as the US-China trade war escalates to a new level. This morning, the US Futures opened a further ~0.5% lower as China investigates Fedex Corp. in retaliation from President Trump blacklisting telecom giant Huawei Technologies Co.
· Key global economic data will be released this week, such as the Caixin China PMI (today), RBA interest rate decision (tomorrow), however we believe this will be overshadowed by the louder tunes of the current US-China issue.
· BHP is expected to underperform the broader market after ending its US session off an equivalent of -0.85% from Australia’s previous close.
· The June SPI Futures is indicating the ASX 200 to open 22 points lower this morning, testing the 6375 level but with the US futures off further, we would not be surprised if it tests the 6350 level.
Have a great day!
James & the Market Matters Team
Disclosure
Market Matters may hold stocks mentioned in this report. Subscribers can view a full list of holdings on the website by clicking here. Positions are updated each Friday, or after the session when positions are traded.
Disclaimer
All figures contained from sources believed to be accurate. Market Matters does not make any representation of warranty as to the accuracy of the figures and disclaims any liability resulting from any inaccuracy. Prices as at 03/06/2019
Reports and other documents published on this website and email (‘Reports’) are authored by Market Matters and the reports represent the views of Market Matters. The MarketMatters Report is based on technical analysis of companies, commodities and the market in general. Technical analysis focuses on interpreting charts and other data to determine what the market sentiment about a particular financial product is, or will be. Unlike fundamental analysis, it does not involve a detailed review of the company’s financial position.
The Reports contain general, as opposed to personal, advice. That means they are prepared for multiple distributions without consideration of your investment objectives, financial situation and needs (‘Personal Circumstances’). Accordingly, any advice given is not a recommendation that a particular course of action is suitable for you and the advice is therefore not to be acted on as investment advice. You must assess whether or not any advice is appropriate for your Personal Circumstances before making any investment decisions. You can either make this assessment yourself, or if you require a personal recommendation, you can seek the assistance of a financial advisor. Market Matters or its author(s) accepts no responsibility for any losses or damages resulting from decisions made from or because of information within this publication. Investing and trading in financial products are always risky, so you should do your own research before buying or selling a financial product.
The Reports are published by Market Matters in good faith based on the facts known to it at the time of their preparation and do not purport to contain all relevant information with respect to the financial products to which they relate. Although the Reports are based on information obtained from sources believed to be reliable, Market Matters does not make any representation or warranty that they are accurate, complete or up to date and Market Matters accepts no obligation to correct or update the information or opinions in the Reports. Market Matters may publish content sourced from external content providers.
If you rely on a Report, you do so at your own risk. Past performance is not an indication of future performance. Any projections are estimates only and may not be realised in the future. Except to the extent that liability under any law cannot be excluded, Market Matters disclaims liability for all loss or damage arising as a result of any opinion, advice, recommendation, representation or information expressly or impliedly published in or in relation to this report notwithstanding any error or omission including negligence.