Subscribers questions (GDX, EGG, ABC, CIM, DOW, PBH)
Over the weekend the news was dominated by social issues as opposed to economic ones as we saw 2 more horrendous mass shootings in the US and ongoing political inspired unrest in Hong Kong, not a great result for mankind and our hearts go out to those suffering in Ohio and Texas. Moving onto the economic front and we kick of the week with the market very nervous on a couple of fronts:
1 – Last week US stocks had their worst week in many months following Donald Trump escalating trade concerns by raising fresh tariffs on Chinese goods plus the Fed failed to satisfy the markets insatiable desire for lower interest rates in 2019 / 2020. Its hard not to imagine further news shocks this month from President Trump as he pushes his strong leader profile ahead of next Novembers election in the US.
2 – Reporting season continues this week (although nothing of note today given it’s a Bank Holiday) and investors are rapidly losing confidence in what local stocks can deliver, suddenly a stock that meets expectations and is fairly upbeat moving forward is a big win. Unfortunately today’s market is a 2 edged sword, central banks are cutting interest rates because economies are weak and this is being illustrated by a number of poor company reports, alas we cannot have our cake and eat it too.
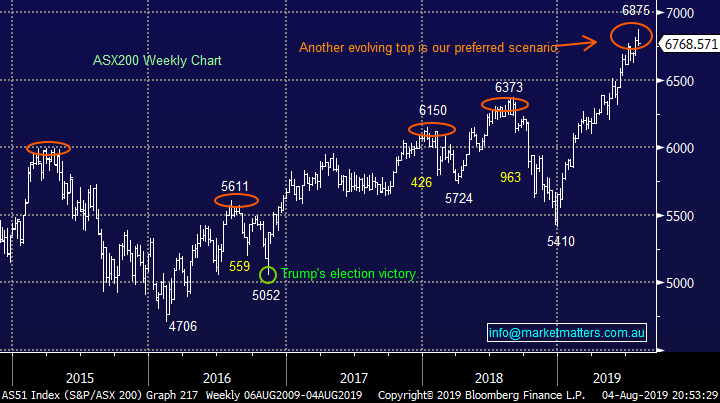
Sell signals have been generated for US indices and we can feel the next few % by the ASX200 is more likely to be down.
However MM is actually in “Buy Mode” due to our high cash levels, subscribers should expect a selective back foot accumulation process through August.
Thanks as always for the questions, its encouraging to all at MM to see long standing subscribers hit the keyboard, we enjoy Mondays offering, please if in doubt ask the question - the “only silly question is one not asked”.
ASX200 Index Chart
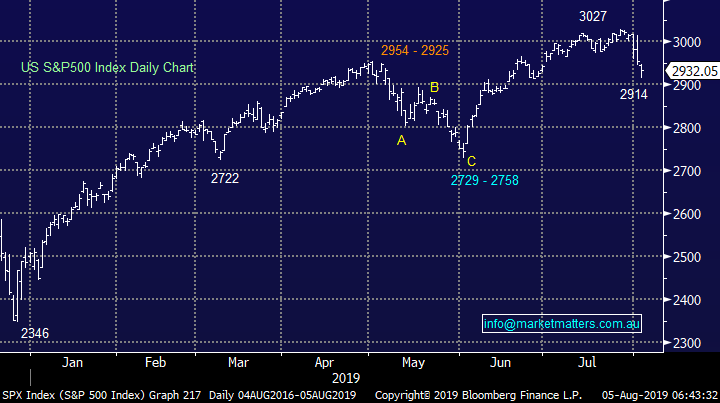
US stocks have now generated the technical sell signal we have been anticipating for the last few weeks, from a fundamental perspective we feel valuations are simply far too rich for stocks to ignore rapidly increasing trade war concerns and a Fed which appears not to be as dovish as many thought only a week ago.
Undoubtedly lower bond yields / interest rates will again step up and support stocks but we feel this may easily not be for another ~6% for the majority of US indices, in other words MM believes we have entered a new short-term cycle for US stocks where bounces should be sold for the active trader.
MM is short-term bearish US stocks hence closely correlated stocks / sectors are likely to underperform.
US S&P500 Index Chart
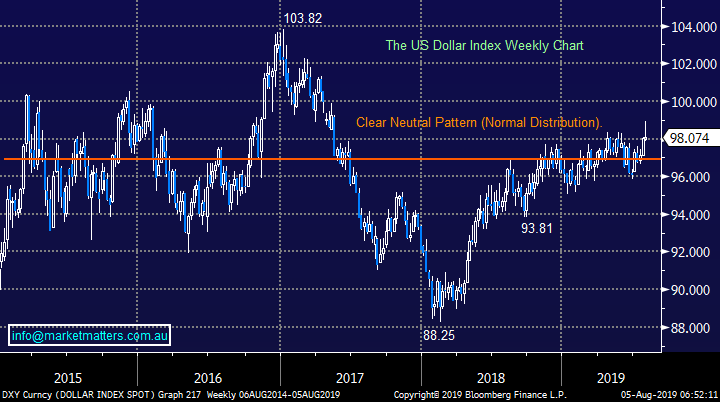
Interestingly last week we saw the $US attempt to break out to the upside following the Fed describing their rate cut last week as just a “mid-cycle” adjustment and increasing trade war concerns but all of its gains were surrendered by the weeks end i.e. it failed to rally on “good news”. Unfortunately the $A failed to gain any traction as our struggling construction sector threatens to push unemployment noticeably higher in 2019 / 2020.
The next few % for the $US looks down, which is theoretically supportive of commodities and especially gold.
The $US Index Chart
Question 1
“Hi MM, grateful for your thoughts on USD denominated Gold stocks in the short and long term following the Feds action (.25 points lower) and comments (not the start on ongoing cuts)?” - Richard M.
Morning Richard,
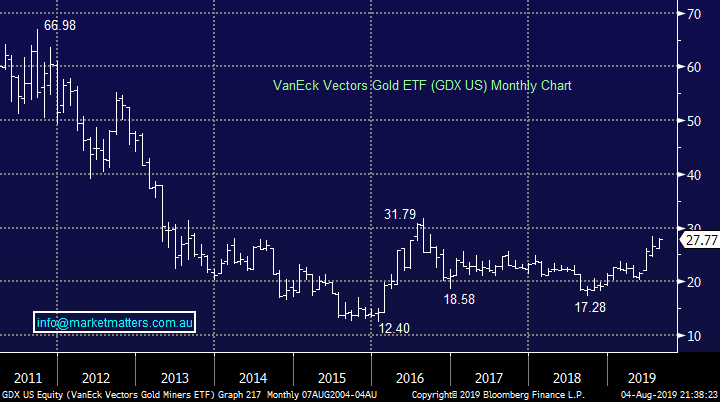
How to play gold is something we are putting significant energy into at present and we like our current mix of 5% in Newcrest (NCM) and 5% in gold ETF (GDX) which is more Canadian facing with respect to its gold stocks. We have selected the later for 2 reasons:
1 – We believe the $A depreciation against the $US is extremely mature which if we are correct should see an end to the Australian gold stocks outperformance compared to their global peers.
2 – It removes the risk with specific stock selection into the current reporting season.
As we mentioned earlier the $US failing to embrace the Fed cuts makes us feel the greenback is at least tired at current levels.
MM is bullish the GDX with an initial target ~30% higher.
VanEck Vectors Gold ETF (GDX US) Chart
Question 2
“Hi James and M&M, correct me if I am wrong but there is approx... $13 Trillion worth of US bonds in the world trading at Negative yielding. So those people or institutions that hold them to maturity or end of term would definitely lose money (The interest and the money you got back would be less than your initial capital). I also understand that there is some sort of mandate that forces these institutions to buy them but these institutions can on sell them to i.e. bigger fools, Is this not crazy and is this not a bubble waiting to burst?? If so what is M&M strategy to circumnavigate this potential crisis? Keep up the good work.” – Tony.
Hi Tony,
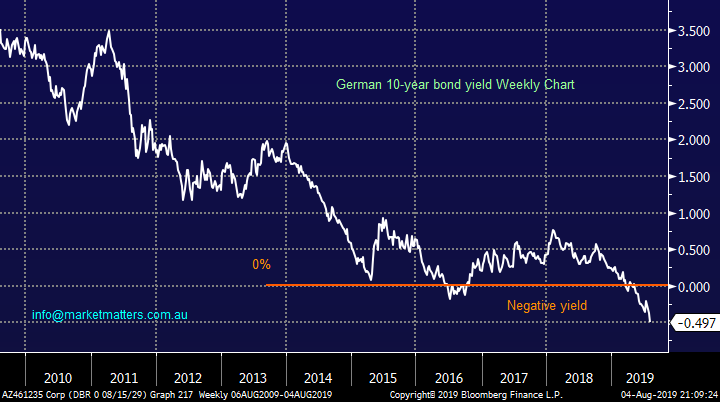
It certainly defies the 101 economics I was taught at university and makes little sense but everything you wrote above is correct except the number which is apparently now closer to $14 trillion, and rising. Common sense tells us that if you lend money you should see a return which by definition increases over time, what we indeed have today is an issue where investors are being forced up the risk curve in search of return – Austria has “century bonds” which expire in 2117 only yielding 0.9%, I certainly reckon my house will have increased in value by more than 1% in 98-years’ time!
All of Germanys bonds are now in negative territory while the US is the outlier not having joined this European dominated party. Governments benefit from these ultra-low / negative interest rate bonds because they can borrow for basically nothing, as do companies that issue bonds and this has helped fuel the mass of company buybacks pushing stocks to fresh all-time highs, lastly don’t forget mortgage holders are having a relative party compared to previous decades.
All the above makes fascinating reading but if we had deserted equities for fear of a bond bubble induced crash we would be significantly worse off today. As we often say “don’t fight the tape” in 2019 stock markets are embracing the low interest rate environment because they are a more attractive place to invest than fixed interest, this elastic band of “risk on” may have further to run over the years ahead before problems arise, one of the reasons we pay attention to technical analysis as it’s a leading indicator.
German 10-year Bond yield Chart
Question 3
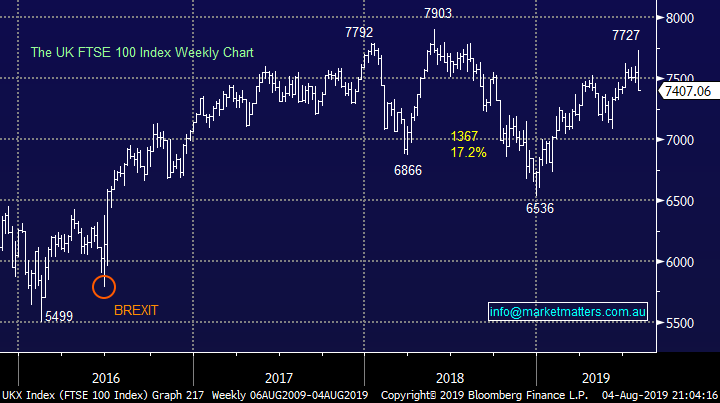
“Hi James and the Team. I am looking at gaining exposure to the UK market. The new BetaShares FTSE -100 Stocks ETF (F100) will provide diversity and potential for Growth whilst paying a reasonable Dividend. What are you projections for the UK Market in the event of a Hard BREXIT and how do you see the UK Market performing Post BREXIT? Your commentary is first class and way ahead of others.” – Richard O.
Morning Richard,
Firstly a much appreciated thank you for the thumbs up.
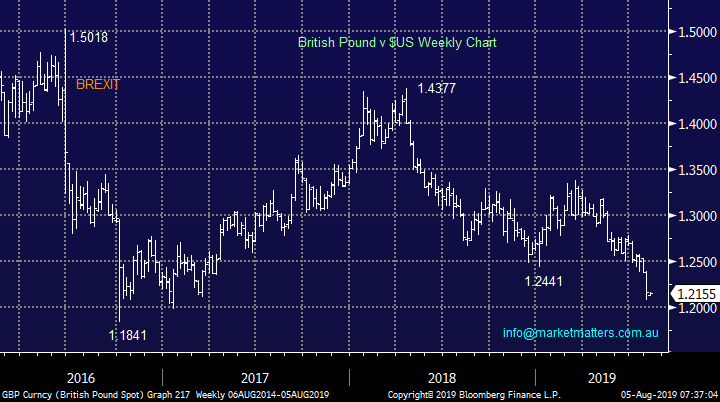
BREXIT is a fiasco which MM has an average track record with thus far, we thought it would have been done and dusted by now, clearly wrong! Here goes again, moving forward we believe the FTSE will outperform Europe due to the weaker Pound which looks destined to fall another ~5%. The good news for UK stocks is that expectations are now extremely low with regard to Europe but their week to week performance is highly corelated to the Pound hence this needs careful monitoring in our opinion.
Until we see the Pound reverse in a meaningful manner the FTSE should outperform.
The UK FTSE Chart
The British Pound Chart
Question 4
“Hi Guys, Long term follower first time for questions. I have been holding EGG for some time now due to a company I use to own being bought many years ago, shares are part of the deal. I see that EGG now has some momentum and price has reached a point where I wonder if I should exit. They are now paying dividends which may be the reason for the increase in price as people look for at least some return on their money in the current market!! What are your thoughts on EGG as an ongoing investment? Thanks Rohan
Hi Rohan,
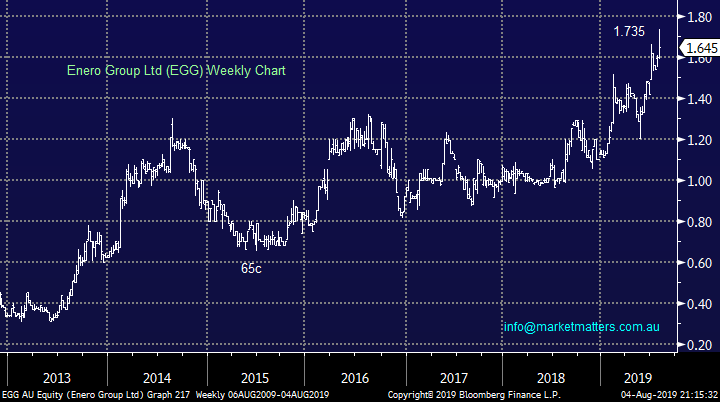
Thanks for the question, we appreciate the engagement. Sydney based marketing business Enero Group (EGG) has indeed enjoyed a solid 5-years and this $140m business now yields over 3% fully franked.
Around 50% of the companies revenue is now from North America which is where the company sees growth while it clearly offers diversification at this point in time. This is not a business I know well but it looks relatively cheap trading on an Est. P/E or 2019 of 12.2x and the dividend certainly helps.
The similar business we currently hold to EGG is IVE Group (IGL) – another integrated marketing business which is housed in the MM Income Portfolio, this trades on a forward P/E 9x while yielding ~7.5% fully franked
MM likes EGG around current levels, technical stops could be used below $1.40.
Enero Group Ltd (EGG) Chart
Question 5
“Hi, ABC has suffered ~30% drop since your Buy recommendation. What is your current opinion? Should I be bailing out, or do you see light at the end of the tunnel for ABC.” – Regards Geoff J.
Hi Geoff,
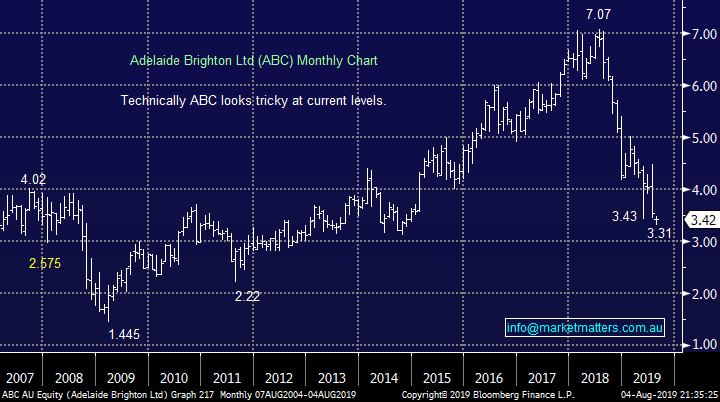
ABC was a shocker last week, no sugar coating on those numbers which disappointed the most conservative amongst us, only back in May they downgraded the current financial year by 10-15%, we wrongly thought they had already cleared the decks - not unreasonable given it was less than 3-months ago!
Moving forward it now appears we have attempted to pick the turn in Australian construction too soon, we were looking for increased infrastructure spending to pick up the slack of its ~30% exposure to the residential market. At this stage although we only have a 3% allocation to the stock we have no intention of averaging at this point in time. The stock has more than halved over the last year which implies it will turn nicely when government stimulus gets the “cement” flowing again but it may take time.
In summary there is a lot of bad news for both the stock and sector built into the price hence MM are likely to sit on our position at this stage but we don’t expect much of a recovery short-term. If we were very bullish the overall market we would be more actively considering a switch.
MM is neutral ABC at present.
Adelaide Brighton (ABC) Chart
Question 6
“Question please: MM's view on CIMIC please? A 10% buyback commences today. Yet interestingly it’s on only 14% of free float (Insiders/Instos own 86% of shares), so it’s actually a 70% buyback of float (32m shares/45m float). The last buyback in January 2016, the share price rose 44% (and they bought only 4% of shares). Also CEO/CFO options expire Nov, worth $7m so they are incentivised to have the share price higher. Thoughts?” – Rodney F.
Morning Rodney,
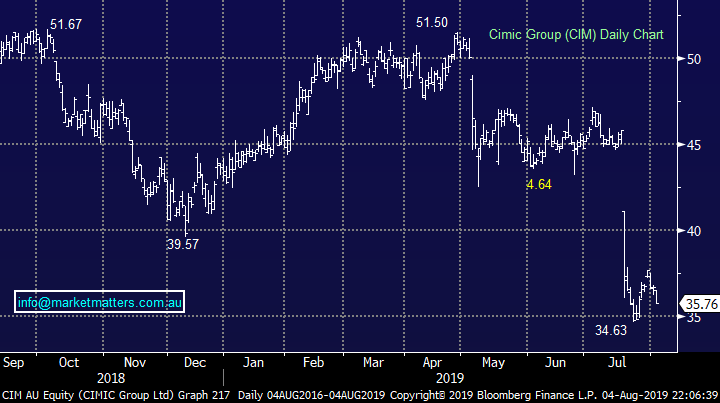
CIMIC (CIM) shares tumbled to 2-year low last month following a soft first half result leaving the company needing a large second half skew to meet its reiterated guidance of $790m-$840m.
One happy camper last month would probably have been Hong Kong-based research group GMT who claimed only in May this year that CIMIC had been "dressing up" its financial statements since it was acquired by Spanish construction group ACS in 2014. At the time GMT argued the stock is worth just $23 per share, claiming in the report that CIMIC's accounting shared many of the features of Carillon, the British construction group that collapsed in January last year. The report by GMT has helped keep MM away from CIM into its recent decline.
On face value, the stock is now yielding 4.4% fully franked which is not irrelevant in today’s environment. Assuming the buyback becomes active this week it clearly should be supportive of the share price to some degree but the downside momentum is strong,
Some other industry insight we have garnered in recent times also paints a negative picture CIM’s current position.
MM has no interest in CIM
CIMIC (CIM) Chart
Question 7
“Your summary this morning about the equities and a US recession was a reflection of the negatives thoughts circulating at the moment. However a couple of interesting points I have found. The first is an article by Shane Oliver with a positive outlook for our equities, Live Wire Link. And secondly, today on the ABC Breakfast show a graph, which I can't reproduce, of US imports of Chinese goods of $500 billion as against Chinese imports of $100 billion of US products. More interesting though it indicates over the period that Trump has placed tariffs on China, there has only been a slight blip in reduction of Americans buying Chinese goods. China is still selling, Americans still buying so what is the point of more tariffs now if they are not working?” – Chris B.
Morning Chris,
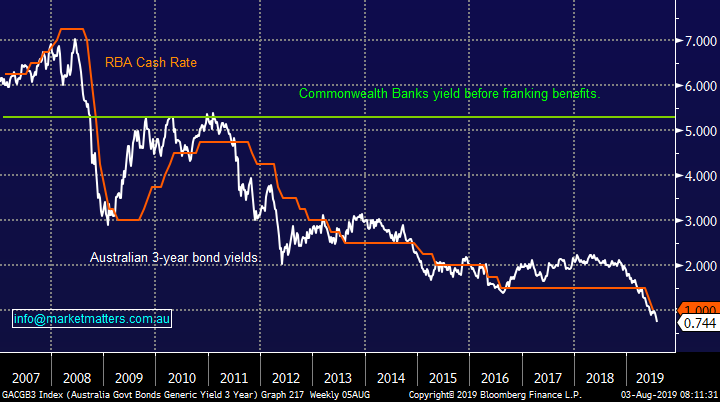
There’s always 2-sides to the proverbial coin, we believe as we touched on in both the Weekend Report and today the stock market is swinging between 2 dominant cycles: a looming global recession and excellent relative value when compared to bond yields. The market feels likely to swing between which factor is dominating market sentiment for most of 2019.
As for Trump, he has an election to win in November 2020 and I have no doubt that will dictate a lot of his moves from here.
Comparing important interest rates & yields Chart
Question 8
“HI MM Team, just your thoughts including technical analysis on Downer EDI (DOW) and PointsBet (PBH). Also is it possible to arrange another webinar with Peter O’Connor from SHAW’s about the iron ore miners, copper and gold etc, again soon thanks for the great reports.” – Tim C.
Hi Tim,
Thanks again for the thumbs up, much appreciated. We have answered each of the 3 questions separately for ease:
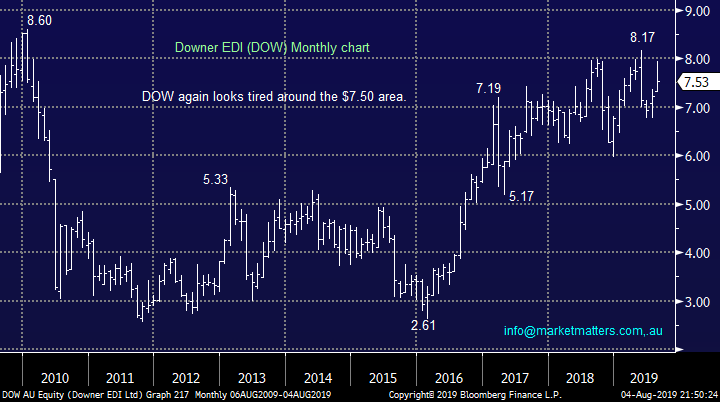
1 – Downer EDI (DOW) $7.53: The engineering group has been swinging around on broker downgrades and snippets of news but overall it should benefit from the federal governments fresh rail and road projects but as we saw with ABC there can be a definite time lag before supportive earnings flow through.
The stocks valuation is not too stretched with the shares trading on an Est P/E for 2012129 of 14.9x while yielding an attractive 3.7% fully franked. Technically the stock looks tired above $7.50.
We like DOW around $6.50.
Downer EDI (DOW) Chart
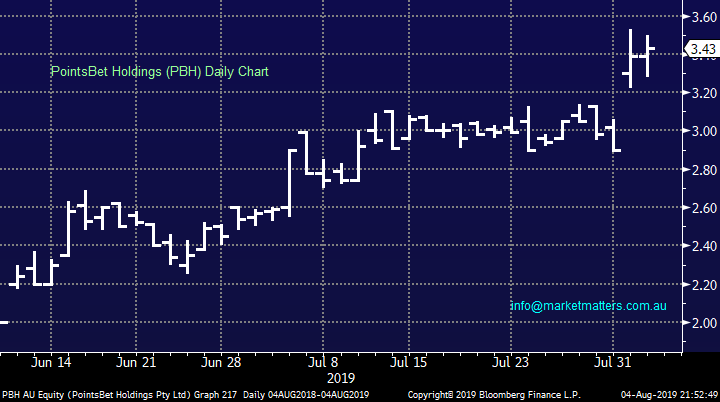
2 – PointsBet Holdings (PBH) $3.43: We don’t follow this $377m online gambling business too closely but its performed well since its float. I think it was done through Bells from memory.
We cannot invest in the business until we see some company performance although technically it looks strong with stops below $3.05.
PointsBet Holdings (PBH) Chart
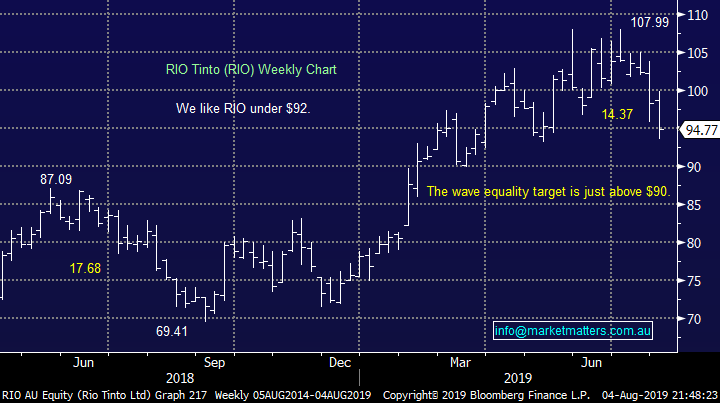
3 – Peter O’Connor is obviously flat out with reporting season, it doesn’t get much busier for him but we will impart snippets of information as they come through – as subscribers know we are looking to accumulate iron ore stocks into current weakness e.g. RIO around $90-92.
As for a video its unfortunately likely to be after August Reporting.
RIO Tinto (RIO) Chart
Question 9
“Hi, I am curious to know if there is a minimum investment amount required or recommended to invest in one of your portfolios?” - Cheers, Paula S.
Morning Paula,
The minimum for our SMA Platinum and Income Portfolio’s is only $5k. Lower amounts enable investors to dip their toe in the water to get a feel on how the product works.
https://www.marketmatters.com.au/news/sma/
However for the personally tailored MDA accounts that I run through Shaws the minimum is $350k.
Question 10
“Hi James, for many years I've watched the individual stock calls by various newsletters, fund managers, brokers etc and it has been surprising to me just how many calls whether on the buy side or the sell side turn out to be wrong in a very short space of time, not weeks or months or years, but days. From what I've observed these opposite moves are not rare but are instead very common place. One would have to ponder whether it's worth depending on one's own view of going the opposite direction to the calls made by people who are mostly regarded as knowing what they are talking about.
I've actually done this very exercise on a couple of your calls over the last year or so and held onto stocks that you have made a sell call on as I didn't agree with that call but that's what makes a market as they say. I did sell at a better price. On the opposite side of this is where I didn't buy on your call and missed some good money.
These are just my observations collected over twenty years odd in the market and it would appear to me that it has some relevance for the brave (going against the crowd is not easy) that needs to be considered, it just occurs too often to be disregarded. You would probably know the saying that goes like this, "Don't follow the crowd as the crowd are generally going the wrong way", it seems it's quite true a remarkable amount of the time with stocks. Can you offer any thoughts on why these opposite directions occur very often and I stress, very often or are most people (those well regarded in the industry) just guessing or thinking they know more than what they actually do.”
Thanks, Steve S.
Hi Steve,
Numbers and returns are what do the talking when it comes to investing, the best of us make mistakes, it’s the nature of the business. In our first year of investing both of the MM SMA’s outperformed their respective benchmarks:
The MM Growth Portfolio returned +12.94% while the Income Portfolio +10.16% - a solid first 12-months
Overnight Market Matters Wrap
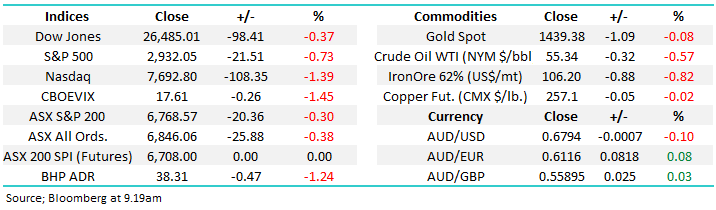
· Global markets remained under pressure on Friday in the wake of the US proposal to introduce 10% tariffs on another US$300bn of Chinese goods, further escalating the ongoing trade war. The release of the US jobs report, which saw the US economy create an expected 164,000 new jobs, which did little to settle investor nerves.
· The European markets were hardest hit in reaction to the proposed tariffs with the UK, German and French markets having one of their worst days of the year, losing between 2.5% and 3.5%. On Wall St the tech sector dragged the Nasdaq in particular down 1.3% while the Dow closed about 98pts lower, having at one stage dropped over 330pts during the day’s trading. Both the S&P 500 and the Nasdaq recorded their weakest week of 2019 dropping 3.1% and 3.9% respectively and the Dow its second weakest, losing 2.6%.
· The commodities market remained volatile on the back of the escalating trade dispute, with the iron ore price in particular 7% weaker (US$107.7/tonne) and the copper price 3% weaker. Gold consolidated the previous day’s gains at near 6 year highs, with the spot price hovering around US$1440/oz, while oil recovered 3% from the previous day’s sell off. The A$ is trading below US68c.
Have a great day!
James & the Market Matters Team
Disclosure
Market Matters may hold stocks mentioned in this report. Subscribers can view a full list of holdings on the website by clicking here. Positions are updated each Friday, or after the session when positions are traded.
Disclaimer
All figures contained from sources believed to be accurate. Market Matters does not make any representation of warranty as to the accuracy of the figures and disclaims any liability resulting from any inaccuracy. Prices as at 05/08/2019
Reports and other documents published on this website and email (‘Reports’) are authored by Market Matters and the reports represent the views of Market Matters. The MarketMatters Report is based on technical analysis of companies, commodities and the market in general. Technical analysis focuses on interpreting charts and other data to determine what the market sentiment about a particular financial product is, or will be. Unlike fundamental analysis, it does not involve a detailed review of the company’s financial position.
The Reports contain general, as opposed to personal, advice. That means they are prepared for multiple distributions without consideration of your investment objectives, financial situation and needs (‘Personal Circumstances’). Accordingly, any advice given is not a recommendation that a particular course of action is suitable for you and the advice is therefore not to be acted on as investment advice. You must assess whether or not any advice is appropriate for your Personal Circumstances before making any investment decisions. You can either make this assessment yourself, or if you require a personal recommendation, you can seek the assistance of a financial advisor. Market Matters or its author(s) accepts no responsibility for any losses or damages resulting from decisions made from or because of information within this publication. Investing and trading in financial products are always risky, so you should do your own research before buying or selling a financial product.
The Reports are published by Market Matters in good faith based on the facts known to it at the time of their preparation and do not purport to contain all relevant information with respect to the financial products to which they relate. Although the Reports are based on information obtained from sources believed to be reliable, Market Matters does not make any representation or warranty that they are accurate, complete or up to date and Market Matters accepts no obligation to correct or update the information or opinions in the Reports. Market Matters may publish content sourced from external content providers.
If you rely on a Report, you do so at your own risk. Past performance is not an indication of future performance. Any projections are estimates only and may not be realised in the future. Except to the extent that liability under any law cannot be excluded, Market Matters disclaims liability for all loss or damage arising as a result of any opinion, advice, recommendation, representation or information expressly or impliedly published in or in relation to this report notwithstanding any error or omission including negligence.