Does the Healthcare sector look poised to repeat 2018? (CSL, COH, RMD, ANN, PME)
Yesterday following an explosive pre-market open by the US futures the ASX200 opened stronger than previously anticipated, up around 50-points. Unfortunately the sellers proceeded to take hold resulting in a fairly lacklustre day which saw the market close up a mere +0.25% with only 55% of stocks in the ASX200 managing to close in positive territory. The “Big 4” banks continued to perform strongly all closing positive on the day while the Energy and IT sectors were the most noticeable areas of weakness – we expected falls by the oil stocks following a plunge in the underlying commodity discussed yesterday but the IT stocks failing to follow the positive sector lead from Wall Street was a surprise e.g. Xero (XRO) -1.8%, Appen Ltd (APX) -1.4% and Altium (ALU) -1.4%.
The intra-day selling within the IT sector supports our opinion that the risk / reward towards the group suggests being patient - looking for lower prices remains the logical action e.g. Appen Ltd (APX) fell 6.3% from its positive open as investors clearly were comfortable to sell into strength. Our target area for this machine learning and artificial intelligence (AI) business remains ~8% lower. Interestingly the local IT sector has felt spooked of late while the US tech based NASDAQ remains firm closing overnight only 4% below its all-time high.
Short-term MM remains comfortable adopting a conservative stance towards equities around current market levels.
Overnight global stocks were firm enjoying continued optimism around US – China trade and another interest rate cut by the European Central Bank (ECB) to minus -0.5% plus it announced another round of QE through the purchase of bonds - The same old story but when will Europe finally show some green shoots of recovery. The SPI futures are pointing to an open up over 20-points with BHP and the resources sector looking poised for further gains.
This morning MM is going to look at the Healthcare sector which may be set for a period of underperformance if / when bond yields do bottom out.
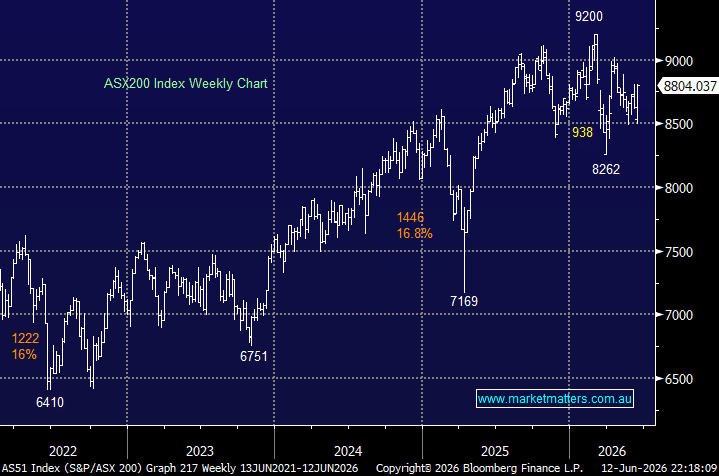
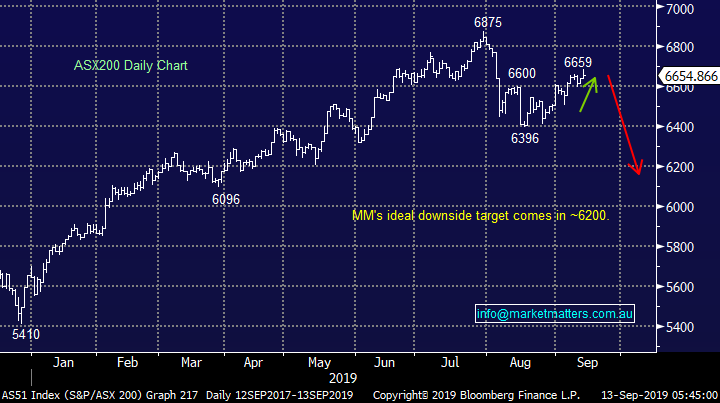
ASX200 Chart
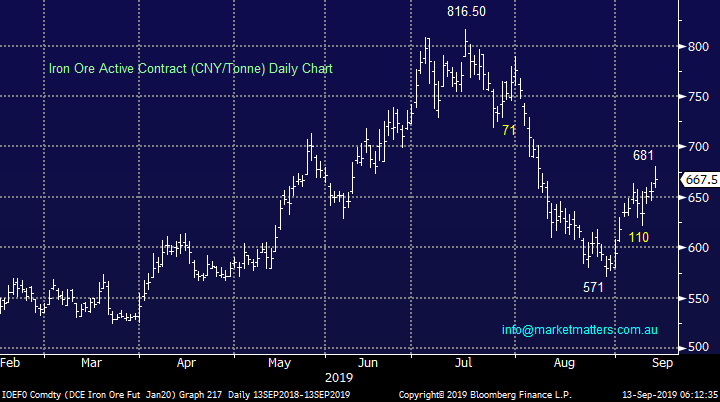
Yesterday Fortescue (FMG) closed above $9 for the first time since the first week in July, its been an impressive 36% recovery by FMG considering iron ore has only bounced 19%. More noticeably FMG is back very close to its all time high, especially considering its recently traded ex-dividend, whereas the bulk commodity is languishing over 20% below its July high. We interpret this in 2 ways:
1 – The market never really believed the iron ore price around 800 was sustainable hence FMG didn’t get too carried away rallying above $9.
2 – FMG remains an excellent well positioned business whose anticipated 5.6% fully franked yield remains attractive, especially into stock weakness.
However we are conscious that the iron ore sector has largely recovered as MM has been calling it over recent months. If we reduce our exposure to the space its more likely to be through BHP or RIO, as opposed to FMG.
MM remains bullish FMG but cautious at current levels.
Iron Ore (CNY/Tonne) Chart
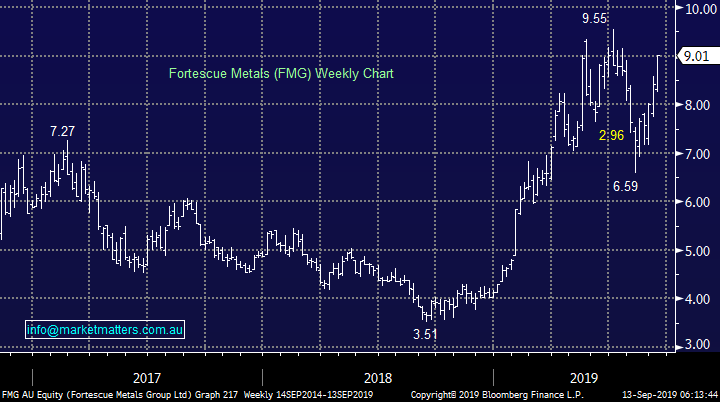
Fortescue Metals (FMG) Chart
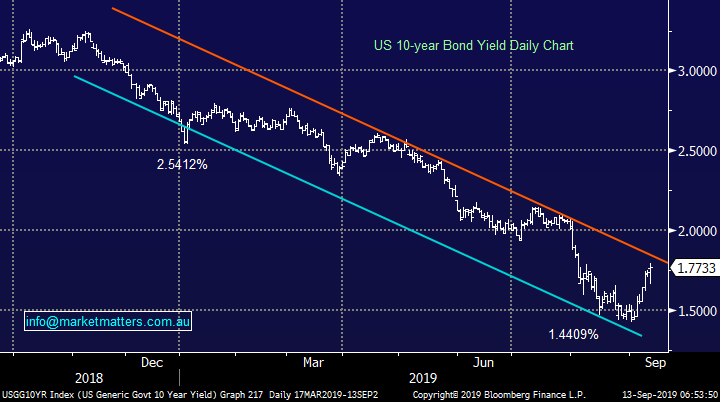
Overnight saw a continuation of the rally by US bond yields on optimism around US – China trade, markets are certainly creating room for disappointment from the looming October trade talks in Washington. We would rather now buy dips in bond yields as opposed to sell rallies but as we approach the clear ~1.8% resistance area a strong pullback would not surprise.
Overall the down trend in US & global bond yields has been fairly dramatic in 2019 with many market followers anticipating a recession in the next 12-months i.e. about 60% of Americans now believe a recession is very likely in the near future. However as we saw last night with the ECB, global central banks are determined to maintain post GFC economic expansion at all costs, a job that in our opinion gets tougher every quarter e.g. the ECB dropping interest rates further into negative territory feels like a certain degree of almost panic our end.
On balance MM thinks US bond yields will at least test sub 1.5% one more time.
US 10-year Bond yield Chart
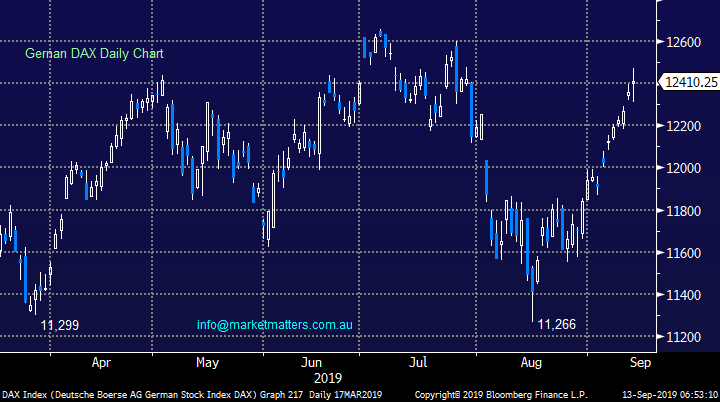
Interestingly, although Europe received the shot in the arm it was looking for with a rate cut plus more QE the reaction was pretty muted implying that much of the bullish influence was already priced into stocks.
On balance MM is now neutral European stocks.
German DAX Chart
How does the Healthcare sector look as Christmas approaches
The Australian Healthcare sector has been the classic “go to” space for many Australian investors both pre and post the GFC, a strategy that has undoubtedly paid excellent dividends. The sector has enjoyed 3 major macro-economic tailwinds:
1 – Both a growing and ageing Australian population.
2 – A weak Australian dollar which has suited many stocks in the sector that enjoy strong offshore earnings.
3 – Falling bond yields which has seen the Australian 10-year bond tumble from above 15% in the 1980’s to below 1% in the last few weeks.
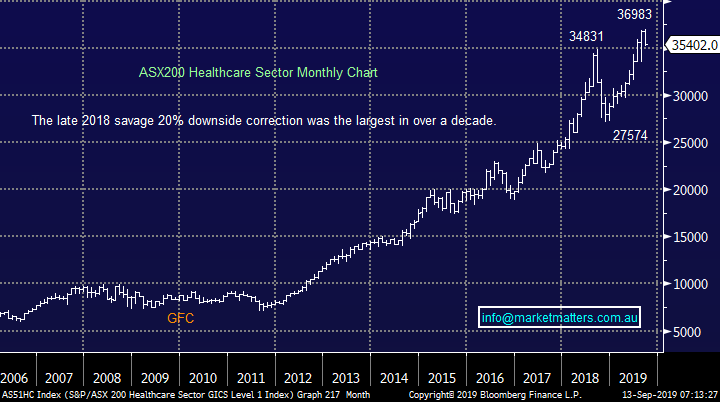
At MM we feel the last 2 have almost finished delivering for the sector hence we pose the question, “is it time to take some $$ from the table?”. This time last year the sector was approaching its greatest sell-off in over a decade as investors and momentum traders alike dumped the high valuation / growth stocks, we put the possibility of a repeat performance at ~25% i.e. technically the sector looks very vulnerable to a retest of Q4 lows, now a significant +20% away.
MM is very cautious the Healthcare Sector at current levels.
ASX200 Healthcare Sector Chart
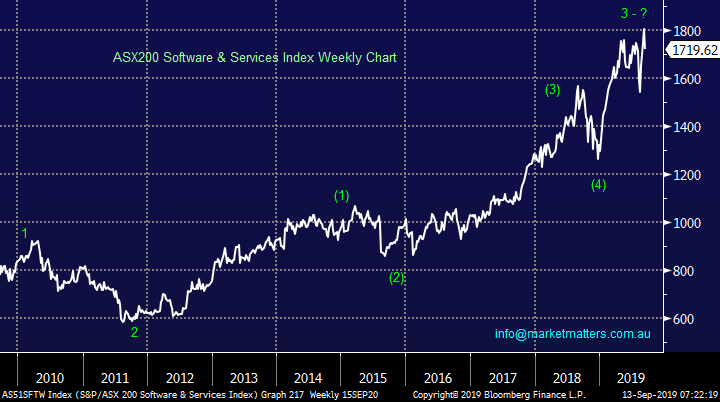
Today I have briefly looked at 5 stocks in the sector as the other high value / growth area the local IT sector starts to “wobble” after recently making fresh al-time highs.
MM is short-term bearish the local IT sector.
ASX200 Software & Services Index Chart
Today we have briefly looked at 5 Australian Healthcare stocks deliberately focusing on the big end of town, or the prime “go to “ candidates of recent years.
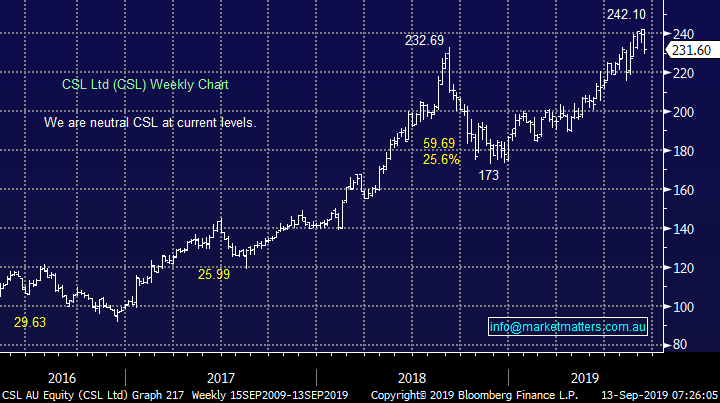
1 CSL Ltd (CSL) $231.60
Human blood plasma business CSL is arguably the most successful company in the ASX200, it’s become the second largest company on the bourse with a market cap of $105bn, only Commonwealth Bank is now larger with a market cap of $144bn. The company delivered a very strong result for the 2019 Financial Year (FY) showing an 11% increase in revenue to $US8.5bn leading to a 17% rise in Net Profit After Tax (NPAT) to almost $US2bn, a very impressive set of numbers for such a large business – an ideal candidate to buy into the next pullback.
However like most stocks it hasn’t been a straight line ascent with corrections of 25%, 18% and again 25% over the last 3-years alone, in other words this world quality business has often provided excellent opportunities for the investor to buy / accumulate stock. Technically the stock looks ok but it is threatening a repeat performance of Q4 2018 with sub $200 the potential target area – this is a world class business which MM is keen to again own, especially in its Growth Portfolio, but from a risk / reward basis current levels feel simply too rich.
MM is neutral / negative CSL at current levels.
CSL Ltd (CSL) Chart
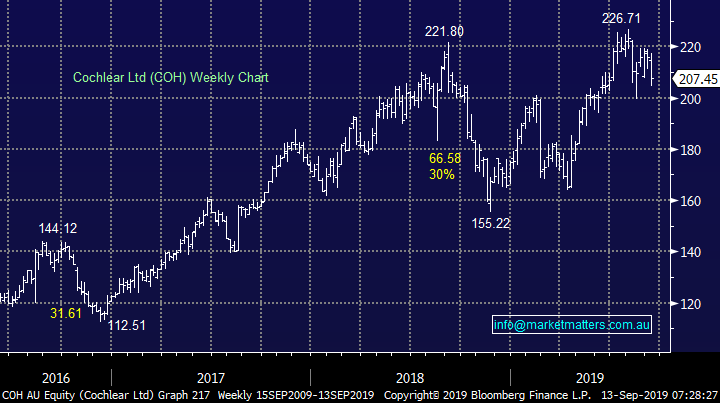
2 Cochlear (COH) $207.45
Hearing aid implant company COH looks and feels very similar to CSL. The company delivered a full year profit of ~$265m plus some bullish commentary but we note that its rivals gained some market share, never a good sign.
However technically COH is now generating sell signals as it breaks back below $220 with a target area over 10% lower.
MM is neutral / negative COH looking for ~10% downside.
Cochlear (COH) Chart
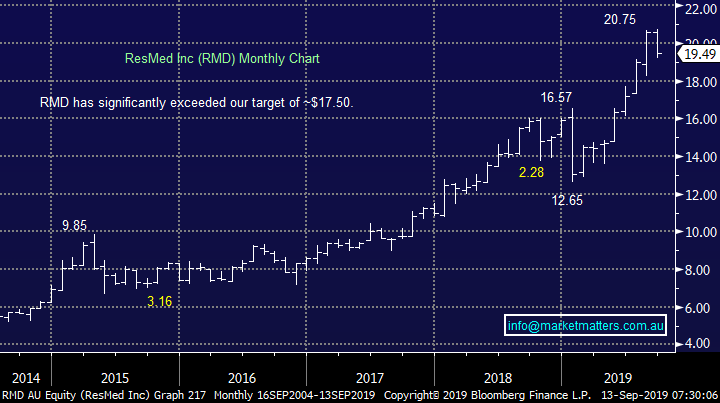
3 ResMed (RMD) $19.49
Sleeping disorder business RMD has rallied further and harder than we expected, a definite example of taking our $$ too early in 2019. The San Diego based business reported a profit of $US121 for the quarter under the 30th of June but it appears to be the strong sales figures of new product sales that’s sent the stock soaring in 2019.
Technically the stock looks ready for a period of rotation between around $18.50 and $20.50.
MM is neutral RMD.
ResMed (RMD) Chart
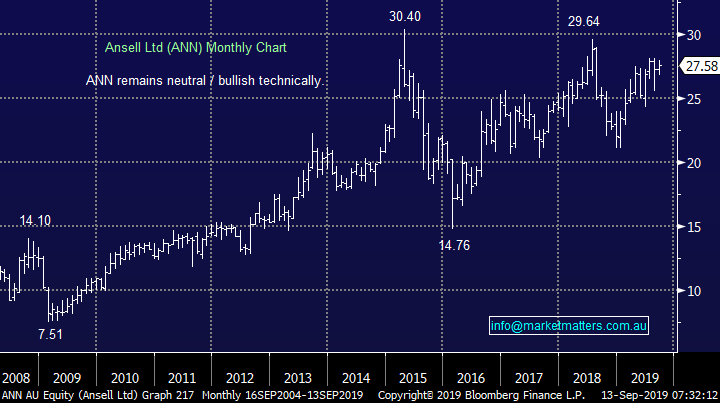
4 Ansell Ltd (ANN) $27.58
Health and Safety business ANN is trading at the same level as back in 2015, its recent profit numbers were solid showing sales up slightly to almost $1.5bn while the company announced a buyback of just over 10m shares.
Technically the stock remains neutral with a slight positive bias.
MM is neutral ANN.
Ansell Ltd (ANN) Chart
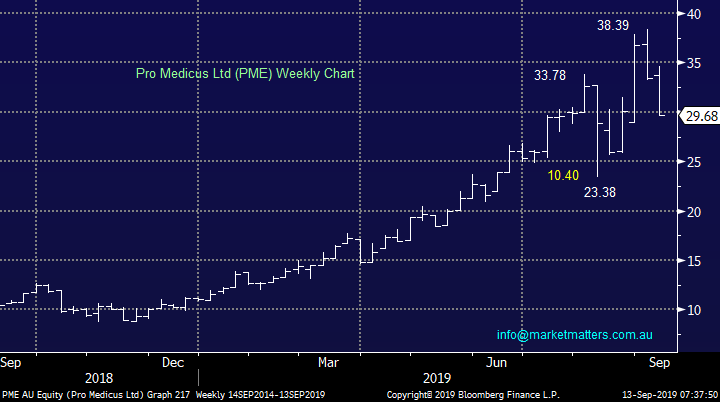
5 Pro Medicus Ltd (PME) $29.68
New stock off the block PME provides software & IT solutions for the medical industry, its clearly enjoyed an extraordinary run in 2019 rallying by 4-fold. However the stock tumbled last week after significant sales of shares by 2 of the company’s founders – who can blame them after the share price appreciation. However it should be noted they only sold 3.5% of their holdings, in other words they still have plenty of skin the game. Also it should be noted that the board encouraged the sale to add some liquidity to the stock.
The current sell-off feels like a buying opportunity if it continues down towards $25.
MM is short-term negative PME targeting the $25 area.
Pro Medicus Ltd (PME) Chart
Conclusion (s)
MM is unlikely to buy stocks in the Healthcare sector at current levels believing there is a reasonable possibility of a repeat performance of Q4 2018 i.e. an aggressive decline by the sector.
Global Indices
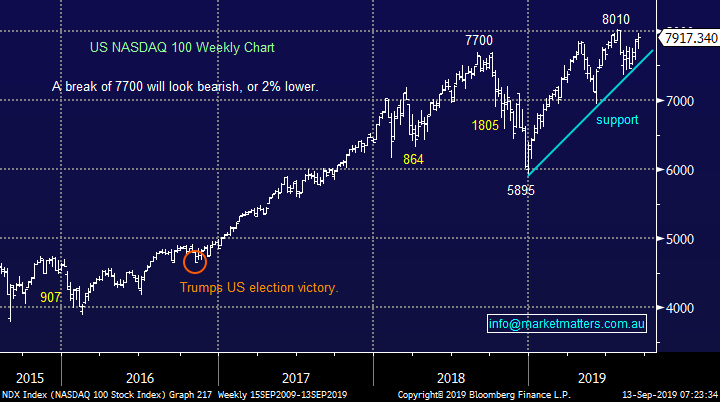
No major change yet, we are looking for a decent pullback for US stocks but no specific sell signals have been triggered – note at the moment we still feel a break to fresh all-time highs will fail to aggressively follow through to the upside.
US stocks will generate a short-term sell signal if the NASDAQ breaks the uptrend line shown below in blue.
US NASDAQ Index Chart
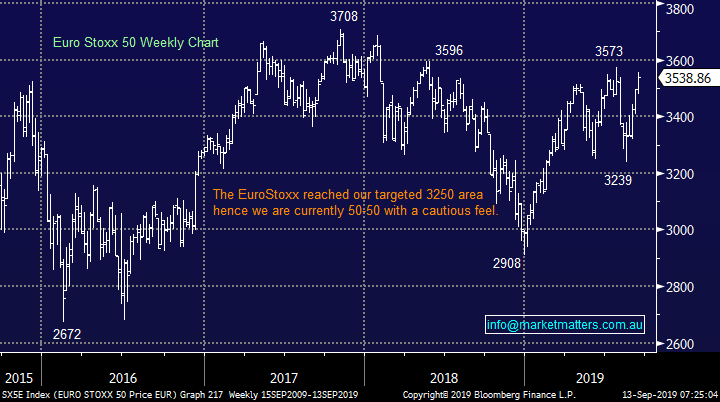
No change again with European indices, while we remain cautious European stocks as their tone has become more bearish over the last few months, however we had been targeting a correction of at least 5% for the broad European indices, this has now been achieved.
The long-term trend is up hence any “short squeezes” might be harder and longer than many anticipate, potentially one is currently unfolding.
Euro Stoxx 50 Chart
Overnight Market Matters Wrap
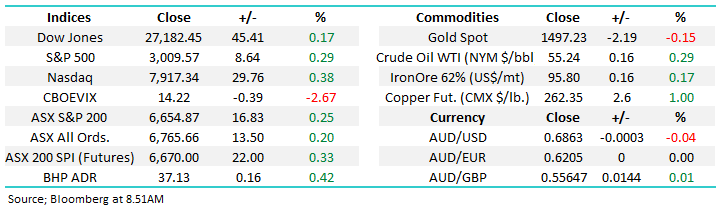
· The SPI is up 22 points after more gains in US equities overnight. The Dow rose for the seventh successive session, up 0.2%, while the S&P 500 is getting close to an all-time high, +0.3%. The NASDAQ also closed 0.3% in the black.
· Mario Draghi, the head of the ECB, announced the resumption of quantitative easing and cut its key interest rate to a record low. US-China trade tensions continue to ease with talks of an interim deal and a roll-back of some US tariffs in exchange for IP commitments and agricultural purchases.
· Trump wasn’t happy that the ECB is cutting rates and depreciating the Euro as it puts upward pressure on the $US and hurts the US ability to export. He continued his attack on the Fed by saying they are just sitting around while the Europeans get paid to borrow money.
· Nickel and copper rose on the LME, while aluminium fell. Iron ore rose 5% to trade close to $US100/t while gold is at $US1500/oz. Oil fell after OPEC+ applied more pressure on members who haven’t complied with cuts.
Have a great day!
James & the Market Matters Team
Disclosure
Market Matters may hold stocks mentioned in this report. Subscribers can view a full list of holdings on the website by clicking here. Positions are updated each Friday, or after the session when positions are traded.
Disclaimer
All figures contained from sources believed to be accurate. All prices stated are based on the last close price at the time of writing unless otherwise noted. Market Matters does not make any representation of warranty as to the accuracy of the figures or prices and disclaims any liability resulting from any inaccuracy.
Reports and other documents published on this website and email (‘Reports’) are authored by Market Matters and the reports represent the views of Market Matters. The Market Matters Report is based on technical analysis of companies, commodities and the market in general. Technical analysis focuses on interpreting charts and other data to determine what the market sentiment about a particular financial product is, or will be. Unlike fundamental analysis, it does not involve a detailed review of the company’s financial position.
The Reports contain general, as opposed to personal, advice. That means they are prepared for multiple distributions without consideration of your investment objectives, financial situation and needs (‘Personal Circumstances’). Accordingly, any advice given is not a recommendation that a particular course of action is suitable for you and the advice is therefore not to be acted on as investment advice. You must assess whether or not any advice is appropriate for your Personal Circumstances before making any investment decisions. You can either make this assessment yourself, or if you require a personal recommendation, you can seek the assistance of a financial advisor. Market Matters or its author(s) accepts no responsibility for any losses or damages resulting from decisions made from or because of information within this publication. Investing and trading in financial products are always risky, so you should do your own research before buying or selling a financial product.
The Reports are published by Market Matters in good faith based on the facts known to it at the time of their preparation and do not purport to contain all relevant information with respect to the financial products to which they relate. Although the Reports are based on information obtained from sources believed to be reliable, Market Matters does not make any representation or warranty that they are accurate, complete or up to date and Market Matters accepts no obligation to correct or update the information or opinions in the Reports. Market Matters may publish content sourced from external content providers.
If you rely on a Report, you do so at your own risk. Past performance is not an indication of future performance. Any projections are estimates only and may not be realised in the future. Except to the extent that liability under any law cannot be excluded, Market Matters disclaims liability for all loss or damage arising as a result of any opinion, advice, recommendation, representation or information expressly or impliedly published in or in relation to this report notwithstanding any error or omission including negligence.