5800 breaks…Whoohoo! Highest close since mid 2015
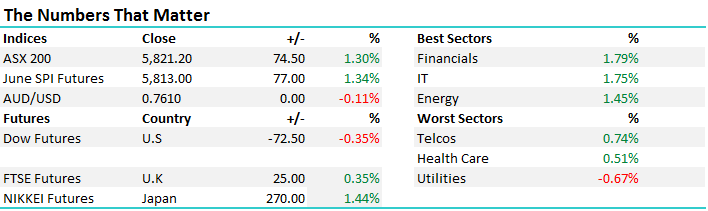

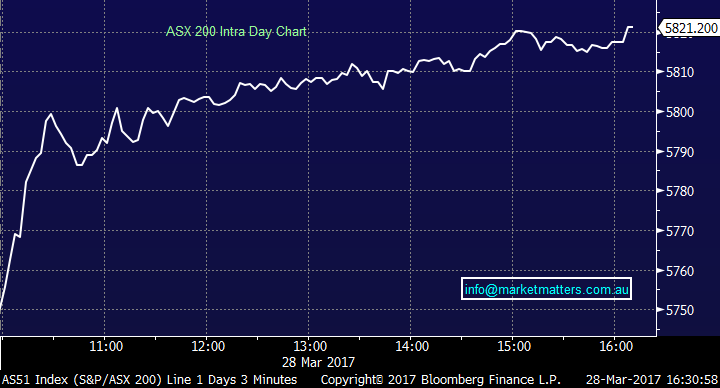
A long time coming however the market has finally broken and closed above the 5800 level that has been this big overarching cap in our market over the past few months. We had a crack at it in mid Jan and another crack in mid Feb however on both occasions we failed and sold off thereafter. Today was a very strong session particular given it came off a weak lead from the US overnight. If the mkt was going to sell off, it would have done last night in the US and here today. Stepping back a minute and looking at trade last night overseas, the US market was actually strong, despite closing down with stocks rallying a long way up from the lows (about +140pts in terms of the DOW) and closed near the highs. Today we opened up OK but the buying really kicked in from around 10.20 and was sustained throughout the day and it was broad based – across all sectors….we had a range of +/- 72 points, a high of 5821 , a low of 5748 and a close of 5821, up +74pts or +1.3%.
ASX 200 Intra-Day Chart
ASX 200 Daily Chart
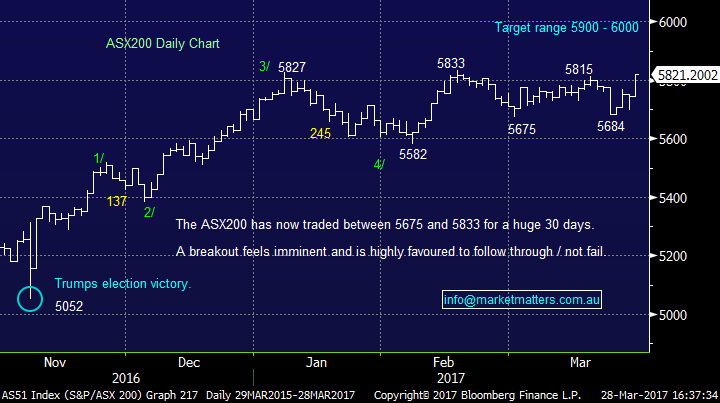
So it’s pretty clear from the charts above that the market is currently in a bullish mood, yet a lot of fund managers are still bearish with cash on the sidelines. On the desk, we speak with a lot of insto’s who are still calling the market lower, cashed up and ready to buy. It’s one of the reasons we sighted last week for extremely low volatility, the fact no one was really wanting to buy protection given high cash levels and the desire to BUY any pullback that eventuated. As we’ve said on numerous occasions, markets generally move in the direction of most pain and right now that is up…
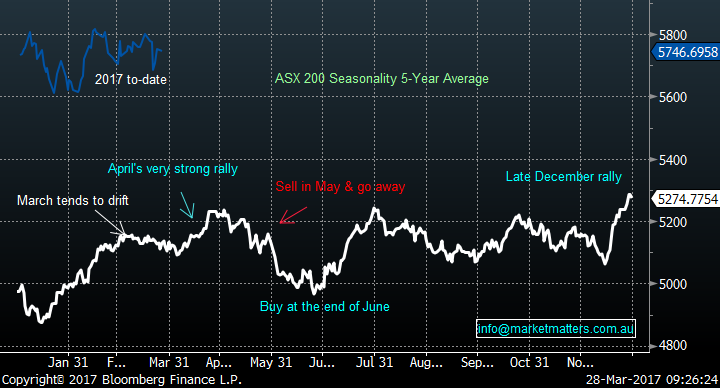
From a technical standpoint, we’re now looking for a move up to 5900/6000 in quick succession over the next 4-5 weeks. This bullish outlook which we have held for a while is founded on April being seasonally the strongest month for Australian equities with our expectations for the banks to rally ~4% in April – and they’re a big contributor to the index.
ASX200 Seasonality Chart
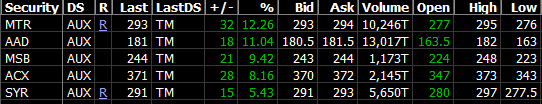
Looking at the best performances today, there are a lot of the dogs which are starting to bark (Mantra being one of them) and this is another sign of high cash levels – fundies being forced into the market so naturally they buy perceived value.
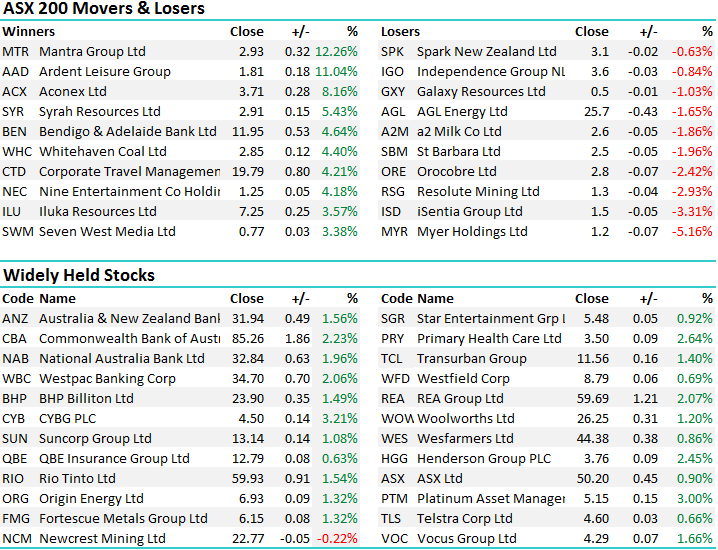
Below are the top 5 stocks in the 200 today…MTR is down -35% for the year, Ardent Leisure (AAD) is down -21%, MSB is down 5%, ACX has lost -38% and SYR is off by 28% - all dogs that were bought up as the market breaks out of its current trading range…
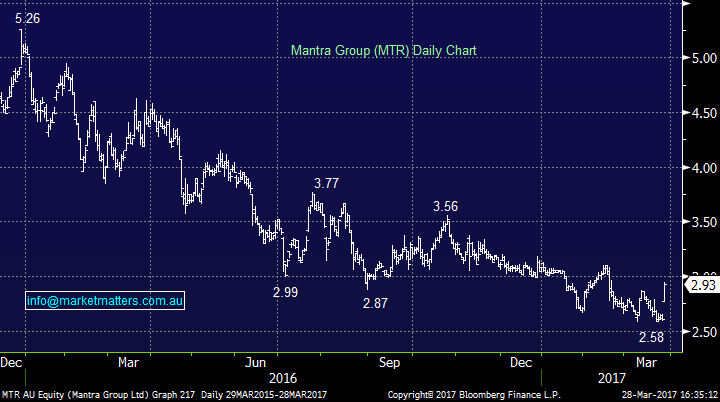
Mantra (MTR) – a stock we wrote about this morning topped the leader board today on more takeover speculation, although we were targeting a move closer to $2.50. We traded MTR earlier in the year and took a loss after closing it on the drop below $3. The stock got away from us today and we’re fairly committed to the market so didn’t chase however a rally of +12.26% clearly highlights that we’re on the right track….
Mantra (MTR) Daily Chart
Have a great night, GO THE MARKET!!
The Market Matters Team
Disclosure
Market Matters may hold stocks mentioned in this report. Subscribers can view a full list of holdings on the website by clicking here. Positions are updated each Friday.
Disclaimer
All figures contained from sources believed to be accurate. Market Matters does not make any representation of warranty as to the accuracy of the figures and disclaims any liability resulting from any inaccuracy. Prices as at 28/03/2017. 5.00PM.
Reports and other documents published on this website and email (‘Reports’) are authored by Market Matters and the reports represent the views of Market Matters. The MarketMatters Report is based on technical analysis of companies, commodities and the market in general. Technical analysis focuses on interpreting charts and other data to determine what the market sentiment about a particular financial product is, or will be. Unlike fundamental analysis, it does not involve a detailed review of the company’s financial position.
The Reports contain general, as opposed to personal, advice. That means they are prepared for multiple distributions without consideration of your investment objectives, financial situation and needs (‘Personal Circumstances’). Accordingly, any advice given is not a recommendation that a particular course of action is suitable for you and the advice is therefore not to be acted on as investment advice. You must assess whether or not any advice is appropriate for your Personal Circumstances before making any investment decisions. You can either make this assessment yourself, or if you require a personal recommendation, you can seek the assistance of a financial advisor. Market Matters or its author(s) accepts no responsibility for any losses or damages resulting from decisions made from or because of information within this publication. Investing and trading in financial products are always risky, so you should do your own research before buying or selling a financial product.
The Reports are published by Market Matters in good faith based on the facts known to it at the time of their preparation and do not purport to contain all relevant information with respect to the financial products to which they relate. Although the Reports are based on information obtained from sources believed to be reliable, Market Matters does not make any representation or warranty that they are accurate, complete or up to date and Market Matters accepts no obligation to correct or update the information or opinions in the Reports.
If you rely on a Report, you do so at your own risk. Any projections are estimates only and may not be realised in the future. Except to the extent that liability under any law cannot be excluded, Market Matters disclaims liability for all loss or damage arising as a result of any opinion, advice, recommendation, representation or information expressly or impliedly published in or in relation to this report notwithstanding any error or omission including negligence.
To unsubscribe. Click Here


