With the US midterms over, whats on the markets agenda now?
President Trump has lost the House of Reps, leading many to question if this will be the end to the longest bull market in history. The overnight rally by US stocks certainly implies not.
The first thing to do is to reflect on recent market moves:
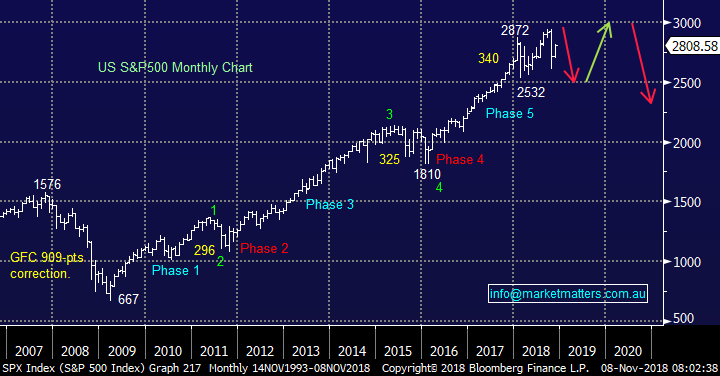
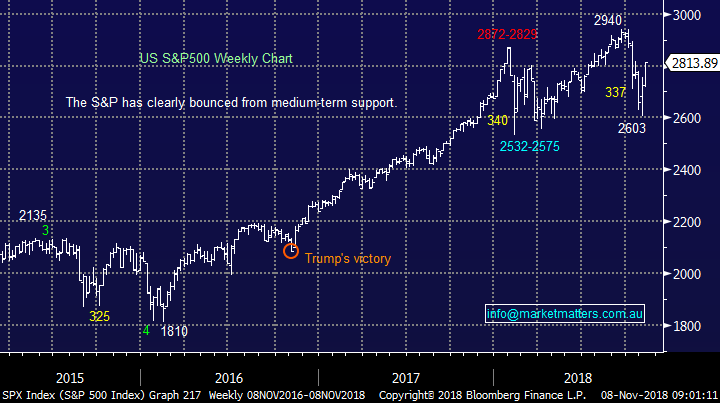
1 – The S&P500 had rallied over 40% since Donald Trump surprised the world and became President back in November 2016.
2 – However last month we saw stocks close down 7% after tumbling over 10% at one stage.
US S&P500 Chart
 Since World War 2 there have been 18 mid-term elections so let’s review what usually happens into these votes:
1 – The second year of a Presidents term is usually the worst for stocks, which is when the mid-terms occur i.e. in the case of President Trump that’s now (2018).
2 – Delving a touch deeper leading into the mid-term elections stocks are usually weak falling on average 1% by the end of October compared to an average rise of ~7% in years without the worry of these elections.
As we know markets hate uncertainty but once the elections have passed markets usually have a cracking time.
The statistics for next year are simply remarkable and most certainly not something to fight even if all correlations do eventually get broken:
1 – Following the mid-term votes US stocks have been higher 100% of the time one year later and this obviously includes a full mix of Democrat and Republican perceived victories in both the House and Senate.
2 – The average rise over the year following the mid-terms is an astounding +17% and that’s not from any panic lows in the year but simply post vote.
Since World War 2 there have been 18 mid-term elections so let’s review what usually happens into these votes:
1 – The second year of a Presidents term is usually the worst for stocks, which is when the mid-terms occur i.e. in the case of President Trump that’s now (2018).
2 – Delving a touch deeper leading into the mid-term elections stocks are usually weak falling on average 1% by the end of October compared to an average rise of ~7% in years without the worry of these elections.
As we know markets hate uncertainty but once the elections have passed markets usually have a cracking time.
The statistics for next year are simply remarkable and most certainly not something to fight even if all correlations do eventually get broken:
1 – Following the mid-term votes US stocks have been higher 100% of the time one year later and this obviously includes a full mix of Democrat and Republican perceived victories in both the House and Senate.
2 – The average rise over the year following the mid-terms is an astounding +17% and that’s not from any panic lows in the year but simply post vote.
 This year may feel wild or weak to many but as an index its simply up a few %, the volatile swings in January / February and of course October just hindered sentiment. Importantly if 2018/9 follows the script, we should expect the market to surge in November after the uncertainty of the elections are behind us – the Dow’s rally last night certainly supports this view.
MM has held the below path for the S&P500 as our preferred scenario for 2018/9 and at this stage it feels good – don’t get me wrong we were nervous at times last month but our Growth Portfolio is 93% committed to equities compared to starting October significantly underweight and carrying 2 negative facing ETF’s.
We should also remember the latest clues from the Bank of America’s Fund Manager survey released late last month:
1 – 85% of fund managers believe we are “late cycle” for growth, the highest since November 2008, a few months before the start of the longest bull market in history i.e. they’re bearish.
2 – Fund managers cut their exposure to US stocks by 17% last month citing valuations as the main reason why, these investors may be forced to buy back in at higher prices.
S&P 500 Chart
This year may feel wild or weak to many but as an index its simply up a few %, the volatile swings in January / February and of course October just hindered sentiment. Importantly if 2018/9 follows the script, we should expect the market to surge in November after the uncertainty of the elections are behind us – the Dow’s rally last night certainly supports this view.
MM has held the below path for the S&P500 as our preferred scenario for 2018/9 and at this stage it feels good – don’t get me wrong we were nervous at times last month but our Growth Portfolio is 93% committed to equities compared to starting October significantly underweight and carrying 2 negative facing ETF’s.
We should also remember the latest clues from the Bank of America’s Fund Manager survey released late last month:
1 – 85% of fund managers believe we are “late cycle” for growth, the highest since November 2008, a few months before the start of the longest bull market in history i.e. they’re bearish.
2 – Fund managers cut their exposure to US stocks by 17% last month citing valuations as the main reason why, these investors may be forced to buy back in at higher prices.
S&P 500 Chart