Where to next for the ASX, bond yield, the AUD and more
**This is an extract from the Market Matters Weekend Report from 20 October. Click here to get access to the full report and more
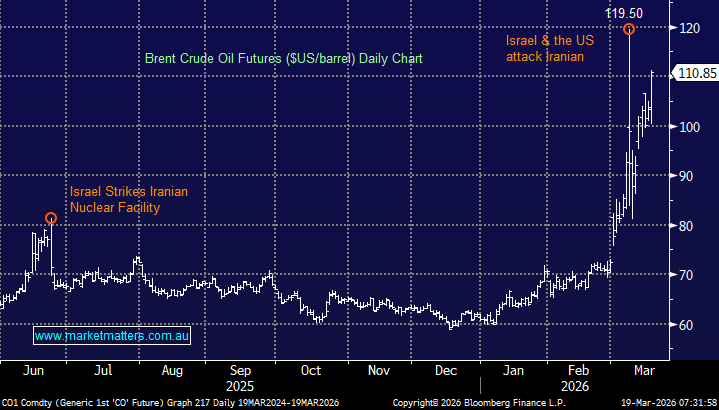
The ASX200 may have traded sideways for almost 20-weeks but after surging 27% from last Decembers 5410 low a prolonged period of consolidation is normal, it’s just unfortunately easy for investors to get “too close” to a market and expect movement almost weekly – remember markets trade sideways ~85% of the time. When we stand back and look at the local market since late December 2018 the technical picture is fairly straightforward:
1 – The ASX200 is forming a bullish “Flag Pattern” with a mid-point at 6133 hence we should be looking for opportunities to buy weakness while 6100 holds.
2 – After the prolonged period of consolidation a break through the initial support / resistance lines shown in blue / red has an ever increasing chance of follow through.
3 – However the major support / resistance levels that have contained the market since June will obviously take some breaking.
4 – The ultimate risk / reward technical signal is generated by a false break of one of the major 6396 or 6875 levels.
At this stage we are adopting a more neutral stance towards the ASX200.
ASX200 Index Chart
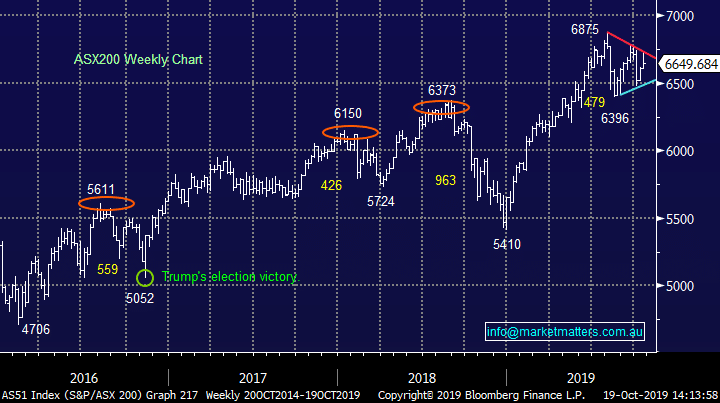 The recent positive news flow on US-China trade, BREXIT plus comments by the RBA has seen market sentiment improve with the local 3-year bond yield managing to rally back to the RBA Cash Rate of 0.75%, due to the very low starting point the move actually represented a 37% increase. After listening to the Philip Lowe our current view is the RBA will now only lower rates further if it sees another strong leg lower in Australian economic data, as we’ve said a few time this week we prefer more targeted fiscal stimulus moving forward believing further rate cuts will have little impact at present, especially as the important property market appears to have bottomed for now.
Hence our underlying view around bond yields is unchanged:
1 – MM has no interest in the “yield play” sectors e.g. Utilities and Real Estate.
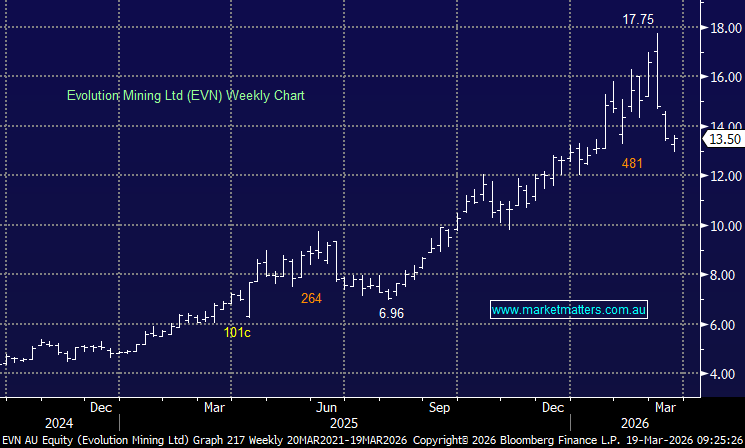
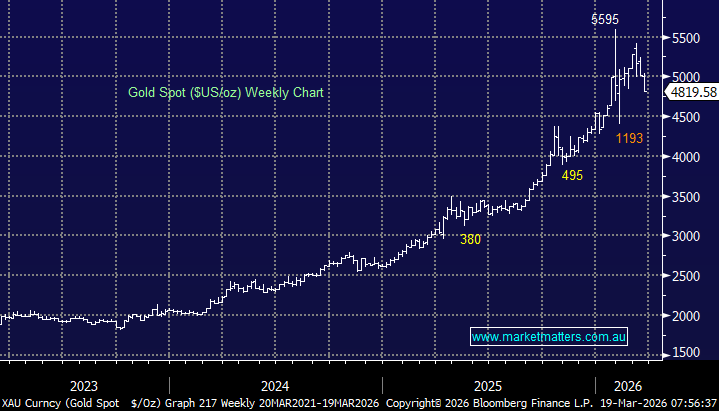
2 – MM is a touch cautious on our gold exposure, it’s a sector that usually enjoys declining bond yields.
3 - MM believes the cyclicals will outperform growth & defensives into 2020.
4 – MM is not keen on stocks who may struggle if we see the $A rally into 2020 i.e. we believe the weak local currency tailwind is coming to an end.
Australian 3-year bond yield & RBA Cash Rate Chart
The recent positive news flow on US-China trade, BREXIT plus comments by the RBA has seen market sentiment improve with the local 3-year bond yield managing to rally back to the RBA Cash Rate of 0.75%, due to the very low starting point the move actually represented a 37% increase. After listening to the Philip Lowe our current view is the RBA will now only lower rates further if it sees another strong leg lower in Australian economic data, as we’ve said a few time this week we prefer more targeted fiscal stimulus moving forward believing further rate cuts will have little impact at present, especially as the important property market appears to have bottomed for now.
Hence our underlying view around bond yields is unchanged:
1 – MM has no interest in the “yield play” sectors e.g. Utilities and Real Estate.
2 – MM is a touch cautious on our gold exposure, it’s a sector that usually enjoys declining bond yields.
3 - MM believes the cyclicals will outperform growth & defensives into 2020.
4 – MM is not keen on stocks who may struggle if we see the $A rally into 2020 i.e. we believe the weak local currency tailwind is coming to an end.
Australian 3-year bond yield & RBA Cash Rate Chart
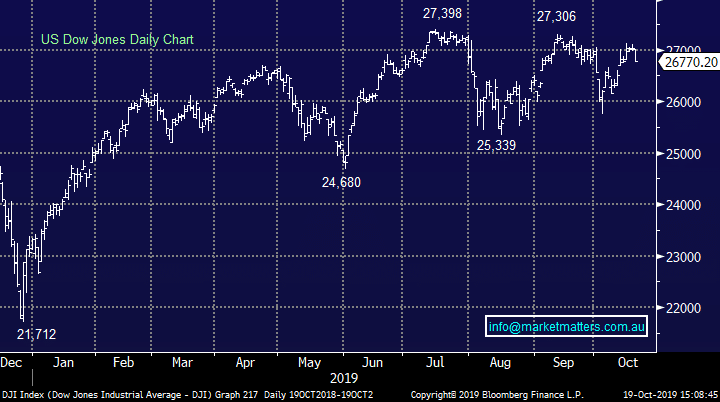
 US stocks continue to chop around in a very similar fashion to our own, the Dow closed on Friday at the same level it achieved back in June – sound familiar! Nothing more needs to be added to our comments after the ASX earlier:
MM remains neutral US equities.
US Dow Jones index Chart
US stocks continue to chop around in a very similar fashion to our own, the Dow closed on Friday at the same level it achieved back in June – sound familiar! Nothing more needs to be added to our comments after the ASX earlier:
MM remains neutral US equities.
US Dow Jones index Chart