Subscribers questions (NST, MSFT, SPT, Z1P, RMD, KDR, CAT)
Sydney turned on the weather again yesterday –another cracking Sunday ahead of what’s going to be a very busy month on the reporting front. We’ve seen a few small insights last week and the volatility at a stock level is likely to be very high over the next month. Throw in the Hayne Royal Commission being released after the market today, it’s certainly a time to be on ones toes!
The weekend was fairly quiet on the news front with property still struggling on both the price and turnover front but with kids only back at school for a week it feels premature to me to call it “game over” – everyone’s read the press hence almost nobody will be paying up like 18-monthss ago but just a sniff of stability will force many pundits to perform a pirouette very fast. Property is built on the availability of credit and banks have tightened the purse strings as they bunker down for the RC findings.
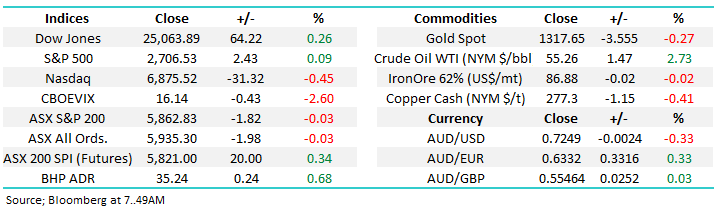
Following a quiet night on Wall Street the SPI futures are calling the ASX200 to open up around 20-points on Monday, helped by BHP which closed up +0.7% in US on Saturday morning. Considering the very market significant news being released after the market closes I anticipate a day of “book squaring / de-risking” which could take us anywhere on potentially light volume.
MM is now in “buy mode” due to our high cash levels but we intend to pull the trigger from lower levels
Thanks again for the great number of questions as we kick off February, please excuse the brevity at times otherwise I will still be typing when the market opens!
ASX200 Chart
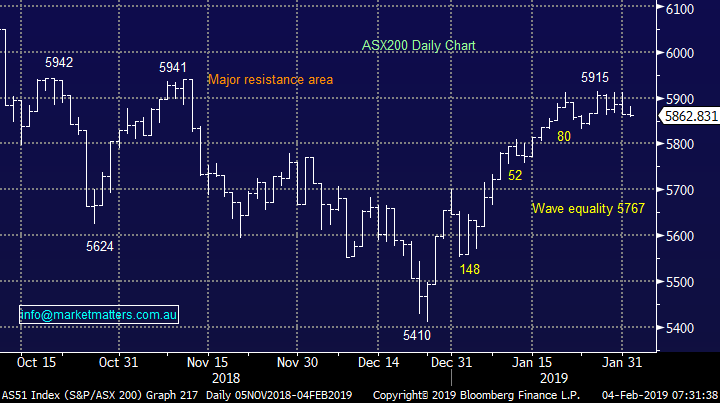
Economic growth is clearly slowing and we believe it will just be a matter of time before company profits dance the same tune hence we remain comfortable with our medium-term outlook for stocks – a choppy but fun time if we are correct.
Very importantly stock valuations are now back above their long-term average following the almost straight line 9.3% rally from late Decembers panic low hence MM has become more defensive taking profit on our main growth plays while in the process taking our cash position to relatively elevated levels – 33% for the Growth Portfolio and 24.5% in the Income Portfolio.
The combination of reporting season and extended market is likely (we hope) to provide some good buying opportunities in February & March.
ASX200 Chart
Question 1
“G'day James and Co. Interesting to note your take on NST @ $7.00 odd. Since the possibility of Company Franking/Buyback 'splurges' - for want of a better term - going forward and assuming they're suitably Hedged against your 80c AUD opinion, is there an additional sweetener among their Credits?” – Michael B.
Hi Michael,
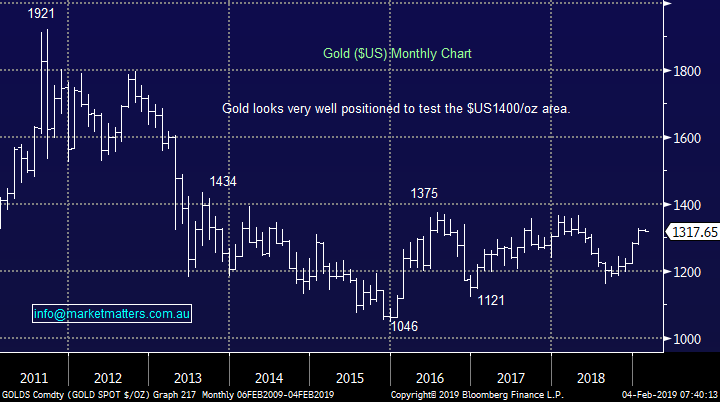
The main “sweetener” here is the actually underlying gold price which we can see testing $US1375 in the weeks / months ahead i.e. 4-5% higher.
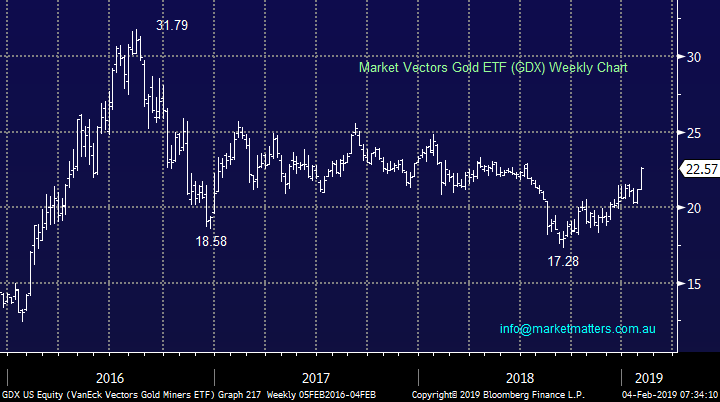
The market vectors gold ETF shown below is actually targeting at least 10% upside with fairly good risk / reward.
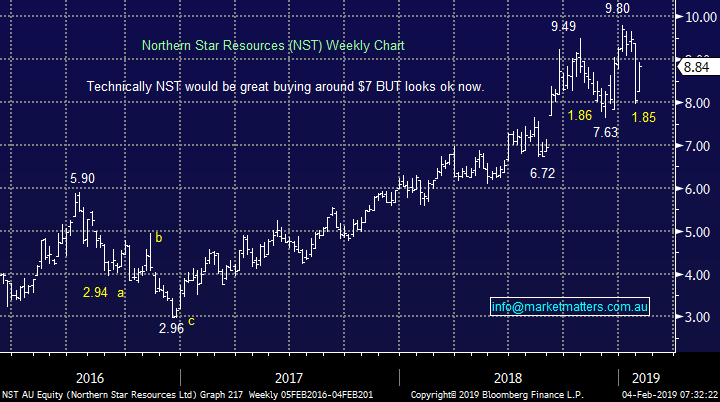
Hence MM is looking to gain gold exposure, but NST may not be the best option at this stage. At their recent quarterly costs were up as they made an interesting decision of leaving high grade gold in the ground and mining stuff outside their resource base. I think this makes total sense when the gold price is A$1,800 (at/near all-time high), the problem in the short term though is that margins were lower and therefore earnings expectations have come down. This clear change to value over volume I think will see the stock underperform peers given a lot of ‘growth managers’ that hold this, are simply focussed on earnings growth this year, and the move by NST reduces that in the short term.
Essentially, it’s a good longer term move from NST but the short term becomes more clouded. We were hoping for follow through selling towards $7 where the risk / reward would have been very attractive.
Northern Star Resources (ASX: NST) Chart
Gold ($US) Chart
Market Vectors Gold ETF (GDX) Chart
Question 2
“Hi, Thanks for the report. Could you advise how one purchases American stocks without going through a broking house” - Mike D.”
Hi Mike,
You need a broker to buy stock on an exchange, including international exchanges. Most of the low cost online platforms now do it, however be careful how the stock will actually be held. Alternatively my team and I at Shaw and Partners can purchase international stocks and where happy to assist if you would like to understand more of nuances of overseas investing i.e. email [email protected]
Question 3
“HI, a week ago you mentioned Microsoft as a buy “a few % lower”. It has reached that point. Do you still advise as a buy?” - Regards, Scott D.
Hi Scott,
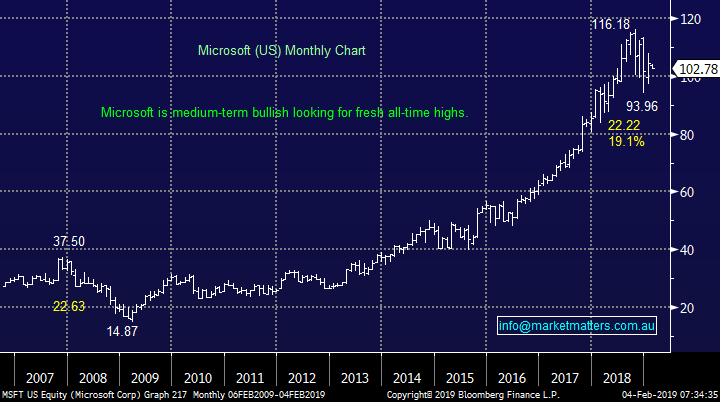
Simply, yes we do like MSFT at current levels and are targeting fresh all-time highs this year.
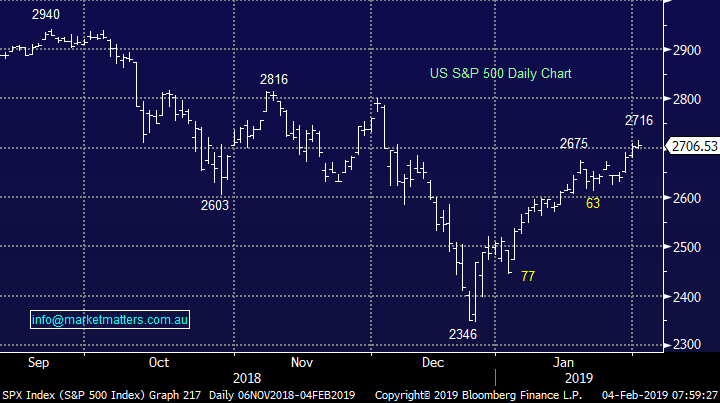
However we are anticipating at least a 4-5% pullback for US indices hence we would be accumulators between $US98 and $US103.
Microsoft (MSFT US) Chart
US S&P500 Index Chart
Question 4
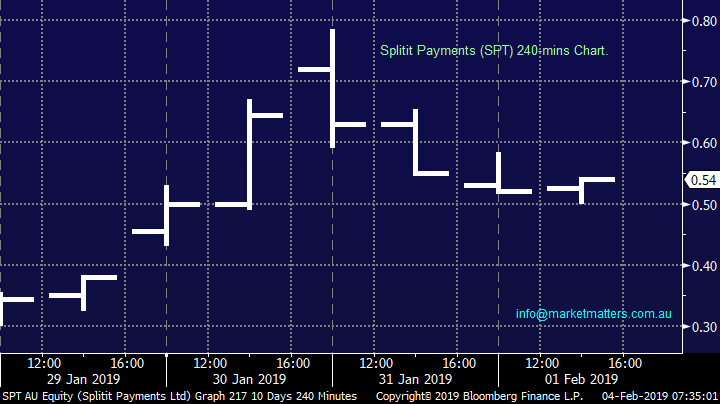
“Hi James and Team M&M, A new IPO has launched called Splitit (SPT) which they claim will give Afterpay a run for its money. It’s an Israeli-based instalment payment solutions company, with offices in London and New York, its IPO price was $0.20 and began trading at $0.355 soon after its late-morning listing. Last price was $0.67c and a market capitalization of $111 million. Can you give an evaluation of whether it’s worth putting some money on this one. Thanks, love your work.” – Tony.
Hi Tony,
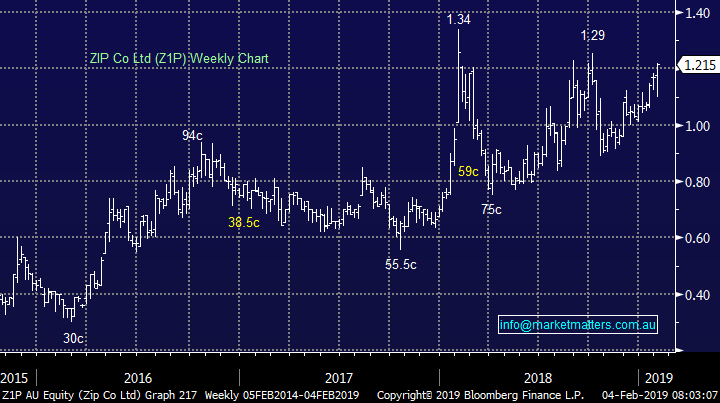
Following the success of Afterpay Touch (APT) I imagine we will see a number of likeminded business hit the boards, we already have ZIP Co. fighting for market share and they have created a $383m business by market capitalisation compared to Afterpay at $3.8bn.
Investors should be aware this is likely to remain a very volatile space - even APT has experiencing a 55% correction last year.
Here’s an interesting article that looks at the company
We are more comfortable watching SPT at this stage because they are late to the party and hence will need to be much better to make a meaningful impact over time. The Byron Bay company already has a market cap. of $142m which feels rich to me at this stage of their evolution!
Splitit Payments (ASX: SPT) Chart
Z1P (ASX: Z1P) Chart
Question 5
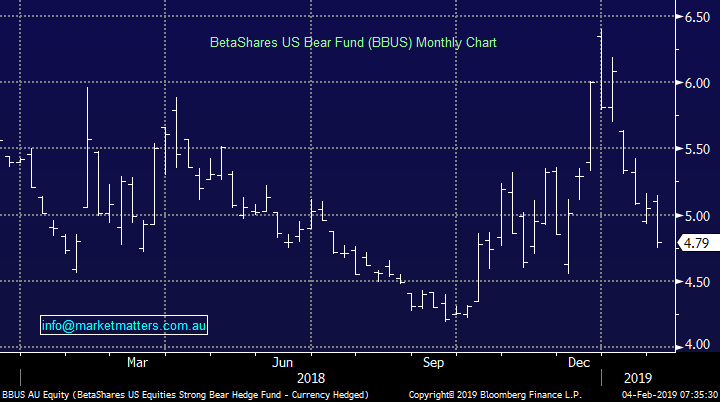
“After the recent bull run of the US market, BBUS is getting back below where we last sold out. With the market now potentially getting near the top of the current run, at what price will you start finding the bear ETFs: BBUS, BEAR & BBOZ attractive again?” – Charlie N.
Hi Charlie,
As you say we sold out of our BBUS position back in late October unfortunately missing out on some unexpected fun in December but with the BBUS now making multi-month lows it has been on our radar.
The answer to you question depends on how active / aggressive you are as we believe US stocks are poised for a 4-5% correction but will probably trade higher in the mid-year courtesy of the Feds fresh asset friendly stance. Hence:
1 – We are bullish the BBUS today looking for ~15% rally / bounce.
2 – Longer term we believe there will be a better time to buy the BBUS later in the year.
NB The BBUS is a leveraged bearish ETF which goes up when US stocks fall.
BetaShares US Bear Fund ETF (BBUS) Chart
Question 6
“Hi James, thanks for your much appreciated wide coverage of stocks ‘on the move’ which if anything is even wider than ever in the new year. I note that by the time (6pm or so) we receive the analyst new price targets for the day, the market has had a whole day (or at least much of a day) to move the stocks up (or down) in accordance with analyst new assessments. Is there any way to get the analyst new assessments at the same time I assume you are getting them (i.e.: early in the day) so we get a chance to buy or sell while the market’s still open and before the price has run well away from where it closed on the previous day? Also (sorry to run on), given that there’s a lot of variance between analyst assessments, is there some that are more ‘preferred’, or generally have a better record with their PTs, than others?” - Regards, Gil.
Hi Gil,
We certainly take analysts changes into our thinking and we do review them daily, however not sure we want to include them in the AM report. The reason being, we’ve always tried to simply present our view of the markets after we’ve distilled down the available information rather than just offload all the information in a report without having a clear view, which is generally what the majority of Newsletters do. We are in the process of redeveloping the MM online offering and within that, we’re looking at live ‘blog style’ updates throughout the day on the website – things catching our eye in real time can be posted and viewed by subscribers – I would expect analyst changes would be a part of this. We’ll keep you posted.
In terms of analysts track records, they get ranked and we see the rankings of each analyst on each stock. We tend to know who to follow and who to avoid.
Question 7
“Hi Team, my question is about what % stop loss you use as you seem to let the losses run while attempting a lot of bottom fishing stocks while I only buy Rising stocks in a rising market which works well for me. I hope you have the time to reply” – Regards Richard S.
Hi Richard,
Please excuse the shortening of your question but I believe I have included / answered the most important points.
1 – We have covered stops a few times this year. When MM analysed our performance in 2018 only a couple of positions stopped us having a cracking year, although it was still good. Like all good businesses at MM we intend to continually evolve and improve.
As discussed we intend to be more ruthless moving forward with our stops / cutting losses to ensure the likes of Janus Henderson (JHG) don’t drag on our returns.
However stops will not be set at a fixed percentage, they will be set / triggered when the reason the position was initiated has clearly failed.
We are not 100% technical investors nor are we 100% fundamentally focussed, we combine valuation metrics with technical indicators while having a clear view / understanding of what the macro environment is telling us. Setting an arbitrary % based stop, or one based on volatility using ATR’s for example does not fit that approach.
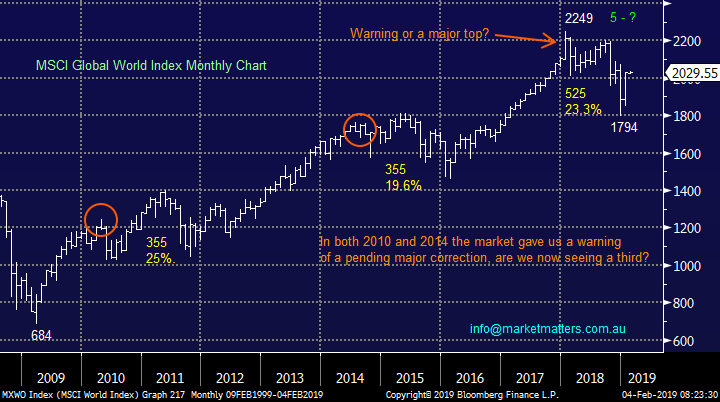
2 – Historically you are certainly correct buying rising stocks, ideally in a rising market, is statistically the best way to invest but global stock markets have been rallying now for over 10-years and our belief at MM is we are in for a few choppy years for stocks i.e. we probably wont have to wait that long for another decent correction. Our view remains that the longest bull market in history is now very mature and investors should be prepared to buy weakness and sell strength - I feel that buying breakouts and using a trend following stop loss system for instance will be a very hard strategy to make money from in the next year or so as the markets chop around
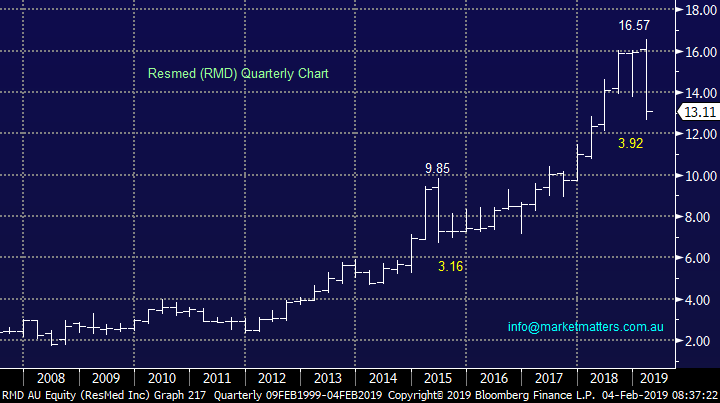
3 – We are prepared to buy falling stocks but only when we like the business and have previously identified a level where we felt the risk / reward justified accumulating the stock e.g. ResMed last week around $13. There are plenty of declining stocks / sectors we have successfully avoided over recent years including building and retail.
MSCI Global World Index Chart
ResMed (ASX: RMD) Chart
Question 8
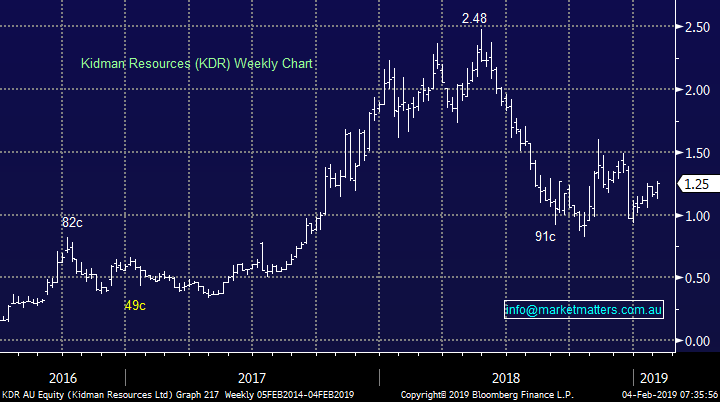
“Hi MM Team KDR reached $1.27 on Friday- closing at $ 1.25 up 11.11%. I could not find any announcement/news to explain this rally on Friday. Would you know why? -If so is this an opportunity to sell or hold for further upside?” – Debbi.
Hi Debbie,
KDR and the lithium sector is a very volatile space that regularly experiences +30% swings. Perhaps in contrary to the above response, I do think stops are worth using in more of a trading area such as the Lithium space.
Technically looks good following last week’s rally with stops now below $1.17 and let the upside play out.
FYI – we covered PLS in the weekend report which also looks good technically
Kidman Resources (ASX: KDR) Chart
Question 9
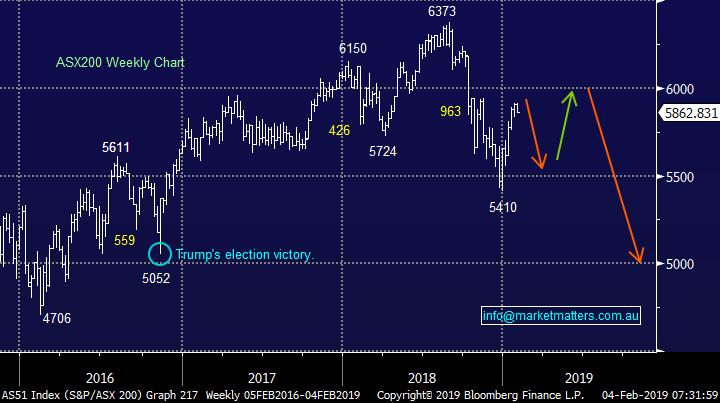
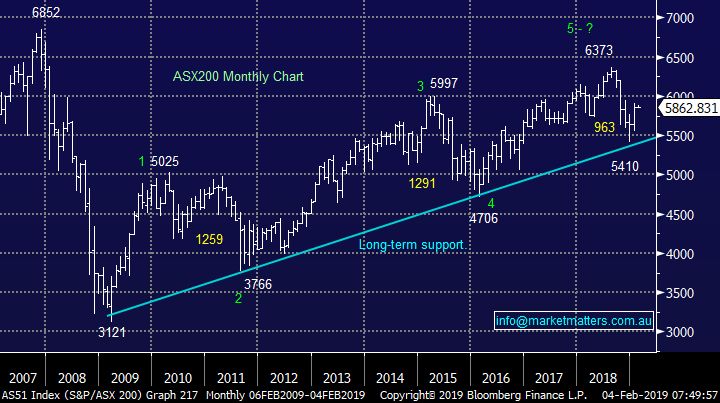
“HI James, I am a little puzzled by the statement “Our earlier call that the ASX200 was set to correct its entire 963-point / 15% decline has proved correct”. So far the ASX200 is only about half way back to the peak it reached at the end of August. Do you mean that you think it will continue on its current trajectory until back to the 6350 level?” – Thanks Rob M.
Hi Rob,
When we mean correct x-points whether it be up, or down, its important to understand a usual market correction is 50%, +/- ~10%, hence what I was saying was the market was set to recover at least 50% of the 963-point decline which it has.
An alternative may have been we were expecting the market to only correct its November / December drop from 5941 to 5410, i.e. 531-points. If this had been the case we would have been targeting a bounce to around ~5675 which is 50% of this particular decline.
I hope this makes sense and I will endeavour to add more detail with similar comments moving forward.
ASX200 Chart
Question 10
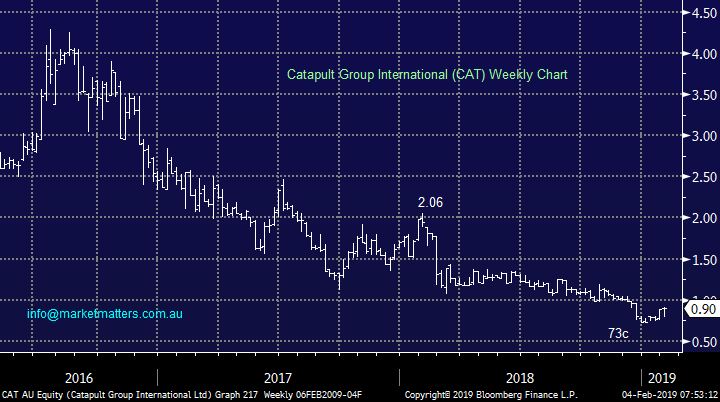
“MM Question on a stock that I have held in my portfolio since 2017 and has underperformed, however I believe has attractive long term potential. Interested in whether you agree on its potential and how attractive the current price is. CAT - Catapult Group International Global sports analytics company with decent exposure to US, UK, Australian sports key markets tied up, consumer line of wearable products. Trend of more analytics in sports and exercise and decent market share. Revenue was up 26% v PY however still making a loss. Expenses and salaries seem high.” – Craig L.
Hi Craig,
This has been a tough ride and certainly an example of where stops may have been extremely useful. This was one of Coppo’s best picks from memory!
At this stage the sports analytics business needs to convert revenue into profits – in Q1 of this financial year revenue rose 25% to almost $35m. They even have the likes of Real Madrid and the French FFA as customers implying an impressive product offering.
However the company is now estimating positive cash flow by 2021 putting it in the watch and see basket for me – sorry, not much help on this!
Here’s what the brokers are seeing on CAT – all with BIG price targets
Catapult Group (ASX: CAT) Chart
Overnight Market Matters Wrap
· A mixed session over in the US last Friday, as both the Dow and broader S&P 500 edged higher following better than expected jobs report and further positive signs of progress in trade talks between US and China. The tech. heavy, Nasdaq 100 however underperformed as investors were disappointed from Amazon’s sales forecast.
· As mentioned, the US economy added 304,000 jobs in January (despite the Federal government shutdown), but December employment numbers were revised sharply lower, while wage growth remained muted.
· The quarterly earnings reports continued to largely beat expectations with Chevron, Exxon and Merck rallying around 3% each after reporting better than expected numbers. The energy sector also boosted by a 2.73% rally in crude oil.
· Investors will be focussed on the final report of the Royal Commission into the Financial Service sector, which is due out after market today. This week also marks the beginning of the Australian interim reporting season, which will kick off on Wednesday when CBA releases its half yearly results.
· The March SPI Futures is indicating the ASX 200 to open 20 points higher towards the 5885 level this morning.
Have a great day!
James & the Market Matters Team
Disclosure
Market Matters may hold stocks mentioned in this report. Subscribers can view a full list of holdings on the website by clicking here. Positions are updated each Friday, or after the session when positions are traded.
Disclaimer
All figures contained from sources believed to be accurate. Market Matters does not make any representation of warranty as to the accuracy of the figures and disclaims any liability resulting from any inaccuracy. Prices as at 04/02/2019
Reports and other documents published on this website and email (‘Reports’) are authored by Market Matters and the reports represent the views of Market Matters. The MarketMatters Report is based on technical analysis of companies, commodities and the market in general. Technical analysis focuses on interpreting charts and other data to determine what the market sentiment about a particular financial product is, or will be. Unlike fundamental analysis, it does not involve a detailed review of the company’s financial position.
The Reports contain general, as opposed to personal, advice. That means they are prepared for multiple distributions without consideration of your investment objectives, financial situation and needs (‘Personal Circumstances’). Accordingly, any advice given is not a recommendation that a particular course of action is suitable for you and the advice is therefore not to be acted on as investment advice. You must assess whether or not any advice is appropriate for your Personal Circumstances before making any investment decisions. You can either make this assessment yourself, or if you require a personal recommendation, you can seek the assistance of a financial advisor. Market Matters or its author(s) accepts no responsibility for any losses or damages resulting from decisions made from or because of information within this publication. Investing and trading in financial products are always risky, so you should do your own research before buying or selling a financial product.
The Reports are published by Market Matters in good faith based on the facts known to it at the time of their preparation and do not purport to contain all relevant information with respect to the financial products to which they relate. Although the Reports are based on information obtained from sources believed to be reliable, Market Matters does not make any representation or warranty that they are accurate, complete or up to date and Market Matters accepts no obligation to correct or update the information or opinions in the Reports. Market Matters may publish content sourced from external content providers.
If you rely on a Report, you do so at your own risk. Past performance is not an indication of future performance. Any projections are estimates only and may not be realised in the future. Except to the extent that liability under any law cannot be excluded, Market Matters disclaims liability for all loss or damage arising as a result of any opinion, advice, recommendation, representation or information expressly or impliedly published in or in relation to this report notwithstanding any error or omission including negligence.


