ETF flows can provide useful early signals of broader market rotation. Historically, rotations between high-beta and low-beta strategies have helped flag changes in risk appetite, with stronger low-beta flows in mid-2022 preceding a sustained period of market weakness. More recently, rising inflows into equal-weight ETFs such as RSP signalled improving market breadth, a constructive lead indicator for the broader index. Sector-level flows can also highlight sentiment extremes, with sharp reversals in tech ETF flows suggesting moments of sector exhaustion.
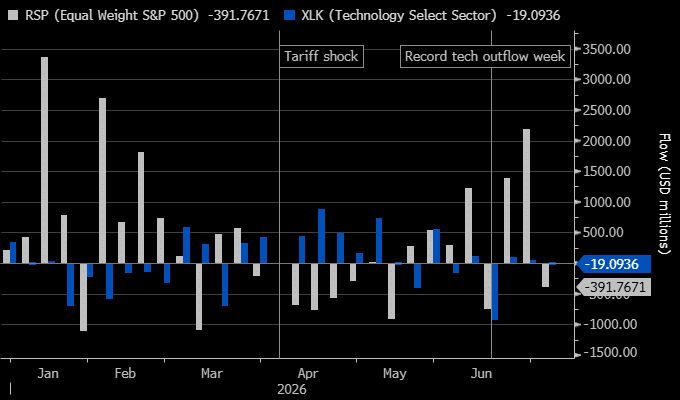
- The two ETFs shown below are largely uncorrelated, and at times inversely related, consistent with the rotation dynamic between concentrated mega-cap tech exposure (XLK) and broader market participation (RSP).
At MM, we’re always looking for leading indicators which may help us get ahead of the proverbial curve and fund flows across ETFs can often do this, as we can see below where fund flows into the RSP ETF started to trend higher in May, just before we saw a broadening of market strength.
- We watch fund flows for clues around future stock & sector rotation, and the below table is one on our radar.
chart

Invesco S&P 500 Equal-Weight ETF (RSP US) v State Street Technology Select ETF (XLK US) Weekly Fund Flows in 2026 – Source: Bloomberg
chart
Invesco S&P 500 Equal-Weight ETF (RSP US) v State Street Technology Select ETF (XLK US) Weekly Fund Flows in 2026 – Source: Bloomberg
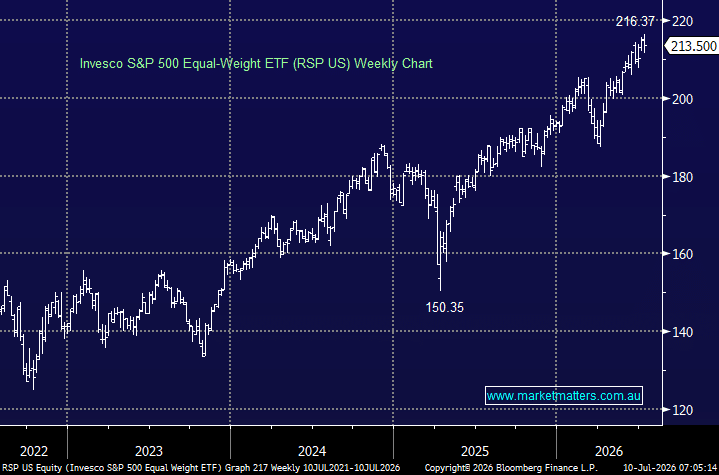
The RSP ETF has had a very high 0.94 correlation to the Dow Jones in 2026, not surprising looking at the respective charts, although ironic as the Dow is far from a broad-based index containing only 30 stocks. However, both the RSP and the Dow are designed to reduce mega-cap concentration. RSP equal-weights all 500 S&P constituents, while the Dow is market cap weighted across just 30 blue-chip stocks; both methodologies underweight the largest market-cap names (Apple, Nvidia, Microsoft) relative to the cap-weighted S&P 500.
- We like the RSP ETF into Christmas in line with our bullish outlook toward US stocks, but its recent outperformance feels likely to at least take a rest short term.
MM is bullish towards the RSP ETF around US$213.50
Add To Hit List
chart
Invesco S&P 500 Equal-Weight ETF (RSP US)
chart
Invesco S&P 500 Equal-Weight ETF (RSP US)