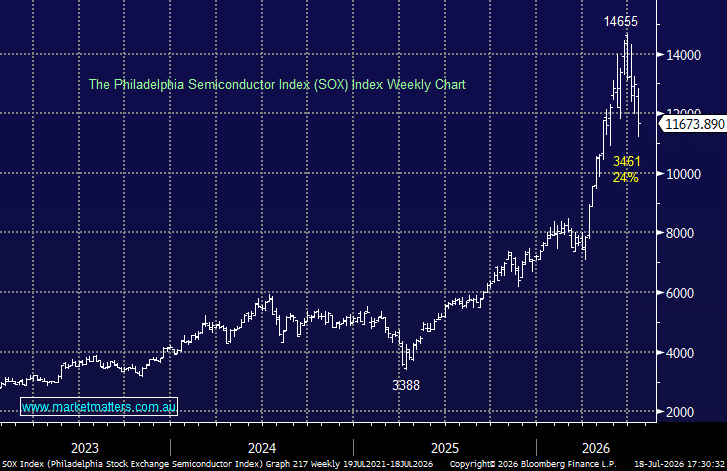
Remarkably, after surging higher over the last 18-months the SOX index has now entered a bear market – a great example of elastic bands stretching further than most people expect before snapping hard, in this case as we’ve touched on earlier a classic one-two from leverage and crowded positioning. However, we wouldn’t write off the sector in a hurry, these stocks make huge profits, there’s no smoke and mirrors here – The 30 constituents of SOX are collectively forecast to generate approximately US$410bn in net profit in 2026 making it one of the most profitable sectors in the world by absolute dollar earnings.
However, it all comes down to valuations: at 26.5x forward earnings, the SOX trades at a meaningful premium to the S&P 500 (~21x), reflecting the market’s expectation of sustained above-market earnings growth driven by AI infrastructure buildout. Fears of a slowdown in this “AI Buildout Trade” are likely to see further valuation contraction, and vice versa.
- We can see the SOX index bouncing at least 10% from current levels before fully showing its hand.