The march higher by stocks has left investors extremely comfortable toward stocks, the question is, are they too comfortable? There are a number of technical indicators which can be used to evaluate whether stocks are getting “too frothy” from the Fear & Greed index, which is currently sitting in the “Greed” section as opposed to “Extreme Greed” to the VIX or the fund managers positioning, all helpful in our opinion but there is one important factor often missed by traders, i.e. markets can sit in extreme bullish territory for months, or even years.
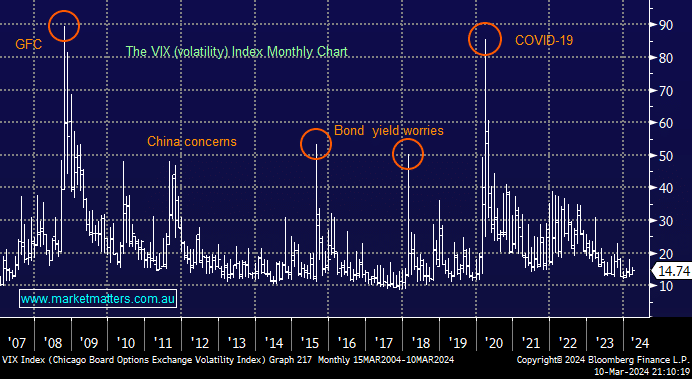
- The volatility index often spends long periods of time in “complacent” territory, but the risk/reward now favours the buyers of volatility.
- From a stock perspective, we regard the market as one to “buy the dips” while being cautious when chasing strength.
MM anticipates another test above the 20 level by the VIX in 2024
Add To Hit List