Market Matters Weekend Report Sunday 11th December 2016
Market Matters Weekend Report Sunday 11th December 2016
Overview
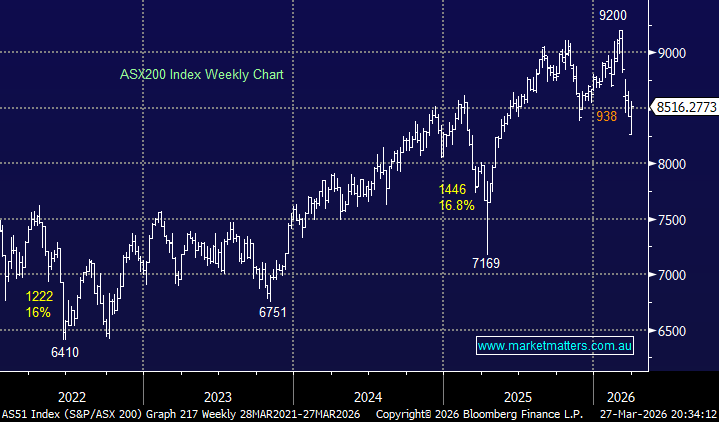
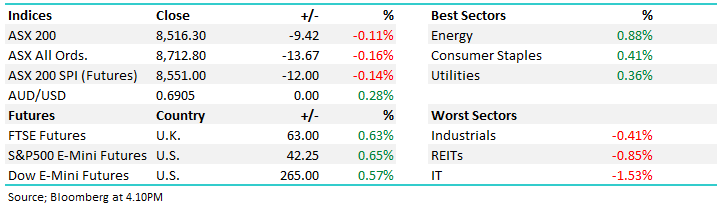
Last week the ASX200 continued with its strong advance since the Trump election victory, gaining another 2.2% led by the banks, resources and insurance stocks. The local market has now gained over 500-points since Donald Trump won Florida on the 9th of November and as we enter the seasonally strongest few weeks for stocks a break to fresh highs for 2016, over 5611, feels inevitable over the coming few days. The current rally is what we have been forecasting for global equities all year and it’s now a question of keeping our finger on the pulse to identify the optimum time to lock in some profits. We believe the important and simple points to watch moving forward are below:
- The ASX200 has only traded in a 183-point range so far for December. However the average monthly range for 2016 is 304-points and last December it was 416-points. Hence statistically the ASX200 looks likely to test 5700 before we welcome in 2017.
- If we consider the simple daily chart pattern of the ASX200 it looks positioned to either explode towards 5700+ in a “3 of 3” style advance or it will fail early next week which will be confirmed by a break back under 5500.
- As mentioned seasonally the second half of December is the strongest time of the year.
Hence overall we remain bullish the AX200 targeting ~5700 this month – a break back under 5500 is currently required to alter this outlook.
ASX200 Daily Chart

As global equities rally we are now asking ourselves how far will the “Trump effect” take stocks before our forecasted end to this 8-year bull market is reached. Technically the S&P500, like most US indices, now appears to be rallying in a clear “3 of 3” explosive style advance – we hope this unfolds as it will make identifying the ultimate top a lot easier. When we look at some major global indices you can see that MM is still expecting some decent gains from equities before its time to get off the train:
- US Russell 2000 +5%.
- US Russell 3000 +8-11%.
- US NYSE Composite +8%.
- German DAX +15%.
- Hang Seng +10%.
- Japans Nikkei +15%.
These numbers imply there remains plenty of fuel in the equities tank short-term but we remain as committed to our 25% pullback call in 2017/8 as we have been to our bullish call for global equities since the US S&P500 formed a major low back in February. It should be remembered that the final phases of this advance are likely to be with much less momentum than stocks are currently enjoying.
US S&P500 Weekly Chart

Russell 2000 Index Quarterly Chart

The local market and its relatively limited number of stocks has unfortunately proven to be far harder to forecast than our global counterparts but we remain comfortable with our short-term bullish outlook for the ASX200, and importantly, our expectation that it will fall substantially if US stocks correct 25%. One stock that we will use as a technical indicator / barometer for the ASX200 is Queensland bank / insurer Suncorp (SUN) which tracks the overall local market pretty well and importantly has an excellent / clear technical picture at present. Last week’s strong 4.8% advance feels like the start of the strong move we have been targeting for some time.
We are bullish SUN targeting fresh post GFC highs between $15.50 an d $16 i.e. 15% higher. Hence if this SUN view is correct we can easily envisage the ASX200 challenging 6000 before topping out.
Suncorp (SUN) Monthly Chart

The AFR ran a very interesting piece last week pointing out the Shiller Index was flashing sell signals as it rallied to be over 27 for only the third time in history, the 3 previous times were followed by significant market falls – the 1929 crash, the Dot-Com bubble bursting and the GFC. We unfortunately believe this will end up being a fourth time but as we saw prior to the GFC the index can stay over 27 for many months before equities roll over. However the point remains that overall this adds weight to our opinion that stocks are slowly moving into a major top.
NB The CAPE Shiller Index is a valuation measure usually applied to the S&P500. It’s simply the price divided by the average of 10 years earnings (moving average) adjusted for inflation.
The Cape Shiller PE for the S&P500 Quarterly Chart

“Value investors” have endured another awful week with Sirtex Medical (SRX) getting walloped 41% on Friday. The liver cancer treatment company angered many investors by announcing a huge downgrade only a few weeks after a positive investor update – again you have to ask the question, what were the directors thinking! This is simply yet another example of a popular stock trading on an elevated P/E not delivering and then receiving the wrath of investors in the form of a rapid and savage rerating.
Sirtex Medical (SRX) Weekly Chart

Standout technical chart (s) of the week
The local market is dominated by the financial / banking stocks and today we looked at the global banking index which feels easily capable of rallying 10% after trading in a tight range since mid-2009. US banks have exploded up since Donald Trump’s victory and it feels likely that their global friends are likely to also enjoy some of this buying. This bullish picture ties in with our positive view that SUN is set to rally ~15%.
The FTSE Global Banking Index Quarterly Chart

Summary
- Our view remains that US and local stocks will rally over the coming weeks prior to a decline in the first quarter of 2017. We intend to significantly increase our cash holdings towards the end of this month.
- Our favorite sectors locally into 2017 are the Financials (including banks), $US earners and Healthcare which still has not yet listened to us.
What Matters this week
The ASX200’s is set to open up 20-points on Monday, short-term we can see consolidation around the 5600 area, ideally with a 30-point pullback for a good risk / reward buying opportunity for the traders.
Potential Investing opportunities for the coming week(s)
We are only holding 11% in cash and are wearing our sellers hat, plus we also have bought Vita Group (VTG) as a more speculative position.
Potential Trading opportunities for the coming week
On the index front we still especially like the Hang Seng, German DAX and Japan’s Nikkei over coming weeks.
For the index traders we think the market will again rally into the New Year but be patient looking for a 30-40 point pullback.
* Watch out for trading alerts*
Portfolio / Trade Holdings
The Market Matters Portfolio as of the 9th December is below:
https://www.marketmatters.com.au/blog/post/market-matters-portfolio-9th-december-2016/
We are currently holding 11% in cash plus a short-term holding in Vita Group (VTG).
Australian ASX200
The ASX200 rallied ~2.2% last week and a break above the year’s high of 5611 feels inevitable.
Chart 1 – ASX200 Monthly Chart

Chart 2 – ASX200 Weekly Chart

Chart 3 – ASX200 Daily Chart

Chart 3a – December Share Price Index SPI) 60-mins Chart

Chart 4 ASX200 Banking Index Monthly Chart

Chart 5 US S&P500 Banking Index Monthly Chart

Chart 5b FTSE Global Banking Index Quarterly Chart
Chart 6 Volatility (VIX) Index Weekly Chart

Interest Rates
Short-term interest rates in the US have moved sharply higher since the Trump win, beware we believe this move higher for interest rates has only just commenced. However short-term we can see some consolidation at current levels e.g. Australian 3-year bonds have reached the psychological and technical 2% support area i.e. 98.00 bond price.
Chart 7a – Australian 3-year bonds Weekly Chart

Chart 7b – The US 10-year Interest Rate Monthly Chart

Chart 7c – The US 2-year Interest Rate Monthly Chart

American Equities
As we all know the US stocks have surged over 10% since Donald Trump’s victory with the Dow, Russell 2000 & Russell 3000 making fresh all-time highs. Eventually we expect all US indices to play catch and achieve fresh highs, once this has occurred we will become more cautious stocks, our best “guess” at present is ~10% higher. Seasonally US indices should rally into 2017 – very similar to the local ASX200.
Chart 8 – Dow Jones Index Monthly Chart

Chart 9 – Russell 3000 Quarterly Chart

Chart 10a – US S&P500 Index Monthly Chart

Chart 10b – US S&P500 Index Weekly Chart

Chart 10c – US S&P500 Healthcare Index Quarterly Chart

Chart 11 – NYSE Composite Index Monthly Chart

Chart 12 – Russell 2000 Index Monthly Chart

Chart 13 – US NASDAQ Index Monthly Chart

Chart 14 – The Canadian Composite Index Monthly Chart

European Indices
European indices broke out to the upside last week and now look bullish e.g. the DAX is targeting ~13,000 / 16% higher while it holds over 10,800.
Chart 15 – Euro Stoxx 50 Index Monthly Chart

Chart 16 – UK FTSE Index Weekly Chart

Chart 17 – Spanish IBEX Index Monthly Chart

Chart 18 – German DAX Index Monthly Chart

Asian & Emerging Markets Indices
The Hang Seng index remains very strong looking poised to rally 8-10% while the Nikkei closing over 17,500 is also very bullish targeting ~22,000 i.e. 15% higher after last week’s strong performance.
Chart 19 – Hang Seng Weekly Chart

Chart 20 – China Shanghai Composite Index Weekly Chart

Chart 21a – Emerging Markets MSCI ETF Weekly Chart

Chart 22 – Japanese Nikkei 225 Index Monthly Chart

Australian Stocks
The Australian stock market extended recent gains last week, seasonally we should see another few weeks of strength into 2017.
Chart 23 – BHP Billiton ADR ($US) Monthly Chart

Chart 24 – BHP Billiton (BHP) Weekly Chart

Chart 25a – Woodside Petroleum (WPL) Monthly Chart

Chart 25b – Origin Energy (ORG) Weekly Chart

Chart 25c – Oil Search (OSH) Weekly Chart

Chart 26 – RIO Tinto Ltd (RIO) Weekly Chart

Chart 27 – Fortescue Metals (FMG) Monthly Chart

Chart 27b – Independence Group (IGO) Weekly Chart

Chart 28 – Newcrest Mining (NCM) Monthly Chart

Chart 29 – Regis Resources (RRL) Weekly Chart

Chart 30 – Barrick Gold (US) Monthly Chart

Chart 31 – Market Vectors Gold ETF Monthly Chart

Chart 32a – Commonwealth Bank (CBA) Quarterly Chart

Chart 32b – Commonwealth Bank (CBA) Daily Chart

Chart 33 – ANZ Bank (ANZ) Weekly Chart

Chart 34 – Westpac Bank (WBC) Daily Chart

Chart 35 – National Australia Bank (NAB) Weekly Chart

Chart 36 – Macquarie Group (MQG) Monthly Chart

Chart 37a – Bank of Queensland (BOQ) Monthly Chart

Chart 37b – Bendigo & Adelaide Bank (BEN) Monthly Chart

Chart 38a – AMP Ltd (AMP) Monthly Chart

Chart 38b – Henderson Group (HGG) Weekly Chart

Chart 39a – Sydney Airports (SYD) Monthly Chart

Chart 39b – Transurban Group (TCL) Monthly Chart

Chart 39c – Mantra Group (MTR) Daily Chart

Chart 40 – Suncorp Group (SUN) Monthly Chart

Chart 41 – Insurance Australia (IAG) Monthly Chart

Chart 42 – QBE Insurance (QBE) Monthly Chart

Chart 43 – Wesfarmers Ltd (WES) Weekly Chart

Chart 44 – Woolworths Ltd (WOW) Weekly Chart

Chart 45a – Seek Ltd (SEK) Monthly Chart

Chart 45b – REA Group (REA) Monthly Chart

Chart 45c – iSentia Group (ISD) Daily Chart

Chart 46 – Telstra Corp. (TLS) Monthly Chart

Chart 47 – Vocus Communications (VOC) Weekly Chart

Chart 48 – TPG Telecom (TPM) Weekly Chart

Chart 49 – Westfield Corp. (WFD) Monthly Chart

Chart 50– CSL Ltd (CSL) Monthly Chart

Chart 51 Ramsay Healthcare (RHC) Monthly Chart

Chart 52– Healthscope (HSO) Weekly Chart

Chart 53 – Ansell (ANN) Monthly Chart

Chart 53 – Sirtex (SRX) Weekly Chart

Chart 54 – Amcor Ltd (AMC) Monthly Chart

Chart 55a – Crown Resorts (CWN) Monthly Chart

Chart 55b – Star Entertainment (SGR) Weekly Chart

Chart 56– Bellamys (BAL) Weekly Chart

Chart 56b– Blackmore’s (BKL) Monthly Chart

Chart 57– JB Hi-Fi (JBH) Monthly Chart

Chart 58– Harvey Norman (HVN) Monthly Chart

The $A is trickly at present, we are comfortable with our eventual target of the ~65c region, short-term we were 50-50 around ongoing strength towards the 81c area but the Trump victory / $US strength has turned our bias towards a lower $A now.
The $US is looking very strong after Donald Trump’s victory as the market adjusts for higher US rates. We are targeting ~105 minimum but surprises are likely to be on the upside short-term.
Chart 59a– Australian Dollar (AUD) Monthly Chart

Chart 59b– The $US Index Quarterly Chart

Commodities
- Large cracks have appeared in gold recently as its fallen hard in anticipation of rising interest rates in the US, our initial target was the $US1200/oz support area which has now been broken. We still think it’s best to be an observer for now.
- Copper remains in a negative downtrend, even after the last few weeks fireworks, on a longer-term basis we are targeting the 150 area.
- Our target for Crude Oil of +$US60/barrel looks a strong possibility after the OPEC decision, it still needs to decisively punch through $US52/barrel to look good.
- Iron Ore achieved our initial +$US70/tonne target, technically we now remain neutral / negative after the “abc” target of ~$US80/tonne was achieved this month.
Chart 60 – Gold Monthly Chart

Chart 61 – Copper Monthly Chart

Chart 62 – Crude Oil Monthly Chart

Chart 63 – Iron Ore Monthly Chart

All figures contained from sources believed to be accurate. Market Matters does not make any representation of warranty as to the accuracy of the figures and disclaims any liability resulting from any inaccuracy. Prices as at 11/12/2016. 8.00AM.
Reports and other documents published on this website and email (‘Reports’) are authored by Market Matters and the reports represent the views of Market Matters. The MarketMatters Report is based on technical analysis of companies, commodities and the market in general. Technical analysis focuses on interpreting charts and other data to determine what the market sentiment about a particular financial product is, or will be. Unlike fundamental analysis, it does not involve a detailed review of the company’s financial position.
The Reports contain general, as opposed to personal, advice. That means they are prepared for multiple distributions without consideration of your investment objectives, financial situation and needs (‘Personal Circumstances’). Accordingly, any advice given is not a recommendation that a particular course of action is suitable for you and the advice is therefore not to be acted on as investment advice. You must assess whether or not any advice is appropriate for your Personal Circumstances before making any investment decisions. You can either make this assessment yourself, or if you require a personal recommendation, you can seek the assistance of a financial advisor. Market Matters or its author(s) accepts no responsibility for any losses or damages resulting from decisions made from or because of information within this publication. Investing and trading in financial products are always risky, so you should do your own research before buying or selling a financial product.
The Reports are published by Market Matters in good faith based on the facts known to it at the time of their preparation and do not purport to contain all relevant information with respect to the financial products to which they relate. Although the Reports are based on information obtained from sources believed to be reliable, Market Matters does not make any representation or warranty that they are accurate, complete or up to date and Market Matters accepts no obligation to correct or update the information or opinions in the Reports.
If you rely on a Report, you do so at your own risk. Any projections are estimates only and may not be realised in the future. Except to the extent that liability under any law cannot be excluded, Market Matters disclaims liability for all loss or damage arising as a result of any opinion, advice, recommendation, representation or information expressly or impliedly published in or in relation to this report notwithstanding any error or omission including negligence.