Is Trump going keep pushing the emerging markets off the cliff? (BHP, ALL, CIM)
The ASX200 was smacked over 1% yesterday, taking the decline since last Thursday’s intra-day high to -2.2% - already more than the average loss during September over the last decade! The selling was predominantly emerging markets (EM) focused, as we saw weakness from the EM currencies spread into equities. The resources sector understandably led the declines with BHP Billiton (BHP) -2.7%, Fortescue Metals (FMG) -3% and OZ Minerals (OZL) -2.6%.
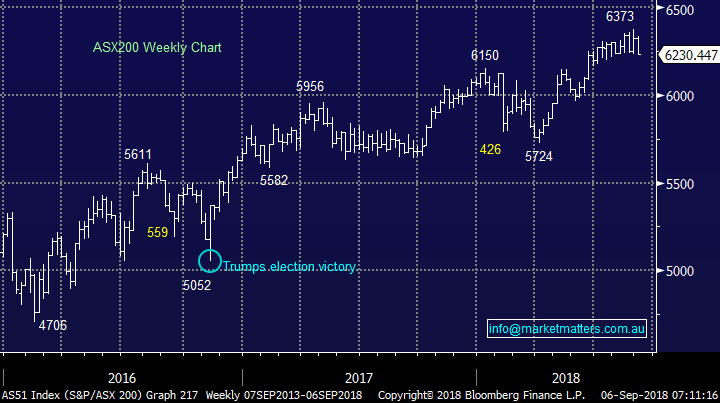
We said only on Tuesday that we felt the ASX200 was headed back towards 6200, its actually got there faster than we expected.
“The ASX200 has been a “choppy mess” since late June and on balance, we again feel the local market is headed lower to retest the 6200-support area – the S&P500 has rallied over 3% from July but we’ve failed to make any positive headway, never a good sign.”
Since late June every time the markets pulled back to this region, it’s bounced strongly and now after 11-weeks of trading in the range of 6200 to 6350, we again ponder if this time will be different? Our ideal technical picture targets an initial pullback towards 5750-5800 - another 7% lower, for this to unfold I would imagine that recent rock, called the US stock market, would have to at least partially crack – remember the Australian market experienced corrections of this magnitude in both 2016 & 2017, why not 2018?
· MM is now neutral / negative the ASX200 and remain in “sell mode”.
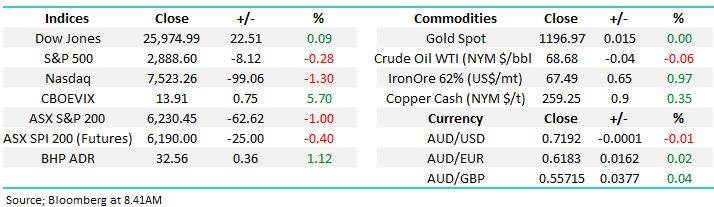
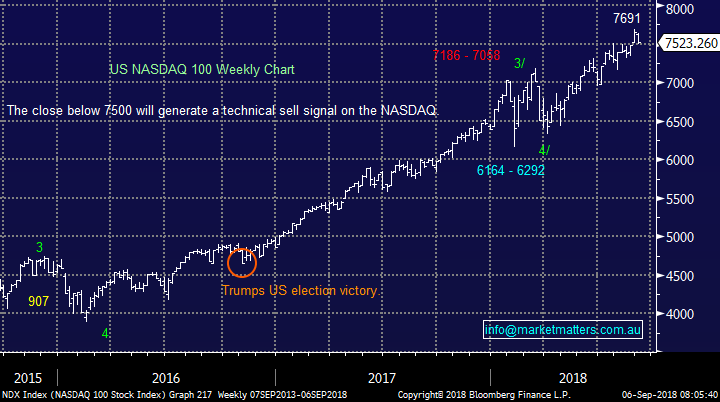
Overnight stocks were again weak led by European indices which fell ~1.3%, US stocks again recovered late in their session, but the tech based NASDAQ still closed down -1.3% while the Dow was interestingly up +0.1% – perhaps the unfold of the high valuation / growth stocks which MM has been looking for has commenced.
· The SPI futures are calling the ASX200 to fall another 20-points to test the psychological 6200 area. BHP was actually up 1% in the US, implying the resources may get a respite this morning.
Today’s report is going to briefly explain what’s causing the current stock market weakness and importantly look at opportunities it may create for MM.
ASX200 Chart
Australian Dollar $A
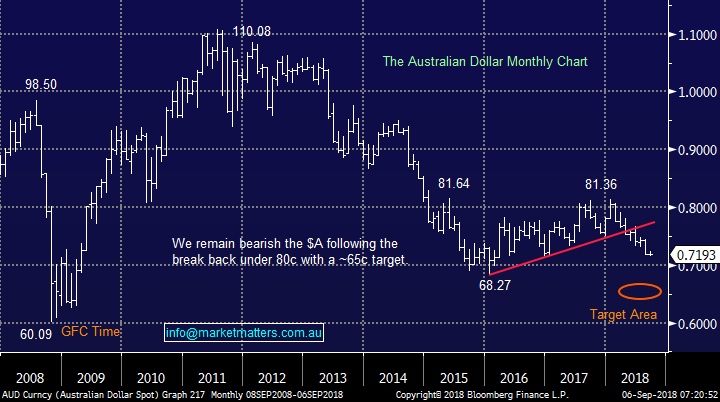
Australian Growth data (GDP) was released yesterday and it’s showed the Australian economy is booming – it seems as we suspected the RBA did have a “sniff” of what came next.
However, household debt still remains an increasing issue with the short-term spike in the $A becoming relatively short lived and just a few hours later the $A was again making fresh multi-month lows.
· MM remains bearish and short the $A (via BetaShares ETF) targeting ~US65c.
Australian Dollar $A Chart
Weakness in equities courtesy of emerging markets
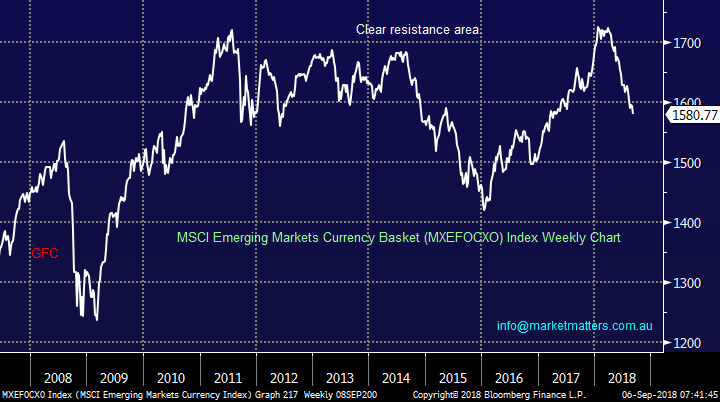
Donald Trump is fighting trade wars on a number of fronts with Canada and China dominating the newswires. This has slowly but surely causing an increased flight to the $US, which was already strong because the US economic engine is firing on all cylinders – the ideal time to pick a fight. The $US Index has already risen 10% from its 2018 lows in February, a move economists / traders were not expecting at the start of 2018.
The emerging markets are suffering badly because they hold debt largely dominated in $US hence its rapidly costing more to both service and repay the burden.
The word contagion has been raised regularly since Turkey wories led to many in FX land hit the panic button – the Turkish Lira is already down 40% this year!
· Contagion – “the situation in which feelings, ideas, or problems spread from one place to another e.g. Brazils stock markets were battered by contagion from the problems in other EM” – the Cambridge English dictionary.
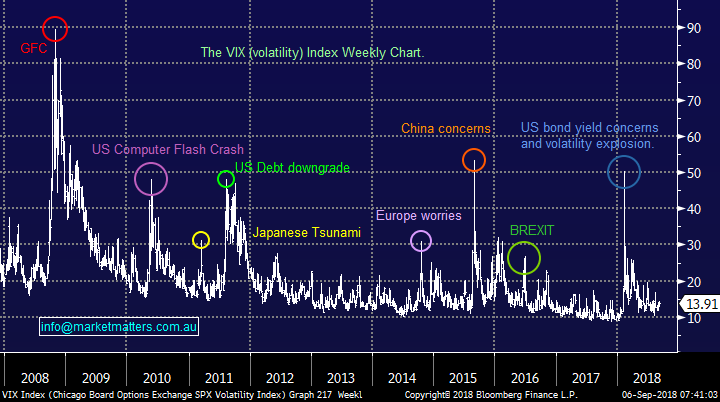
Markets are concerned that if the $US keeps rallying EM countries will default on their debt resulting in financial panic. History shows us that contagion was very evident during the Asian crisis that began in the summer of 1997 which was also currency led, during this period international stocks fell by as much as 60% with the ASX200 falling -16.8% in just October 1997 i.e. this is clearly a concern for equities and the almost 6% increase in the “Fear Index” (VIX) last night highlights that traders are paying attention.
· Global debt is now almost at $170 trillion, from just below $100 trillion just before the GFC – the world has created a greater debt bubble than before and much of it is coming due, with Turkey for example has just seen its debt problems increase substantially as its currency tumbles.
Ironically, it’s the same Donald Trump who could instantly calm the markets by forcing the $US lower, something he has expressed a desire for over recent months to improve the competitiveness of US industry. However, his fixation with winning trade wars looks likely to cause more panic before any reprieve is felt.
MSCI Emerging Markets Currency Basket Chart
Fear Index (VIX) Chart
As we mentioned in yesterday’s morning report MM is currently only holding 69% of its funds in Australian equities while we also hold 10% in negative facing ETF’s, half of which is in the leveraged strong Bear (BBUS) ETF. Hence we are in a position where we could rapidly switch our “seller’s hat” for a “buying one” if we see a decent correction by local stocks, we felt today was an opportune time to clarify 4 of our favourite stocks / markets to buy into sharp weakness if / when it eventuates plus of course where we hope to buy.
NB Obviously if this does unfold we will also be looking to take profit on our short ETF positions.
1 BHP Billiton (BHP) $32.20
BHP is not a new addition to our “wish list”, but as we have discussed it remains stubbornly resilient, especially when compared to its peers e.g. over the last month RIO is -9%, Fortescue (FMG) -17%, OZ Minerals (OZL) -9.1% but BHP is only -5.6%.
As we saw last night with the NASDAQ coming under pressure, while the rest of US indices were relatively calm, periods of strong outperformance can change rapidly when investors scramble to lock in profits.
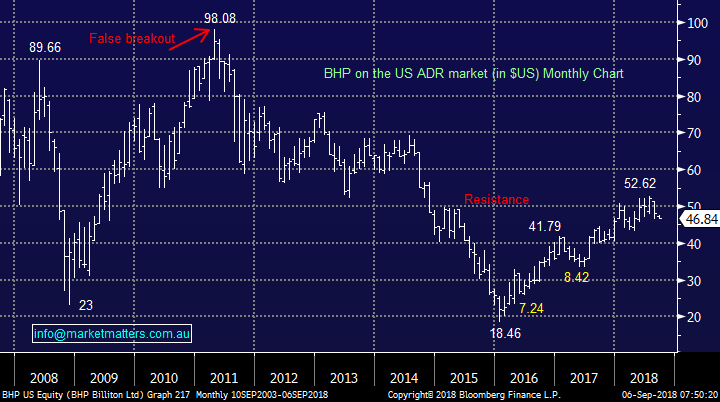
BHP trades actively in the US on the ADR market hence we often get clues as to ideal entry / exit levels from this trading far away. BHP’s last correction on the ADR’s was $US8.42 and we are targeting the same degree this time for optimum risk / reward buying. Assuming the $A remains in the 71.50-72c region this equates to BHP well below $31.
· MM continues to target BHP below $30, but we may consider a staggered approach below $31 depending on where the ADR’s are trading.
BHP Billiton (BHP) in $US Chart
2 Aristocrat Leisure (ALL) $30.89
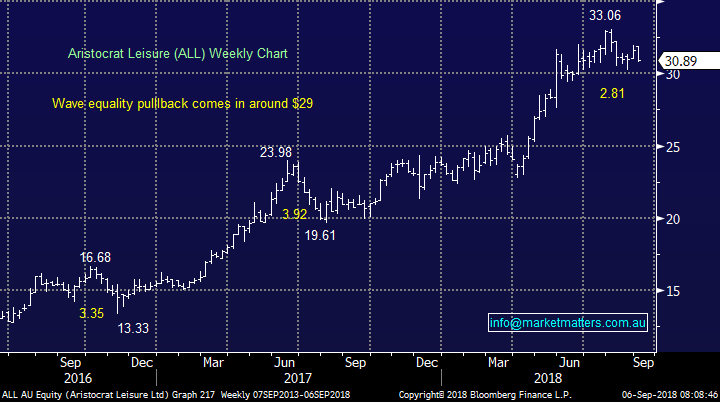
ALL has enjoyed a phenomenal few years and although MM has made some excellent returns in the stock we unfortunately did get off the train to soon in hindsight (a great investor!).
As we saw last night the high performing indices/ stocks are currently vulnerable to sharp corrections and ALL certainly fits the bill, its Est P/E of 25.7x for 2018 is also at the rich end of town which may see selling if investors continue to de-risk.
· MM is a keen buyer of ALL below $29.50, or around 5% lower.
Aristocrat Leisure (ALL) Chart
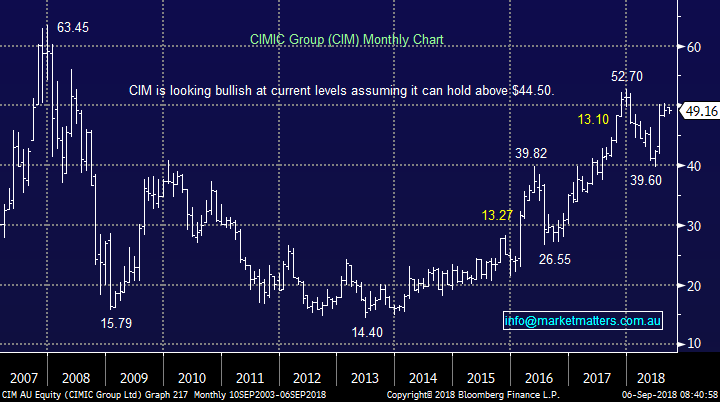
3 CIMIC Group (CIM) $49.16
MM has been “stalking” CIM for a few weeks with a buy target around $47, just over 4% below yesterday’s close. This view has not changed.
· MM remains a buyer of CIM around $47.
CIMIC Group (CIM) Chart
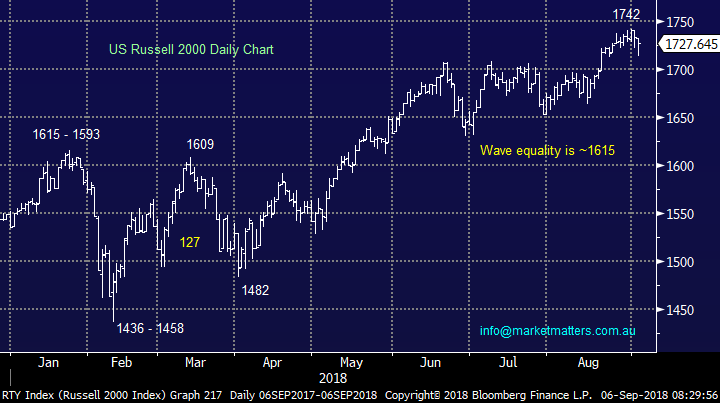
4 US Russell 2000 Index
When we look at markets at MM we combine both technical and fundamental research but with indices themselves it’s probably more like 60% technical.
One important part of technical analysis is to only consider markets that are clear and offer good risk / reward, boring but important. We have tweaked our view on US indices over recent weeks and the below Russell 2000 illustrates perfectly what is now our preferred scenario.
· We are targeting the 1615 area for the Russell 2000, prior to one final push to fresh all-time highs, probably in 2019 i.e. buy US stocks ~6-7% lower.
We may use ETF’s for this or simply close out our current BBUS position if the correction eventuates.
Russell 2000 Chart
Conclusion
MM remains a buyer of ALL, BHP and CIM into weakness plus US indices for a short-term play around 6-7% lower.
Overseas Indices
The US NADDAQ was hit over 1% yesterday, a sharp but quick pullback would not surprise.
US &P500 Chart
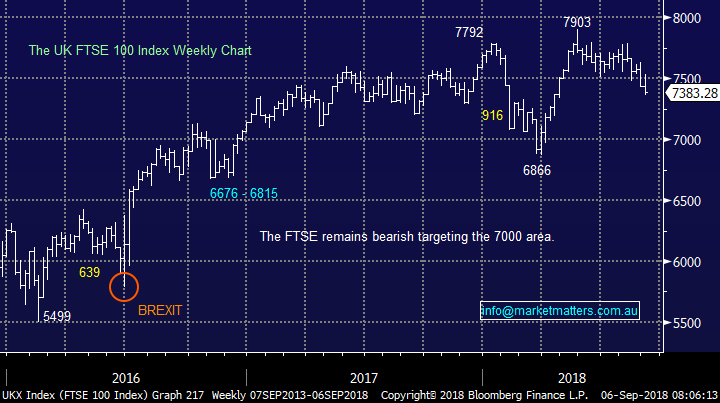
European indices remain bearish led by the FTSE which is now ~5% away from our short-term downside target area.
UK FTSE Chart
Overnight Market Matters Wrap
· Global fears continued to spread overnight as investors are worried that the troubles affecting emerging market economies Argentina and Turkey will spread. Contagion is the word on everyone’s lips. Canada/US trade talks are ongoing and the US may introduce new tariffs on China very soon.
· Metals on the LME were mixed (notable copper was 1% higher), iron ore was slightly better while oil fell more than 1.3%.
· BHP is expected to outperform the broader market after ending its US session up an equivalent of 1.1%, however volatility remains with the global macroeconomic picture, particularly in the emerging markets region.
· The September SPI Futures is indicating the ASX 200 to open 30 points lower to test the 6200 resistance level this morning.
Have a great day!
James & the Market Matters Team
Disclosure
Market Matters may hold stocks mentioned in this report. Subscribers can view a full list of holdings on the website by clicking here. Positions are updated each Friday, or after the session when positions are traded.
Disclaimer
All figures contained from sources believed to be accurate. Market Matters does not make any representation of warranty as to the accuracy of the figures and disclaims any liability resulting from any inaccuracy. Prices as at 06/09/2018
Reports and other documents published on this website and email (‘Reports’) are authored by Market Matters and the reports represent the views of Market Matters. The MarketMatters Report is based on technical analysis of companies, commodities and the market in general. Technical analysis focuses on interpreting charts and other data to determine what the market sentiment about a particular financial product is, or will be. Unlike fundamental analysis, it does not involve a detailed review of the company’s financial position.
The Reports contain general, as opposed to personal, advice. That means they are prepared for multiple distributions without consideration of your investment objectives, financial situation and needs (‘Personal Circumstances’). Accordingly, any advice given is not a recommendation that a particular course of action is suitable for you and the advice is therefore not to be acted on as investment advice. You must assess whether or not any advice is appropriate for your Personal Circumstances before making any investment decisions. You can either make this assessment yourself, or if you require a personal recommendation, you can seek the assistance of a financial advisor. Market Matters or its author(s) accepts no responsibility for any losses or damages resulting from decisions made from or because of information within this publication. Investing and trading in financial products are always risky, so you should do your own research before buying or selling a financial product.
The Reports are published by Market Matters in good faith based on the facts known to it at the time of their preparation and do not purport to contain all relevant information with respect to the financial products to which they relate. Although the Reports are based on information obtained from sources believed to be reliable, Market Matters does not make any representation or warranty that they are accurate, complete or up to date and Market Matters accepts no obligation to correct or update the information or opinions in the Reports. Market Matters may publish content sourced from external content providers.
If you rely on a Report, you do so at your own risk. Past performance is not an indication of future performance. Any projections are estimates only and may not be realised in the future. Except to the extent that liability under any law cannot be excluded, Market Matters disclaims liability for all loss or damage arising as a result of any opinion, advice, recommendation, representation or information expressly or impliedly published in or in relation to this report notwithstanding any error or omission including negligence.


