Will the Australian Real Estate stocks follow their US peers lower? (CBA, WBC, WTC, GMG, SCG, DXS, MGR, SGP)
The ASX200 gave back all of Wednesdays gains yesterday taking the index back to unchanged for the week coming into “Happy Friday” – we warned the bulls to be patient on Tuesday as the statistics point to next week as the ideal time for a Christmas Rally to kick into gear and the comments look on the $$ at present. Only 25% of the index managed to close in the green on Thursday while it was again only the resources who weren’t a headwind for the index as they managed to close up +0.1% by the close of trade.
A strong $A currently appears to be a bad lead for local stocks both intraday & overnight although strangely it’s not the $US earners who are the clear losers – perhaps that will follow if / when the $A does start to challenge the psychological 70c area. This morning the $A is trading around 69c which may explain why we’ve failed to get particularly excited by a fresh bout of US – China trade optimism which has sent the US S&P500 soaring to all-time highs last night.
The UK election will unfold during today and a weak night for the Pound shows nerves are setting in, if Labor wins the -0.8% fall by the Pound (called Cable in FX dealing rooms) in our opinion will probably increase fivefold. Voting concludes at 9am AEST with the results set to start coming through around lunchtime i.e. we could easily see some Friday afternoon volatility today, especially in the 5 stocks looked at yesterday. No lunch out today!!
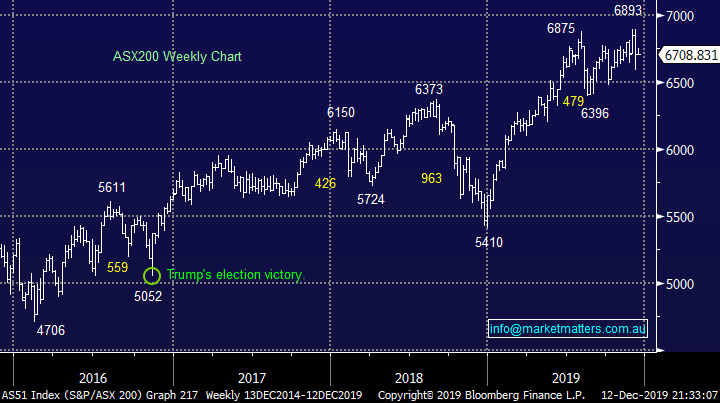
MM believes the ASX200 will again test 6900 this month.
Overnight US stocks were strong with the S&P500 putting on +0.86% to a fresh all-time high, the SPI Futures are calling the ASX200 to regain most of yesterdays losses early this morning, with BHP looking set to open a healthy 30c higher.
**9.28am**Exit polls are now suggesting a Johnson win in the UK – the Pound has now rallied as a result**
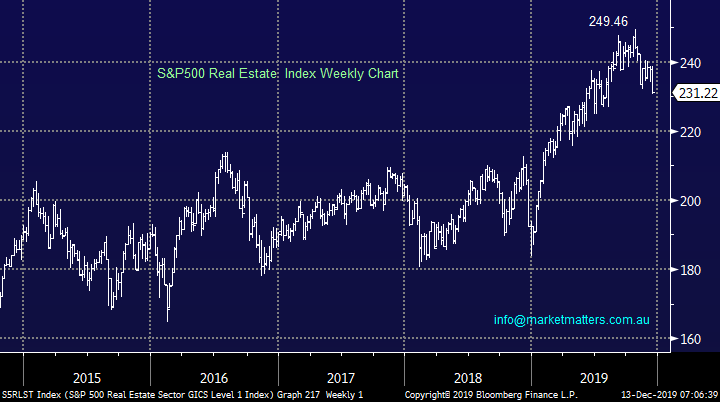
Today we’ve looked at the Real Estate Sector after the US group fell -1.45% overnight when the broad market rallied strongly taking the recent decline over -7% even while the broad market trades at all-time highs.
ASX200 Chart
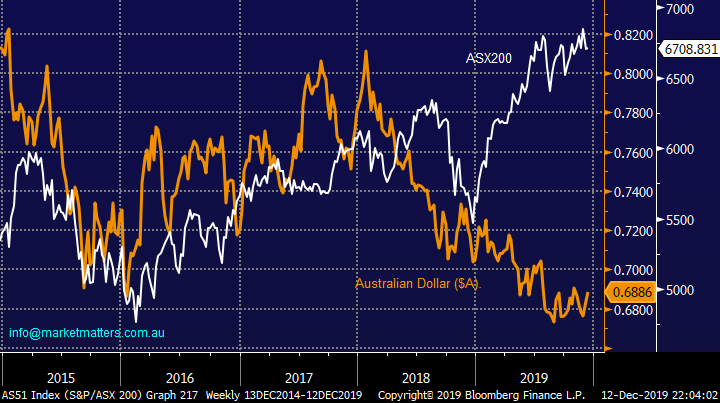
When we stand back and look at the relationship between the $A and local stocks since the major low in 2015/6 its only this year that the ASX200 has noticeably enjoyed a weak $A. The divergence is probably due to local falling interest rates / bond yields which have put pressure on the $A while becoming a major tailwind for stocks.
Moving forward into 2020/21 we believe the divergence has reached Its extreme and looks set to converge into 2019 – the “spread trade” which we are contemplating for our Macro ETF Portfolio is sell the ASX200 and buy the $A but its not straightforward as we are already outright long the $A.
MM remains bullish the $A.
ASX200 v $A Chart
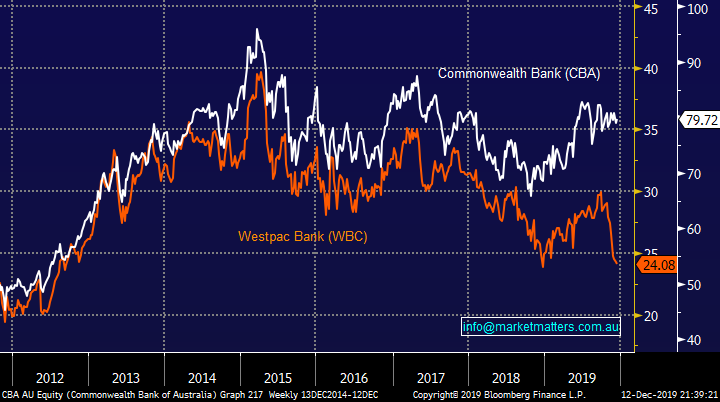
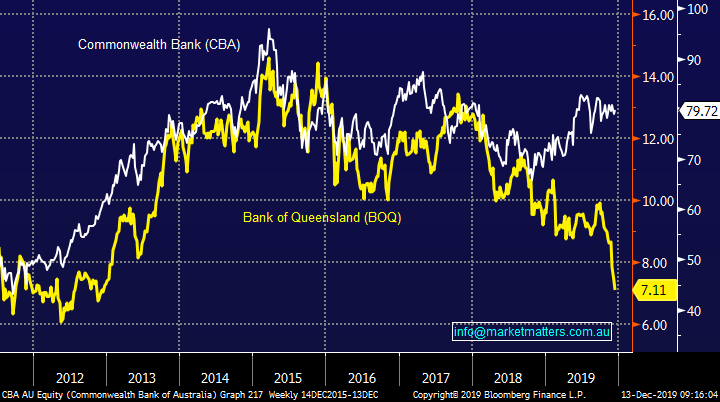
Commonwealth Bank (CBA) has rallied +13.8% over the last year while Westpac has fallen -5.5% taking the performance differential close to 20%, a major move in the context of relative performance within the “Big 4 Banks” – ANZ is marginally better than WBC but NAB is +3% for the year.
The change between the 2 is definitely not without reason and following dividend cuts by WBC their expected yields next year are now CBA 5.4% and WBC 6.6%, both fully franked. On this simple yield basis we feel WBC would start to look attractive if / when the differential blows out to ~2%.
In terms of multiples, CBA now trades at a P/E premium to the sector of 29% versus its historical premium of 12%. It’s a better bank and justifies the higher multiple however we’re now at the most extreme point as far as my data goes back.
MM feels the CBA – WBC elastic band has further to stretch
Commonwealth Bank (CBA) v Westpac Bank (WBC) Chart
As a more extreme example, Bank of QLD (BOQ) now trades on 11x which is a 13% discount to the sector versus a usual 2% discount. Selling CBA and buying BOQ as an aggressive pairs trade on relative valuation grounds looks interesting. NB, BOQ has a Share Purchase Plan on with the pricing window next week.
Commonwealth Bank (CBA) v Bank of QLD (BOQ) Chart
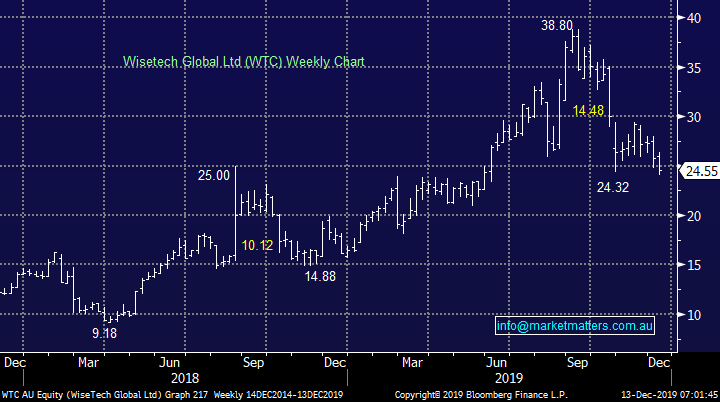
The IT Sector again performed poorly yesterday this time dragged lower by the likes of Afterpay Touch (APT), EML Payments (EML) and Wisetech (WTC) who all fell over -1.5% but importantly none of the sector managed to close in positive territory. We’re still not keen on the high valuation sector at current levels but into a little more weakness 1 or 2 might become prime candidates for a sharp bounce into January.
MM will consider WTC as aggressive play a few % lower.
Wisetech Global (WTC) Chart
The US Real Estate sector struggles.
The US Real Estate Sector caught my eye this morning as it fell close to -1.5% while the Dow was up over 200-points, yet more clear sector rotation. Any hint of a rally by US bond yields, or even and failure to decline further, is becoming a headwind for the interest rate sensitive sectors like the Utilities and Real Estate, both whom declined last night.
At MM we are looking for a major inflection point / low for bond yields, it may even already be in place. If this view does prove correct it’s good for our preference for cyclical value over expensive growth into 2020 but it looks ominous for the likes of Real Estate / Utilities. =
The US Real Estate Sector looks poised to fall further.
US S&P500 Real Estate Sector Chart
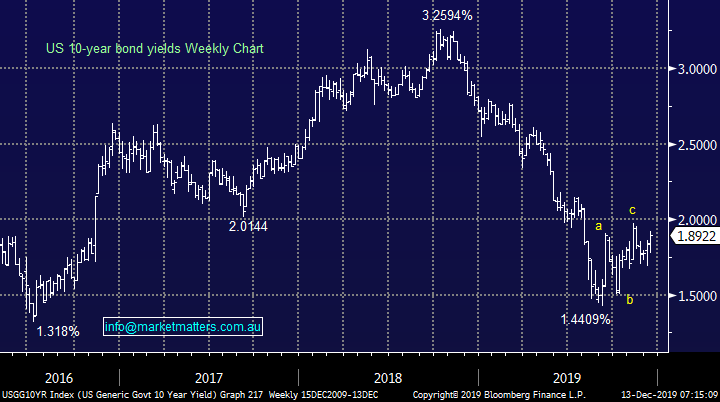
The Real Estate stocks appear to have given up on bond yields making fresh lows as they struggled to bounce even when yields did pullback in October. It feel like fund managers are looking for opportune times to exit / reduce exposure to the sector.
The risk / reward for the US Real Estate Sector is unattractive in our opinion.
US 10-year Bond Yield Chart
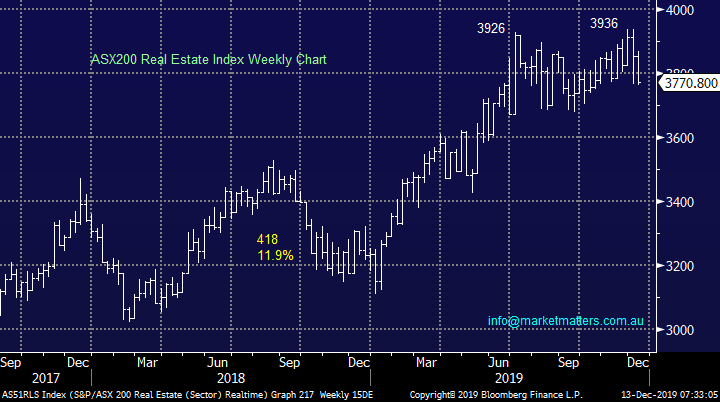
Moving onto the Australian Real Estate stocks, the picture is not surprisingly similar although it’s not as negative at this point in time but we feel the risks are mounting of some catch up by the local stocks – an initial ongoing pullback of 2-3% feels likely. The other aspect dragging the performance of the listed players domestically has been a string of capital raisings and a number of new listings – a sign that those in the industry are keen to increase FUM as much as they can while times are good, because it won’t last for ever.
MM is net bearish the Australian Real Estate stocks short-term.
ASX200 Real Estate Sector Chart
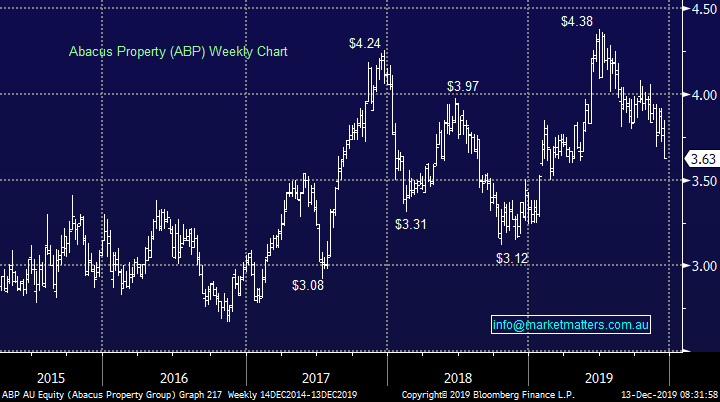
Today I have looked at the 5 largest stocks in the sector by market cap for any further clues / ideas moving forward into 2020. We currently hold Abacus Property Group (ABP) and Stockland (SGP) in the MM Income Portfolio – probably one position too many.
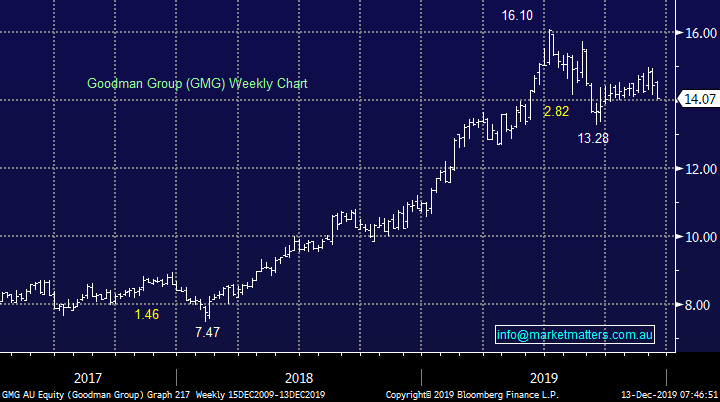
1 Goodman Group (GMG) $14.07.
GMG has been a huge success story of both the sector and market of the last 2-years taking the companies market cap to over $27bn. The stocks not cheap trading on an Est P/E for 2020 of 24.7x while it yields 2.1% unfranked.
This integrated property group is a quality operation but we do question the attractiveness of the risk / reward at today’s price. Technically it has generated a buy signal but our “Gut Feel” is its feeling heavy i.e. “if in doubt stay out”.
MM is neutral GMG at present.
Goodman Group (GMG) Chart
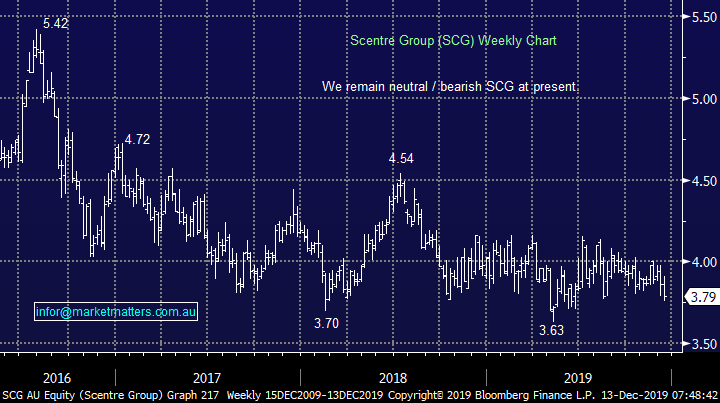
2 Scentre Group (SCG) $3.79.
MM has been on the bearish side of the coin for months with regard to shopping centre operator SCG. On the surface some investors might be attracted to the stocks Est. P/E for 2020 of 15x while its ~6% unfranked yield is certainly compelling in today’s environment but the stocks underperformance / downtrend remains disconcertingly intact. Retail assets are being sold for below book value and this does not bode well for the larger players in the sector.
MM remains neutral to bearish SCG.
Scentre Group (SCG) Chart
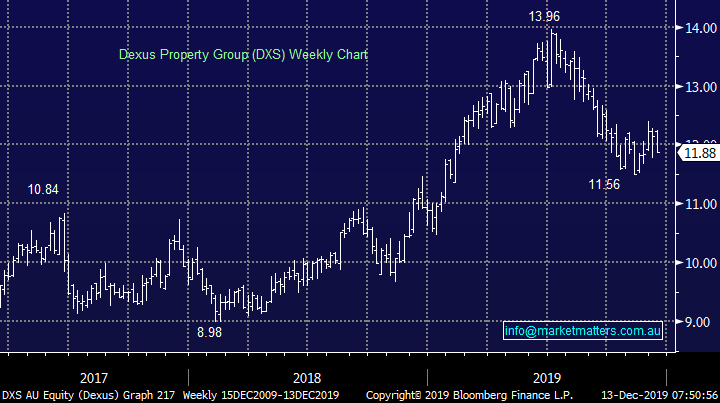
3 Dexus Property Group (DXS) $11.88.
Diversified real estate operator DXS has endured a tough year and we can see a further 5% downside in the months ahead. The stocks not particularly cheap trading on an Est PE for 2020 of 19.8x while its yield of 4.3% part-franked is certainly palatable today. However into ongoing weakness the stock will become relatively attractive.
MM may consider DXS between $11 and $11.25.
Dexus Property Group Chart
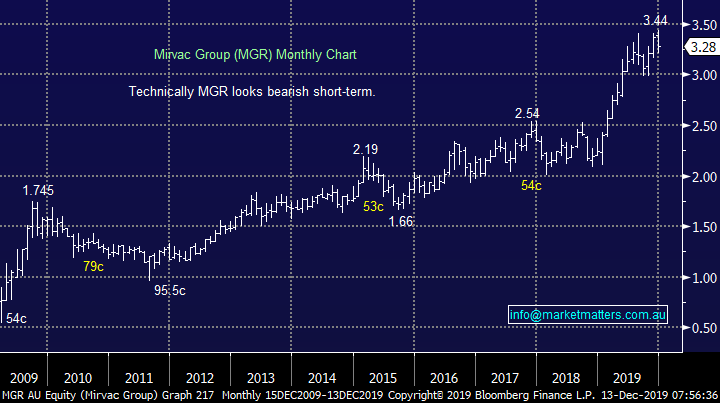
4 Mirvac (MGR) $3.28.
Real Estate operator and developer MGR has been an excellent performer over the last 2-years while many expected it to struggle. However we feel it’s got ahead of itself and a retest of the $3 area now looks likely.
MM is bearish MGR short-term.
Mirvac (MGR) Chart
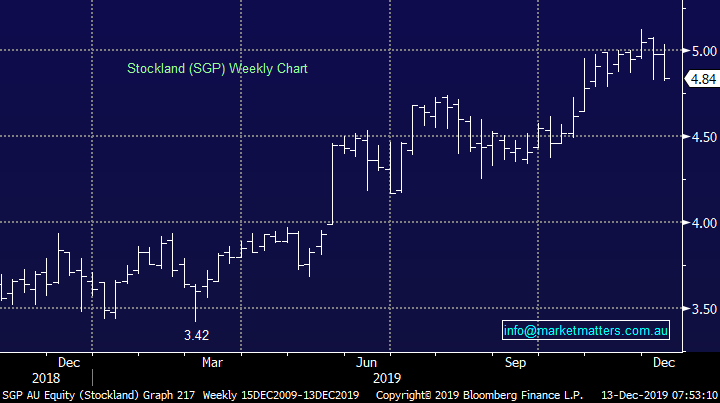
5 Stockland (SGP) $4.84.
Diversified Australian property group SGP is a stock we hold in our Income Portfolio and happily it looks the best of the 5 stocks we’ve considered today plus importantly its well over 5% unfranked yield is attractive.
MM is neutral / bullish SGP.
Stockland (SGP) Chart
Conclusion (s)
MM is not currently a fan of the Australian Real Estate Sector although MGR and DXS will be interesting into weakness.
We are relatively comfortable with our SGP holding for now but ABP is more of a concern after rejecting the $4 area fairly aggressively.
Abacus Property (ABP) Chart
Overseas Equities.
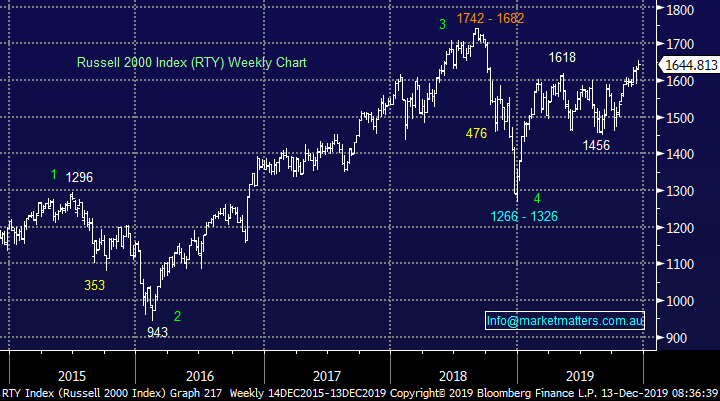
US stocks made fresh all-time highs this morning after embracing positive rhetoric around the US - China trade talks.
Ultimately MM still anticipates the Russell 2000 will advance another 6-8%.
US Russell 2000 Chart
Overnight Market Matters Wrap
- US equities rallied into record territory while bonds sold off overnight following reports US and China had reached an agreement in principle for the phase 1 trade deal which is ready to be presented to President Trump for signing.
- The prospects of a trade agreement also buoyed the commodity markets with crude oil at a 3-month high, currently at US$59.25/bbl. and Dr.Copper at 8-month highs of $280.40/lb.
- Assets surrounding the emerging markets and the tech sector are likely to outperform with BHP ending its US session up an equivalent of 0.82% from Australia’s previous close.
- The December SPI Futures is indicating the ASX 200 to open 23 points higher towards the 6735 level this morning.
Have a great day!
James & the Market Matters Team
Disclosure
Market Matters may hold stocks mentioned in this report. Subscribers can view a full list of holdings on the website by clicking here. Positions are updated each Friday, or after the session when positions are traded.
Disclaimer
All figures contained from sources believed to be accurate. All prices stated are based on the last close price at the time of writing unless otherwise noted. Market Matters does not make any representation of warranty as to the accuracy of the figures or prices and disclaims any liability resulting from any inaccuracy.
Reports and other documents published on this website and email (‘Reports’) are authored by Market Matters and the reports represent the views of Market Matters. The Market Matters Report is based on technical analysis of companies, commodities and the market in general. Technical analysis focuses on interpreting charts and other data to determine what the market sentiment about a particular financial product is, or will be. Unlike fundamental analysis, it does not involve a detailed review of the company’s financial position.
The Reports contain general, as opposed to personal, advice. That means they are prepared for multiple distributions without consideration of your investment objectives, financial situation and needs (‘Personal Circumstances’). Accordingly, any advice given is not a recommendation that a particular course of action is suitable for you and the advice is therefore not to be acted on as investment advice. You must assess whether or not any advice is appropriate for your Personal Circumstances before making any investment decisions. You can either make this assessment yourself, or if you require a personal recommendation, you can seek the assistance of a financial advisor. Market Matters or its author(s) accepts no responsibility for any losses or damages resulting from decisions made from or because of information within this publication. Investing and trading in financial products are always risky, so you should do your own research before buying or selling a financial product.
The Reports are published by Market Matters in good faith based on the facts known to it at the time of their preparation and do not purport to contain all relevant information with respect to the financial products to which they relate. Although the Reports are based on information obtained from sources believed to be reliable, Market Matters does not make any representation or warranty that they are accurate, complete or up to date and Market Matters accepts no obligation to correct or update the information or opinions in the Reports. Market Matters may publish content sourced from external content providers.
If you rely on a Report, you do so at your own risk. Past performance is not an indication of future performance. Any projections are estimates only and may not be realised in the future. Except to the extent that liability under any law cannot be excluded, Market Matters disclaims liability for all loss or damage arising as a result of any opinion, advice, recommendation, representation or information expressly or impliedly published in or in relation to this report notwithstanding any error or omission including negligence.


