Will JB HI-FI’s result create fresh interest in retail? (JBH, SUL, HVN, AHG, PMV)
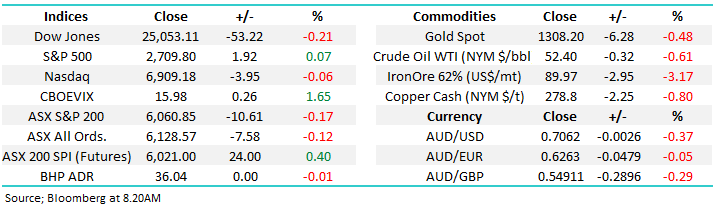
The ASX200 tried to fall yesterday but from lunchtime it regained its recent strong bid tone and ground higher into the close finally managing to close down only 10-points / 0.2%. Under the hood it was more sector rotation with the main theme on the day sell banks and buy large cap resources e.g. BHP up +2% while CBA fell -1.2%. Bendigo Bank (BEN) certainly didn’t help the regional banks coming in with a poor result sending it down -6.8% while Bank of Queensland fell (BOQ) fell -4% in sympathy – we will look at these a little later.
The return to work for much of Asia appeared to help the resources sector with the major iron ore names all rallying strongly, nobody seems game to pick a top in the bulk commodity since the awful Vale disaster in Brazil. Having taken profit on our RIO and Fortescue (FMG) positions a little early sitting on the sidelines feels the logical place to be as the sector volatility increases almost daily e.g. FMG is up over 36% for the last month.
MM remains in “buy mode “due to both our medium-term market view and relatively large cash position.
Overnight US markets were mixed with the Dow off 53-ponts but the S&P500 closing just positive. The SPI is calling the ASX200 to more than regain yesterday’s losses although BHP gave no obvious lead.
Today we are going to look at the retailer sector following the better than expected result by JB Hi FI (JBH) which finally closed up only 1.5%, well off its opening levels.
ASX200 March SPI Futures Chart

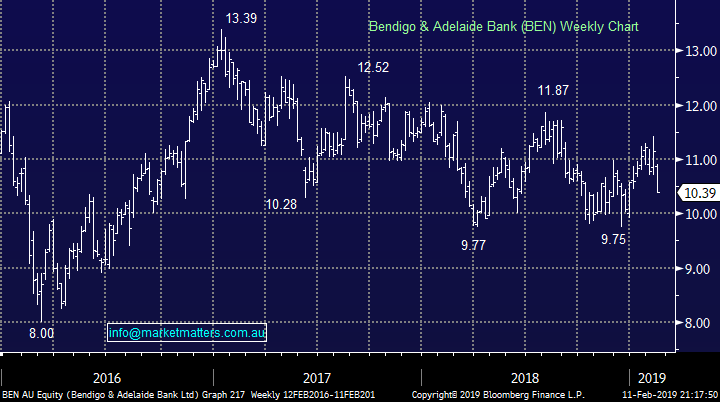
Yesterday’s result by Bendigo (BEN) disappointed the market with net profit after tax (NPAT) up only 0.2% to just over $200m, however the trend of rising costs while revenue sits idle was not a good look. Downgrades will flow today with our Banking Analyst at Shaw cutting FY19 profit expectations by 5%, and 2020 and 2021 by a whopping 10%.
The stocks now yielding 6.7% fully franked and with the shares trading ex-dividend on the 1st of March investors who buy this week are forecast to receive ~10% fully franked over the next 12 ½ months – far from unattractive on the surface. While stocks that miss expectations will generally spend time in the ‘sin bin’, if we see ongoing aggressive selling in BEN we will consider the stock ~$9.50 on a cum div basis i.e. this month.
Bendigo Bank (ASX: BEN) Chart
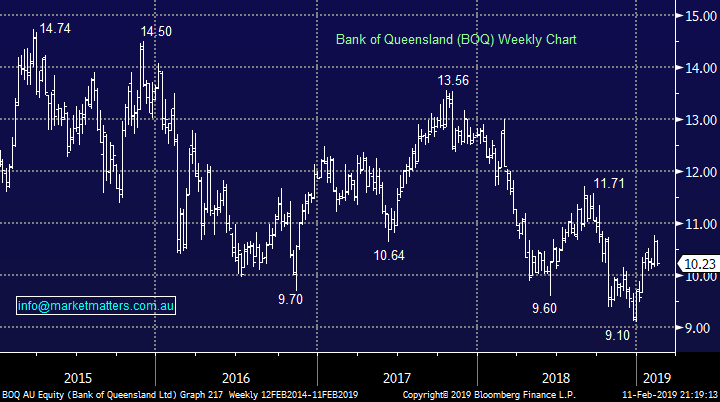
BOQ doesn’t report until mid-April with investors appearing likely to remain nervous until the uncertainty is removed following the average BEN set of numbers.
BOQ actually yields more than BEN currently forecast to pay ~7.4% fully franked assuming no skeletons in the closet.
Surprisingly the regionals have actually outperformed the “Big 4”, except CBA, over both the last 3 and 6-months making us reluctant pick a bottom in either just yet.
Bank of Queensland (ASX: BOQ) Chart
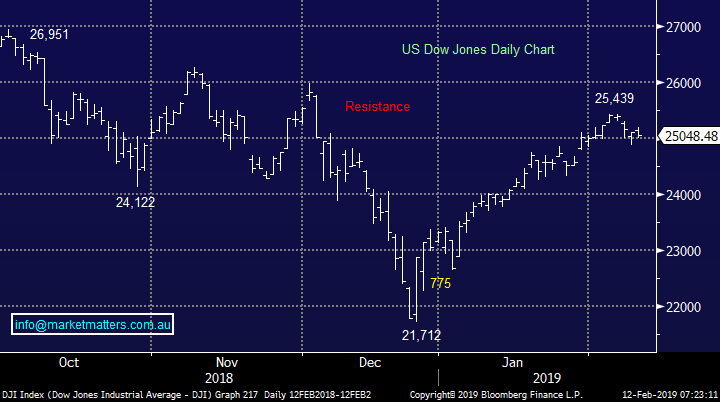
No change, we still feel US markets now have a strong risk to the downside with our target ~5-6% lower.
US Dow Jones Chart
Are we seeing the rumblings of opportunity in some retail stocks?
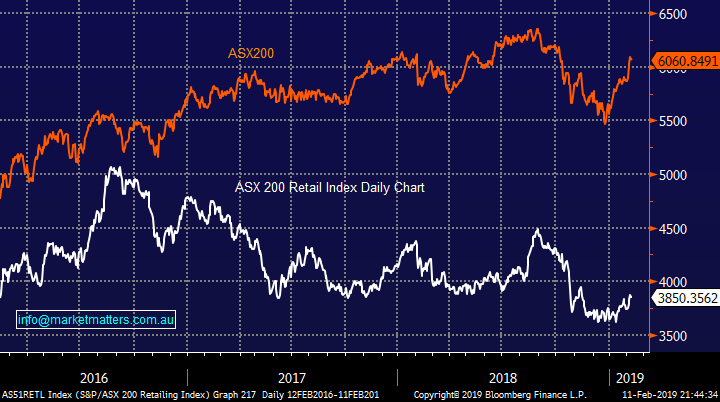
The underperformance of the local Retail Index compared to the broad index has been horrible for investors who have remained faithful to the sector – since August 2016 the ASX200 has rallied ~10% while the Retail Index has fallen well over 20%.
We have no doubt things are tough in retail land and we remain concerned about the average Australians household debt levels especially while confidence is dented as house prices fall but of course things always look / feel awful at the bottom! However it should also be remembered that many are forecasting the total demise of the old fashioned shopping mall as on-line shopping goes from strength to strength – there are a few moving parts in this equation but all seem to be negative.
The degree of negativity towards retails can be illustrated by their regular occurrence in the markets “short report” i.e. JB HI-FI 15%, Myer 11.3% and Harvey Norman 9.3%. The markets undoubtedly negative retail but it’s important to always remember that it can often stay this way longer than expected although markets do look 6-months ahead for when they believe the dial will turn.
Previously we saw the retail elastic band get stretched way too far in June 2012 before an impressive ~70% rally unfolded in about a year demonstrating perfectly how large the returns can be if you can pick when things have become just too pessimistic.
Today we will look at 5 retail stocks in the ASX200 for any signs of selling exhaustion – I feel any play we make in retail in the years to come will be stock specific as opposed to sector orientated.
ASX200 v ASX200 Retailing Index Chart
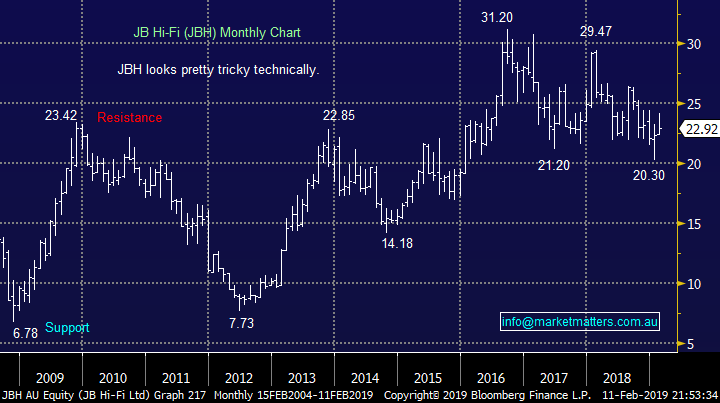
1 JB HI-FI (JBH) $22.92
Yesterday JB HI-FI delivered a solid first half result with net profit after tax (NPAT) up almost 5% to $160m, plus its dividend was increased almost 6% to 91c taking its yield to 5.76% fully franked.
This was a good result in a tough environment, and the outlook was okay, interestingly the stocks heavily shorted and trading on undemanding P/E for 2019 of under 11x, however the shorts are using it as a proxy for Australia’s deteriorating economic picture and indebted consumer, not to mention the Amazon shadow!
For JB, online sales in Australia grew by 21% to $144.4m but they still account for under 6% of sales leaving plenty of room for growth. We were surprised to see the sellers take hold of the stock after it traded above $24 early in day before finally closing below $23 implying that the markets not convinced that JBH can maintain this performance – not a good sign, it rarely pays to “fight the tape”.
While we can see value in JBH around $22, fighting the short thesis on this one seems all too hard
JB HI-FI (ASX: JBH) Chart
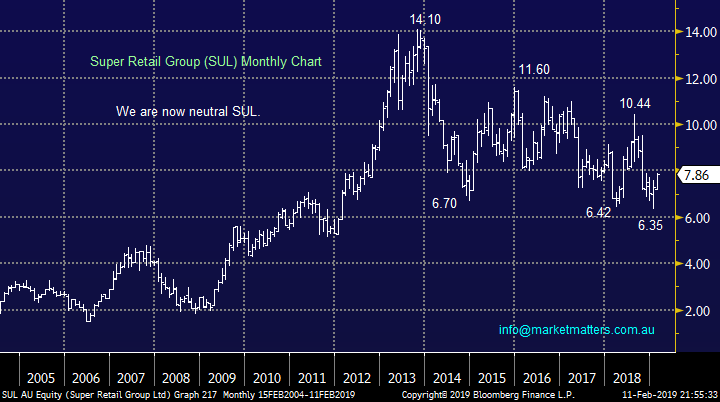
2 Super Retail Group (SUL) $7.86
Yesterday SUL rallied 3.65% as a little relief washed over the sector following the JBH result implying that perhaps things aren’t too bad after all, expectations are certainly very low. I think it was more short covering than anything given JB’s less bad print.
SUL reports later in the week with its current Est P/E of 10.34x for 2019 and yield of 6.2% fully franked certainly showing the lack of optimism for the company moving forward. When we consider the companies brands which include Super Cheap Auto, BCF and Rebel Sport the exposure to our slowing housing market, which scares so many, is not as concerning compared to many other retailers.
Kathmandu (KMD) recently provided a poor trading update which is important for SUL – SUL’s BCF and Macpac brands have a high correlation to KMD.
Similar to JBH , while we see value in SUL, one more leg lower below seems a strong possibility
Super Retail Group (ASX: SUL) Chart
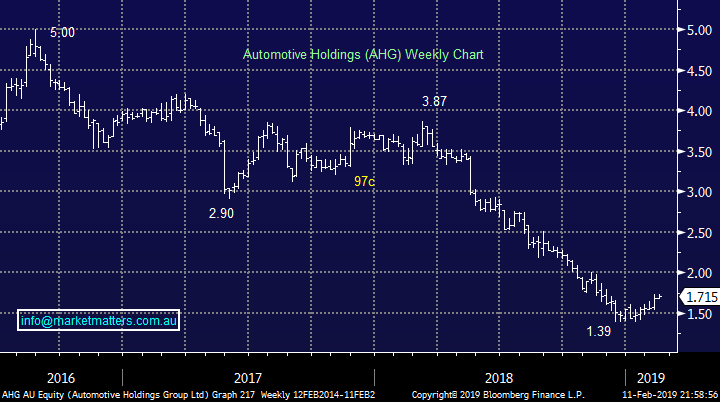
3 Automotive Holdings Group (AHG) $1.71
AHG has bounced over 20% from its recent all-time low but considering the last few years this is nothing to create a song a dance about. The car dealerships where AHG makes its money is one area we are concerned with into 2019/2020 however the share price clearly reflects that we are with the crowd on this one – consumer confidence has been hit on the spending front as property prices slip leading to very lacklustre car sales.
The stock’s trading on a P/E for 2019 of 10.2x while yielding close to 10%, for now. The company reports in 10-days’ time and the board has already downgraded their estimate of operating profit to the high $50m region compared to $74.8m last year.
I do believe we are likely to see a good long-term opportunity in AHG, especially as directors have been accumulating their own shares at these depressed levels. At this stage I would consider buying fresh lows if / when we get another piece of bad news.
MM is considering AHG if we get another leg down.
Automotive Holdings Group (ASX: AHG) Chart
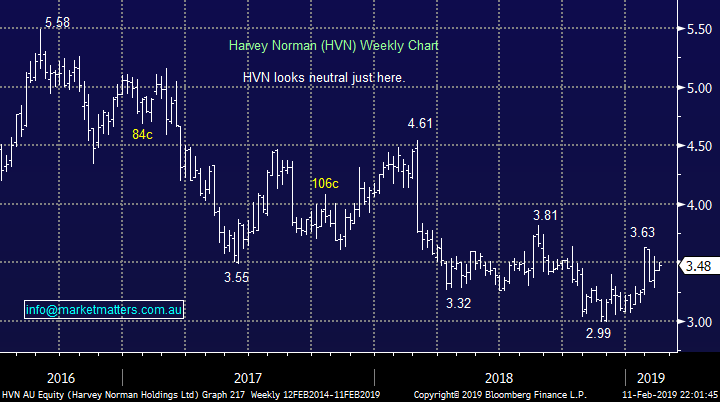
4 Harvey Norman (HVN) $3.48
The furniture / electronics retailer Harvey Norman (HVN) sits in a very average position as we see a well-publicised slowing in the Australian housing market. We feel that there is a distinct possibility that Gerry will release a very average set of numbers sometime in the next 1-2 years which is when the stock price will probably be worth considering.
HVN reports in 2-weeks’ time and the current P/E of 11.3x is a touch richer than most in the sector while the 8.6% fully franked yield has probably caught some investors over the last 2-years.
There is a good chance of increased capital management here after they raised money recently to pay down debt, or so they say. I suspect they’ll get ahead of the Federal election and do something with their large franking balance soon.
MM has no interest in HVN until below $3.
Harvey Norman (ASX: HVN) Chart
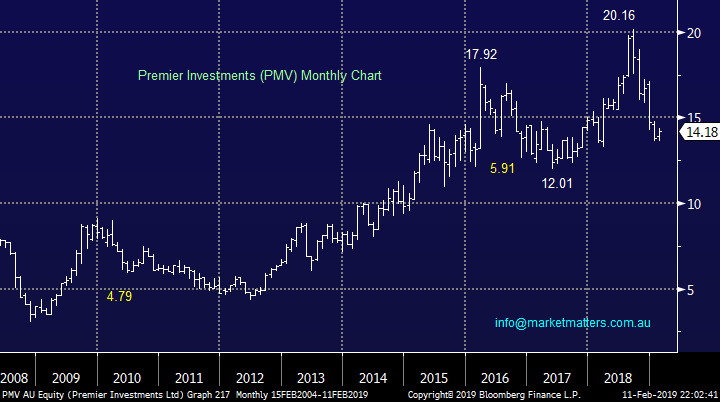
5 Premier Investments (PMV) $14.18
PMV runs a number of household name brands including Portman’s, Just Jeans, Peter Alexander and Smiggle, a business that is under pressure by the internet as opposed to property prices.
MM has been bearish PMV over the last 6-months targeting a fall towards $12 which has primarily unfolded but we see no obvious catalyst to buy the stock at this point in time. It’s a simple leave alone to us.
MM is now neutral PMV.
Premier Investments (ASX: PMV) Chart
Conclusion
MM is keeping an eye on the retail sector but no stocks are exciting us at this moment in time.
Another leg lower for the sector will get our attention
Overnight Market Matters Wrap
· The US closed with little change overnight, as investors sit on the sideline waiting for further information with regards to US-China trade talks as well as any possibility for any US government shutdown.
· Across to the Euro region, the UK economy was whacked by weak sentiment surrounding uncertainty from Brexit. While in Asia, two large Chinese borrowers missed bond payment deadlines this month.
· All metals on the LME closed in the red. While the uncertainty over US-Chinese trade talks and a strong $US has seen crude oil fall to a two week low. OPEC will comment on the outlook for oil later today. Crude oil is currently down 0.61%.
· The March SPI Futures is indicating the ASX 200 to open 25 points higher, testing the 6085 level this morning.
Have a great day!
James & the Market Matters Team
Disclosure
Market Matters may hold stocks mentioned in this report. Subscribers can view a full list of holdings on the website by clicking here. Positions are updated each Friday, or after the session when positions are traded.
Disclaimer
All figures contained from sources believed to be accurate. Market Matters does not make any representation of warranty as to the accuracy of the figures and disclaims any liability resulting from any inaccuracy. Prices as at 12/02/2019
Reports and other documents published on this website and email (‘Reports’) are authored by Market Matters and the reports represent the views of Market Matters. The MarketMatters Report is based on technical analysis of companies, commodities and the market in general. Technical analysis focuses on interpreting charts and other data to determine what the market sentiment about a particular financial product is, or will be. Unlike fundamental analysis, it does not involve a detailed review of the company’s financial position.
The Reports contain general, as opposed to personal, advice. That means they are prepared for multiple distributions without consideration of your investment objectives, financial situation and needs (‘Personal Circumstances’). Accordingly, any advice given is not a recommendation that a particular course of action is suitable for you and the advice is therefore not to be acted on as investment advice. You must assess whether or not any advice is appropriate for your Personal Circumstances before making any investment decisions. You can either make this assessment yourself, or if you require a personal recommendation, you can seek the assistance of a financial advisor. Market Matters or its author(s) accepts no responsibility for any losses or damages resulting from decisions made from or because of information within this publication. Investing and trading in financial products are always risky, so you should do your own research before buying or selling a financial product.
The Reports are published by Market Matters in good faith based on the facts known to it at the time of their preparation and do not purport to contain all relevant information with respect to the financial products to which they relate. Although the Reports are based on information obtained from sources believed to be reliable, Market Matters does not make any representation or warranty that they are accurate, complete or up to date and Market Matters accepts no obligation to correct or update the information or opinions in the Reports. Market Matters may publish content sourced from external content providers.
If you rely on a Report, you do so at your own risk. Past performance is not an indication of future performance. Any projections are estimates only and may not be realised in the future. Except to the extent that liability under any law cannot be excluded, Market Matters disclaims liability for all loss or damage arising as a result of any opinion, advice, recommendation, representation or information expressly or impliedly published in or in relation to this report notwithstanding any error or omission including negligence.


