Why is Financial Media Worrying about “Yield Curve Inverting”?
The ASX200 rallied impressively yesterday illustrating 2 reoccurring themes of recent months i.e. the Australian market is dominated by the banks and we have generally been an excellent leading indicator for the next session (s) in global markets.
Equity markets continue to ignore any hand grenades thrown at them, primarily by Donald Trump, which can only be interpreted positively in the short-term. I actually watched his press conference last night following the NATO meetings – absolutely baffling! However a market that ignores bad news is clearly a strong market.
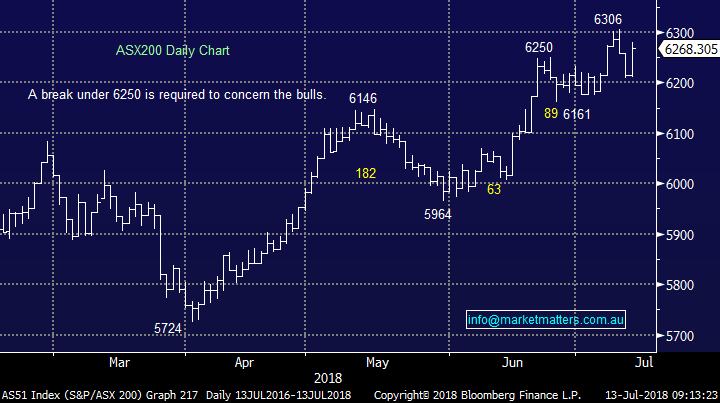
- MM is overall now neutral the ASX200 with a close below 6140 required to seriously concern us, importantly we remain in “sell mode”.
US Stocks closed up almost 1% last night regaining their previous day’s losses caused by trade war concerns, this has helped the SPI futures indicate an open up ~20-points for the ASX200 this morning. Again, it appears the banks / broad market will shoulder much of the heavy lifting as BHP closed mildly lower in the US this morning.
Today’s report is going to look at the most widely watched interest rate correlation by market economists i.e. the yield curve:
- The yield curve is simply the difference in interest rates over different periods e.g. 2-year bond yields compared to 10-year bond yields.
Contrasting dated bond yields are largely influenced by different economic factors e.g. With US 2-years it’s the likely path of interest rate changes by the Fed while the 10-years are significantly influenced by the perceived path of inflation.
Hence the yield curve provides some important market clues to investors.
NB, I have tried hard to make this important subject interesting – fingers crossed!
ASX200 Chart
An “inverted yield curve”.
The first question many subscribers are probably asking is what an inverted yield curve actually means:
- An inverted yield curve is an interest rate environment in which longer-term bonds have a lower yield than shorter-dated ones.
This type of yield curve (inverted) is the rarest of the three main curve types and importantly its considered by many to be a predictor of economic recessions.
The most recent 5 US recessions have occurred when 2-year bond yields have risen above their 10-year friends which is illustrated by the following chart.
US 2-year & 10-year bond yields Chart
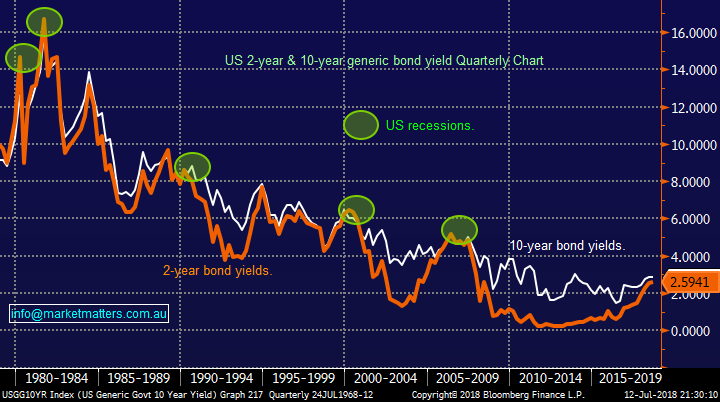
Today this relationship is garnering ever increasing attention because the trend is towards inversion i.e. implying a potential US recession on the horizon.
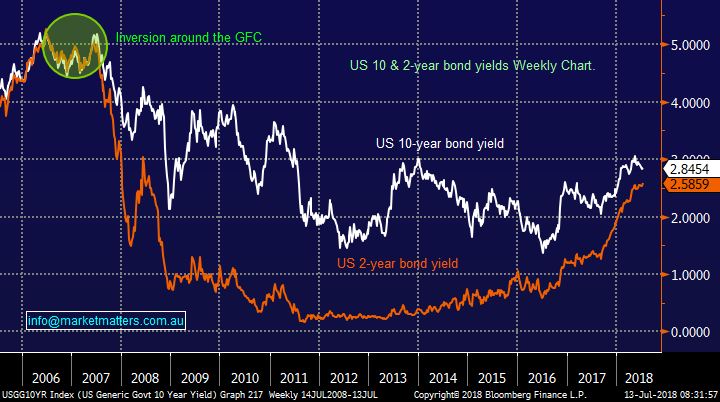
Noticeably the difference between the US 2 and 10-year bonds has contracted from around 2.5% to only 0.3% today with inversion clearly on the table in 2018/19.
US 2-year & 10-year bond yields Chart
The next logical question is what effect this bond yield inversion has on equities assuming we believe historical economics will hold true and a recession will accompany the phenomenon.
The numbers are extremely sobering when we consider how US stocks (S&P500) have performed around their last 6 recessions.
1. The recession of 1973-5 saw a 40% correction during the recession.
2. The recession in 1980 saw a 17% correction during the start of the recession.
3. The recession of 1981-2 saw a 20% correction during the recession.
4. The recession of 1990-91 saw a 20% correction during the start of the recession.
5. The recession of 2001 saw a 47% correction which started prior and finished after.
6. The GFC recession of 2007-9 saw a 56% correction primarily during the recession.
While stocks have endured significant pullbacks without a recession including October 1987 the big “R word” is unquestionably the usual culprit.
The US Federal Reserve is slowly trying to unwind the huge QE / stimulus that it pumped into the financial system following the GFC to avoid a great depression similar to that experienced back in 1929. The Fed has consistently raised interest rates in 2017 /8 with more intended for 2019.
- Raising interest rates is negative for bond prices which has probably helped stocks in 2017/8.
- However, there’s usually an “uncle point” where higher rates hurt the economy / stock market.
The simple statistics around US recessions should also have investors on alert before we even consider the looming inverted yield curve.
- Since the Great Depression back in 1929 the US has experienced a recession on average every 59-months, or basically every 5-years.
- The average length of such recessions is just under 10-months.
It’s now been just over 9-years since the last recession helping the current bull market become the second longest in history.
Clearly if you believe in history / statistics with a looming inverted “yield curve” it’s hard to become excited around stocks at this stage of the cycle.
US S&P500 Chart
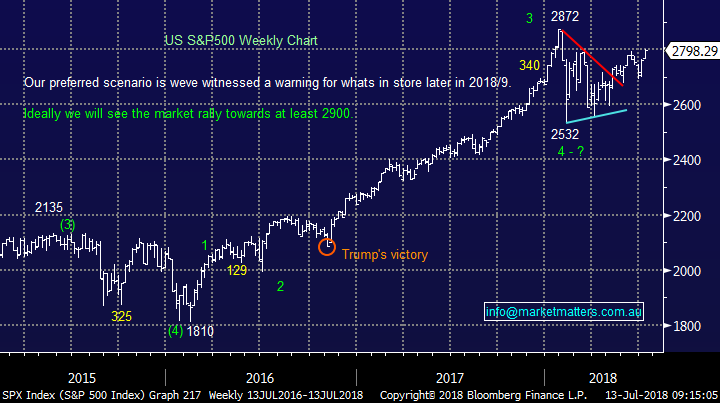
Conclusion (s)
We are nervous around stocks but the pieces of the puzzle to become fully bearish are not yet in place.
Global markets
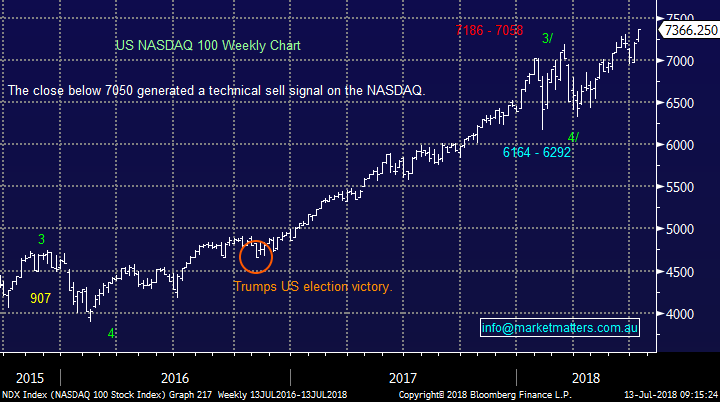
The US market feels like it’s on a Trump inspired rollercoaster, last night the NASDAQ impressively made fresh all-time highs.
US NASDAQ Chart
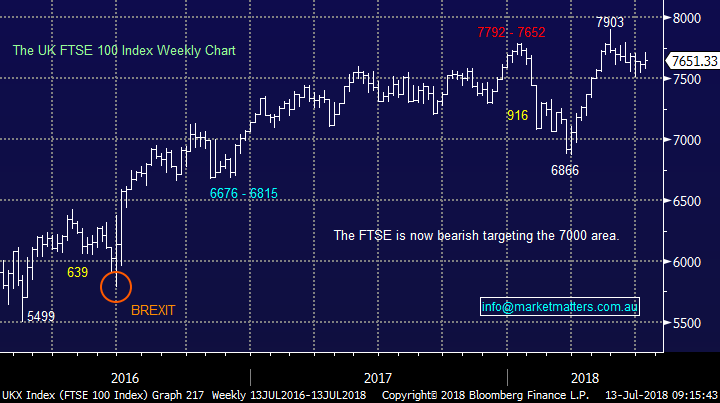
European stocks traded ok overnight but not yet with the enthusiasm that we anticipated.
UK FTSE Chart
Overnight Market Matters Wrap
· The US equity markets rallied as China refrained from hitting President Trump back on trade. In particular, the US and China signalled they were open to resuming trade talks after days of retaliatory threats.
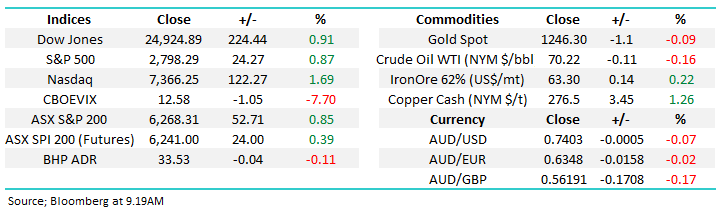
· The S&P 500 closed at the highest level since February, while 10-year Treasuries yields held around 2.85%. The dollar was mixed against its G-10 peers, with the AUD the best performer. WTI crude edged down, while gold advanced.
· US core inflation edged up to 2.3% in June from 2.2% in May, as forecast, while rising energy prices drove up the headline number to a six-year high of 2.9%, also in line with consensus.
· Brent advanced as the IEA warned OPEC output may be stretched to the limit by supply losses, even as Libya reopened shuttered oil fields. WTI fluctuated, while metals climbed, except aluminium.
· The September SPI Futures is indicating the ASX 200 to open 29 points higher, testing the 6300 resistance level this morning.
Have a great day!
James & the Market Matters Team
Disclosure
Market Matters may hold stocks mentioned in this report. Subscribers can view a full list of holdings on the website by clicking here. Positions are updated each Friday, or after the session when positions are traded.
Disclaimer
All figures contained from sources believed to be accurate. Market Matters does not make any representation of warranty as to the accuracy of the figures and disclaims any liability resulting from any inaccuracy. Prices as at 13/07/2018
Reports and other documents published on this website and email (‘Reports’) are authored by Market Matters and the reports represent the views of Market Matters. The MarketMatters Report is based on technical analysis of companies, commodities and the market in general. Technical analysis focuses on interpreting charts and other data to determine what the market sentiment about a particular financial product is, or will be. Unlike fundamental analysis, it does not involve a detailed review of the company’s financial position.
The Reports contain general, as opposed to personal, advice. That means they are prepared for multiple distributions without consideration of your investment objectives, financial situation and needs (‘Personal Circumstances’). Accordingly, any advice given is not a recommendation that a particular course of action is suitable for you and the advice is therefore not to be acted on as investment advice. You must assess whether or not any advice is appropriate for your Personal Circumstances before making any investment decisions. You can either make this assessment yourself, or if you require a personal recommendation, you can seek the assistance of a financial advisor. Market Matters or its author(s) accepts no responsibility for any losses or damages resulting from decisions made from or because of information within this publication. Investing and trading in financial products are always risky, so you should do your own research before buying or selling a financial product.
The Reports are published by Market Matters in good faith based on the facts known to it at the time of their preparation and do not purport to contain all relevant information with respect to the financial products to which they relate. Although the Reports are based on information obtained from sources believed to be reliable, Market Matters does not make any representation or warranty that they are accurate, complete or up to date and Market Matters accepts no obligation to correct or update the information or opinions in the Reports. Market Matters may publish content sourced from external content providers.
If you rely on a Report, you do so at your own risk. Past performance is not an indication of future performance. Any projections are estimates only and may not be realised in the future. Except to the extent that liability under any law cannot be excluded, Market Matters disclaims liability for all loss or damage arising as a result of any opinion, advice, recommendation, representation or information expressly or impliedly published in or in relation to this report notwithstanding any error or omission including negligence.
To unsubscribe. Click Here


