Why are “professionals” worrying about the US corporate bond market?
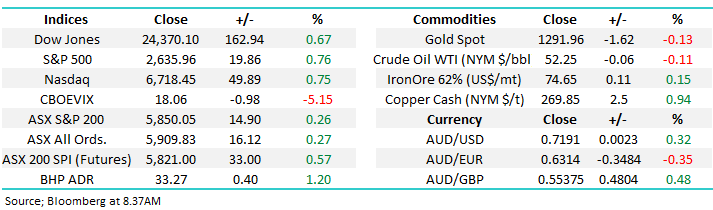
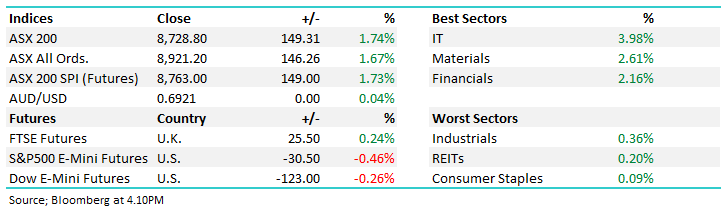
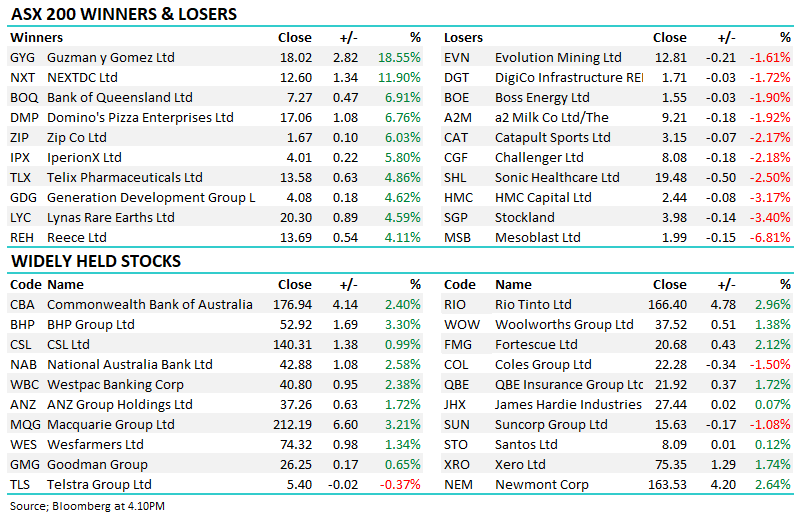
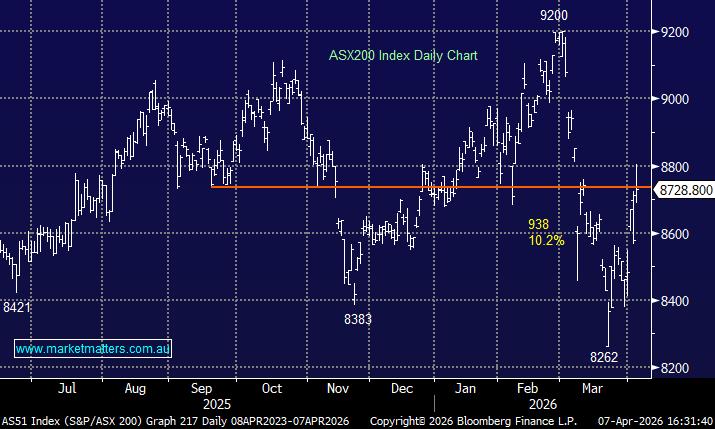
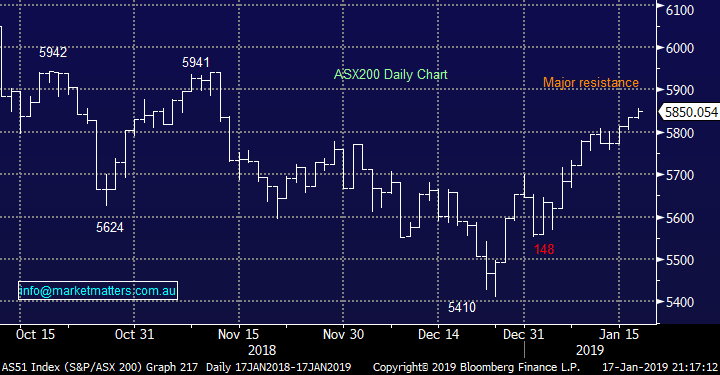
The ASX200 continued its grind higher again yesterday with the banks remaining very supportive e.g. over the last month market heavyweight CBA is up almost 6% - remember “the Australian market doesn’t (rarely) goes down without the banks”. Major resistance for our index is looming rapidly just above 5900, or around 1.5% higher.
When I see our market enjoy a basically uninterrupted 8% advance my mind starts switching to what will they chase next as FOMO kicks in – Fear of Missing Out. Any newspaper will convey in minutes how negative / cautious investors have become, the perfect environment for a short squeeze up. Fund managers clearly didn’t buy much below 5600 as the market only spent a few weeks at those depressed levels, hence it feels to me that they are searching for any sort of value to spend some of their high cash levels – many underperformed on the way down and are scarred of doing the same on the way back up! Over the past 3 months, the average Australian fund was down 9.6% according to mercer.
MM remains in “sell mode” but after selling Altium yesterday (ALU) our cash level now sits at a comfortable 20% hence we will become far more fussy moving forward.
Overnight US markets were again strong rallying ~0.75% following an article in the WSJ that the US was considering easing trade tensions with China, although a Treasury spokesman later said…“Neither Secretary Mnuchin nor Ambassador Lighthizer have made any recommendations to anyone with respect to tariffs or other parts of the negotiation with China" and adds that "this an ongoing process with the Chinese that is nowhere near completion." Clear as mud!
The SPI futures are pointing to an open up around +0.5% by the ASX200.
Today we will look at the US corporate bond market in an attempt to remove any mystic with this distant entity which is concerning so many professional investors.
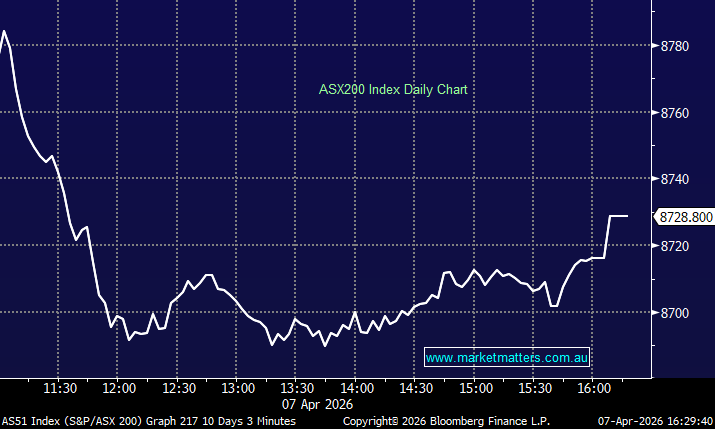
ASX200 Index Chart
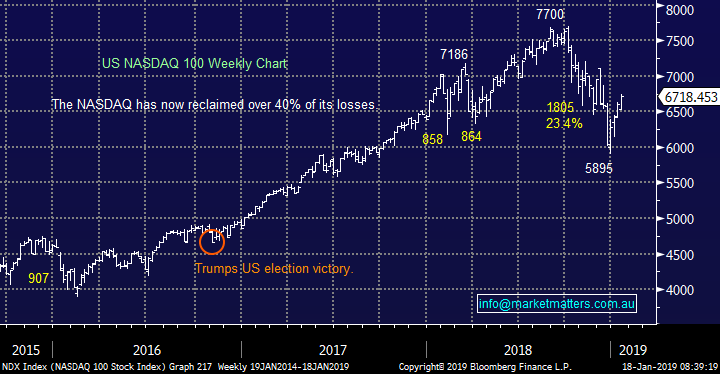
US stocks rallied on news that trade tensions with China are set to improve although following the already 14% bounce by the NASDAQ I feel this was to a certain degree expected.
Technically we are now neutral the US NASDAQ with a few weeks between 6500 and 7000 being our preferred scenario. This is the main reason we took some short term profits on Xero (ASX:XRO) and Altium (ASX:ALU) yesterday, while we still hold Appen (ASX:APEX) in our tech basket.
US NASDAQ Index Chart
The US corporate bond market, a concern?
Today is not an attempt at an economic lesson but a simple explanation / unveiling of a sector within the US market which many high profile investors are becoming increasingly concerned around – including ourselves. To put things in perspective the US corporate bond market is currently estimated to be worth around $8 trillion, making it extremely influential on stocks when hiccups do occur. The cynic in me would put much of the growth in this market down to the following:
US companies are borrowing billions to buy back their own stock given interest rates are low - so it makes sense on face value. For examples, if I’m a US corporate that can borrow at 5% and invest for a 10% return in a company I know and run, why not do it. Of course, it also supports the share prices which is connected to my bonus – it’s a win / win for all – isn’t it? The issue though is around the stability and sustainability of these debt markets. If, for whatever reasons, spreads widen, the cost of debt goes up and refinancing becomes an issue the decision to issue debt to buy back stock could come home to roost – and it is for some US Corporates.
This is undoubtedly food for thought and provides easy dinner party conversation, just the style of writing that is used to sell newspapers! However, as mentioned above, the cost of capital which is largely influenced by record low interest rates has had a big influence on this scenario. Remember, interest rates have been at record lows in the US and actually turned negative over recent years in a number of other countries.
This same record level of cheap debt accompanied by relatively lax borrowing controls has also fuelled massive takeover activity on a global scale, we’ve certainly seen it locally. The quality of this debt is worrying many with Triple B quality bonds (low grade / high risk) increasing by more than 4-fold since the GFC, sounds a little like a debt binge?
If / when the US economy slows down obviously corporate earnings will struggle, making it harder for these same companies to borrow money in the bond market, hence yields rise (and bond prices sell off). This phenomenon when it unfolds will largely end the buyback and takeover excesses, with the big question being to what effect?
US S&P500 Index Chart
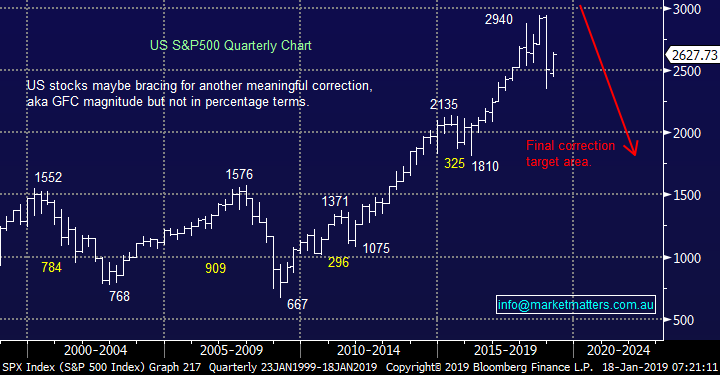
Consider the main US index, the S&P500 shown above, since the post GFC rally began in earnest in 2011 an estimated 30% gain in the S&P500 has been down to buybacks – that’s clearly market support! Hence a removal of such buybacks will in all likelihood create some air pockets on the downside for stocks – felt like that in 2018 at times?
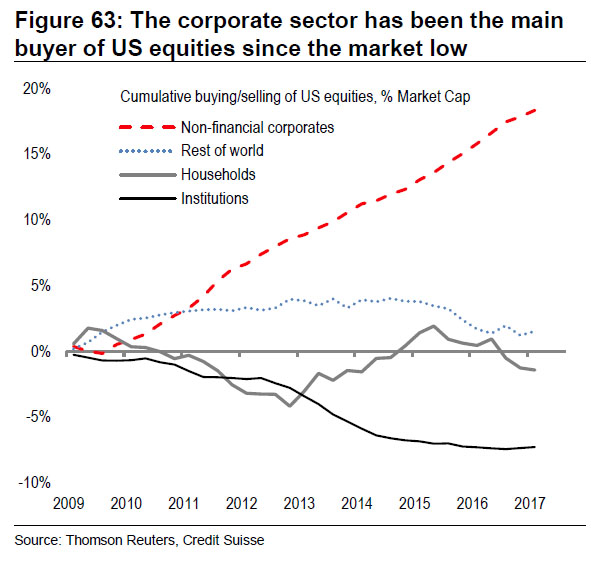
The chart below by Reuters / Credit Suisse actually points the finger at corporate America for most of the post GFC huge rally by US stocks.
When buybacks slow / end equities are likely to be in for a very tough time.
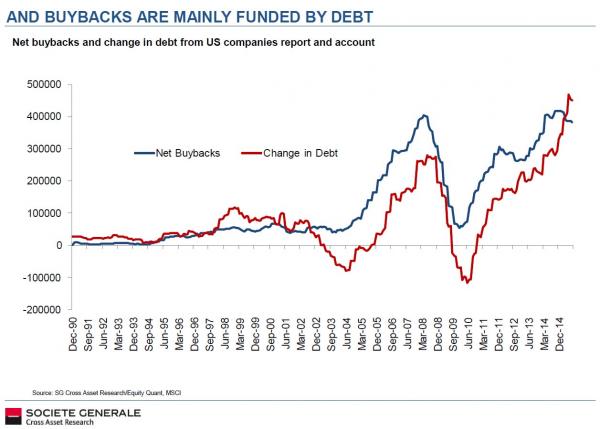
By far the main driver of buybacks is debt again the below chart (albeit it a few years old) illustrates this perfectly. Hence the very simple concern is what happens when this debt tap gets turned off as it inevitably will one day – perhaps reflect on our own property market at this stage, arguably a perfect example with the pain is unfolding before our eyes thanks to some simple tightening of standards by APRA.
Last year we saw 2 very bearish periods for stocks for totally differing reasons, initially it was caused by concerns of higher bond yields and this then become concerns around a recession in Q4. Interestingly both of these very different scenarios are likely to lead to a tightening of conditions for the corporate bond market i.e. reduced buybacks.
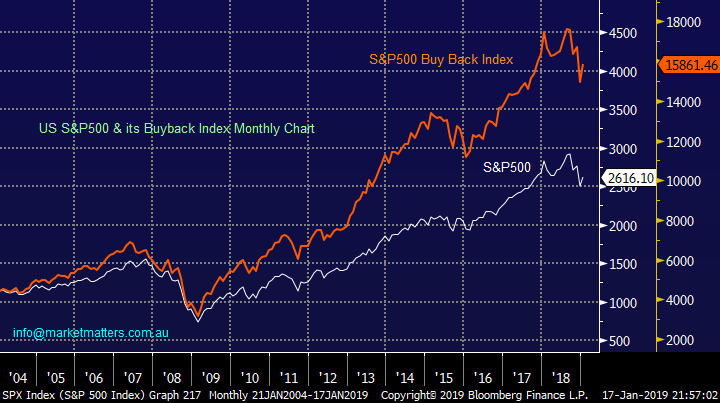
Lastly anybody doubting both the correlation and outperformance of the S&P500 buyback Index should consider the below.
We believe the buyback index is the tail wagging the US stock market at present.
US S&P500 v S&P500 Buyback Index Chart
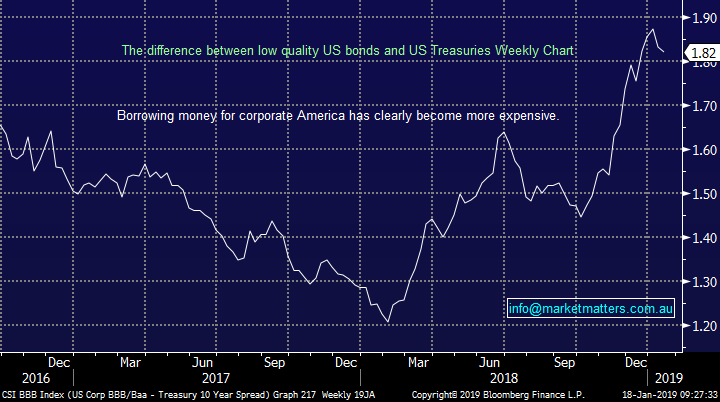
Hence we believe the key to when things again become really tricky for US stocks are corporate bond yields i.e. when they rise buybacks / takeovers will rapidly become less attractive, however relatively ingrained habits do have a tendency to continue for longer than anticipated, especially with human greed being a major factor.
The below chart shows the trend is slowly moving against stocks but its still fairly cheap for corporate America to borrow money – identifying where the uncle point is obviously the million dollar question – technical analysis on the S&P500 itself may catch it first.
US BBB/Baa Corporate bond – US Treasuries spread Chart
Conclusion
MM remains in “sell mode” but after selling Altium yesterday (ALU) our cash level now sits at a comfortable 20% hence we will become far more fussy moving forward.
MM does believe that US corporate bond spreads are the most likely catalyst to undo stocks and hence it’s a market we are watching very carefully.
Overnight Market Matters Wrap
· A volatile session overnight in the US markets, which opened lower but jumped in late trading following rumours that the US administration could be prepared to ease tariffs on China imports as part of their trade negotiations.
· All 3 key indices spiked following the unsubstantiated reports in the WSJ of potential tariff concessions- subsequently denied by a Treasury spokesperson - with the Dow at one stage up 250pts before shedding more than half those gains post the denials, to close about 160+ pts stronger (+0.7%), with the Nasdaq and S&P 500 closing over 0.7% higher.
· Commodities were mixed, with gold slightly weaker, oil flat and copper about 1% stronger. The A$ is trading slightly firmer, around US72c and the futures are pointing to small gains to end a solid week for the Australian market, which has now rallied around 7% from its December 21st low point.
· The March SPI Futures is indicating the ASX 200 to open 28 points higher towards the 5880 level this morning.
Have a great day!
James & the Market Matters Team
Disclosure
Market Matters may hold stocks mentioned in this report. Subscribers can view a full list of holdings on the website by clicking here. Positions are updated each Friday, or after the session when positions are traded.
Disclaimer
All figures contained from sources believed to be accurate. Market Matters does not make any representation of warranty as to the accuracy of the figures and disclaims any liability resulting from any inaccuracy. Prices as at 18/01/2019
Reports and other documents published on this website and email (‘Reports’) are authored by Market Matters and the reports represent the views of Market Matters. The MarketMatters Report is based on technical analysis of companies, commodities and the market in general. Technical analysis focuses on interpreting charts and other data to determine what the market sentiment about a particular financial product is, or will be. Unlike fundamental analysis, it does not involve a detailed review of the company’s financial position.
The Reports contain general, as opposed to personal, advice. That means they are prepared for multiple distributions without consideration of your investment objectives, financial situation and needs (‘Personal Circumstances’). Accordingly, any advice given is not a recommendation that a particular course of action is suitable for you and the advice is therefore not to be acted on as investment advice. You must assess whether or not any advice is appropriate for your Personal Circumstances before making any investment decisions. You can either make this assessment yourself, or if you require a personal recommendation, you can seek the assistance of a financial advisor. Market Matters or its author(s) accepts no responsibility for any losses or damages resulting from decisions made from or because of information within this publication. Investing and trading in financial products are always risky, so you should do your own research before buying or selling a financial product.
The Reports are published by Market Matters in good faith based on the facts known to it at the time of their preparation and do not purport to contain all relevant information with respect to the financial products to which they relate. Although the Reports are based on information obtained from sources believed to be reliable, Market Matters does not make any representation or warranty that they are accurate, complete or up to date and Market Matters accepts no obligation to correct or update the information or opinions in the Reports. Market Matters may publish content sourced from external content providers.
If you rely on a Report, you do so at your own risk. Past performance is not an indication of future performance. Any projections are estimates only and may not be realised in the future. Except to the extent that liability under any law cannot be excluded, Market Matters disclaims liability for all loss or damage arising as a result of any opinion, advice, recommendation, representation or information expressly or impliedly published in or in relation to this report notwithstanding any error or omission including negligence.