What a difference a few days makes (DMP, CGF, ANZ, FXL, ZML)
Before we get into the report, a slight change to report titles from today onwards, given recent feedback from subscribers. We will now include the codes of the stocks covered in the subject, allowing for better search functionality.
The ASX200 has quickly rallied 100-points / 1.8% following Fridays almost panic selling which hit the market courtesy of North Korean tensions. Yesterday local stocks managed a solid gain of 27-points / 0.5% even with a few market heavyweights like CBA, WPL, BHP and RIO closing in the red. Also, 3 of the 4 company reports we are going to look at today resulted in the respective stocks falling ~4% or more but the sentiment remained upbeat. The market has a distinct feel about it that investors are either caught short, or at least underweight equities.
Two distinct characteristics are catching our eye to support this observation:
1. When stocks report strongly such as Bendigo Bank (BEN), IOOF Holdings (IFL) and Orora (ORA) the buying continues for at least a few days following the companies positive release.
2. When a stock reports disappointing numbers and is subsequently sold off decent buying often emerges relatively quickly into the weakness e.g. Ansell (ANN), REA Group (REA) and to a lesser degree Resmed (RMD).
Clearly the timing of when fund managers allocate funds into the market depends on perceived fundamentals / respective outlook for companies but if they are sitting on excess cash their psychology is skewed towards looking for value and relatively safe buying opportunities. We are becoming more mindful of this by the day as we have a cash position of over 20% in the MM Growth Portfolio.
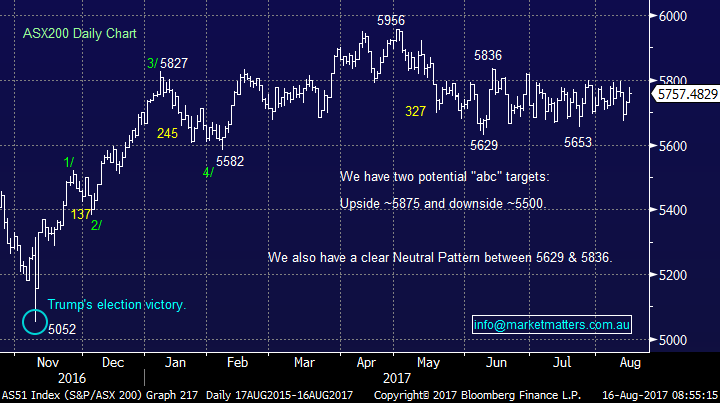
Our preference remains a pullback towards 5500 in the coming weeks / months however the currently strong banking sector, which makes up over 30% of the local market, makes our target level feel a long distance away at present.
ASX200 Daily Chart
US Stocks
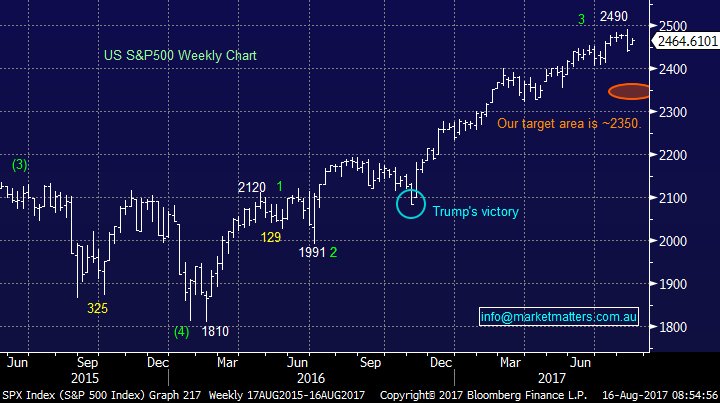
US equities had a very quiet night although the S&P futures were implying a relatively strong night on Wall Street during the Asian time zone yesterday. As we have said before, tops in equity markets often take a long time to “rollover” but bottoms tend to vanish in a flash e.g. The tops in June and Nov 2015 compared to the 3 respective spike lows in Aug 2015, Dec 2016 and July 2016.
We remain bearish US stocks targeting a correction of ~5% and sell signals are now in place.
US S&P500 Weekly Chart
1 Domino’s Pizza (DMP) $41.50
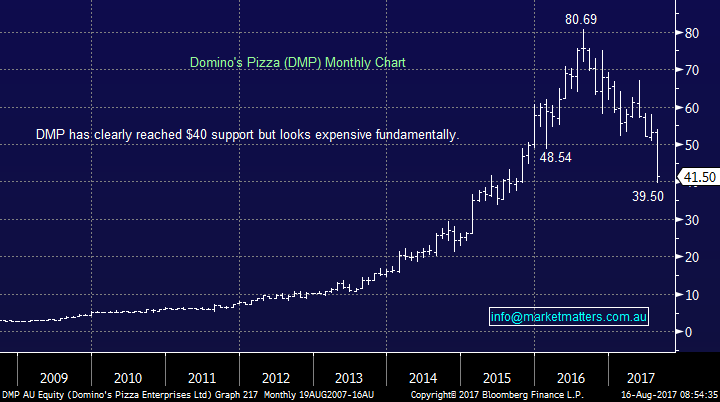
DMP delivered a shocking result and was slammed accordingly with the stock closing down a whopping -18.8%. A terrific example that just because a stock has corrected over 30% does not make it cheap. In terms of the result for FY17, it was a slight miss however the company has clearly angered investors after upgrading a few months previously. Disappointingly they then put further kindling on the fire by guiding to +20% profit growth for FY18 compared to the market expectations of greater than 30%.
The combination of the fall in terms of expected earnings plus a rerate in terms of valuation saw DMP deservedly whacked in our opinion. The stock closed at $41.50, down almost 50% over 12-months, after trading as high as $80.69 in August 2016 – what a difference a year makes!
DMP is now trading on a valuation of 24x estimated 2018 earnings, compared to say CBA on 14x. In simple terms if a stock trades on a rich valuation they MUST deliver. In terms of Domino’s, the bigger they get, the harder growth is to achieve without a certain degree of cannibalisation.
Following the recent fall and volatility, we have DMP in the too hard basket but some aggressive plays may unfold down the track.
Domino’s Pizza (DMP) Monthly Chart
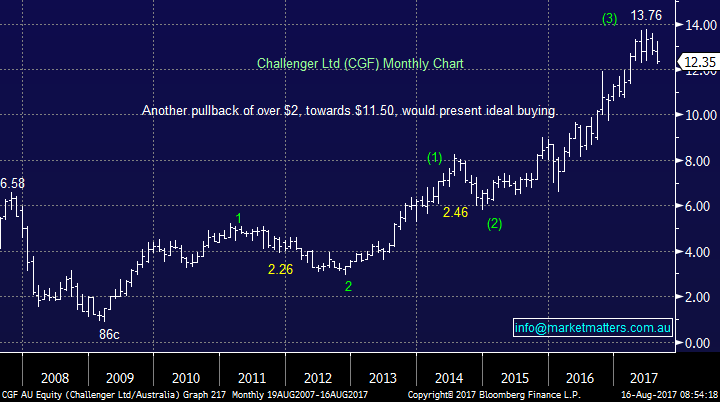
2 Challenger Ltd (CGF) $12.35
Challenger reported some solid numbers with the major matrices looking good:
1 CGF's 2017 full-year result saw the wealth manager post a net profit after tax (NPAT) of $385 million, up 6 per cent on the previous year.
2 Assets under management were up 17 per cent to $70 billion, and Challenger recorded annuity sales of $4 billion, up 20 per cent on last year – however the Q4 run rate was softer than we were expecting.
CGF also announced a "strategic relationship" with Japanese firm MS&AC Insurance Group that will be supported by a $500 million equity placement. CGF have been providing annuities in Japan since November 2016. Following the share placement, MS&AD will hold 6.3 per cent of CGF with the intention to increase its stake to 10 per cent over the next 12-months i.e. a quasi-buyback.
Yesterday’s 3.9% fall is no surprise following the stocks significant rally over the last 5-years, and furthermore the equity raise also highlights one of the weaknesses in the CGF business. Writing annuities is very capital intensive, more annuities = more capital so they will continually tap the mkt for funds to sustain growth. Weakness after a raise is most likely the best time to acquire stock in CGF – as the next raise is furthest away!
The wheels are now in motion for the companies next stage of growth and we remain buyers of CGF under $11.50.
Challenger Ltd (CGF) Monthly Chart
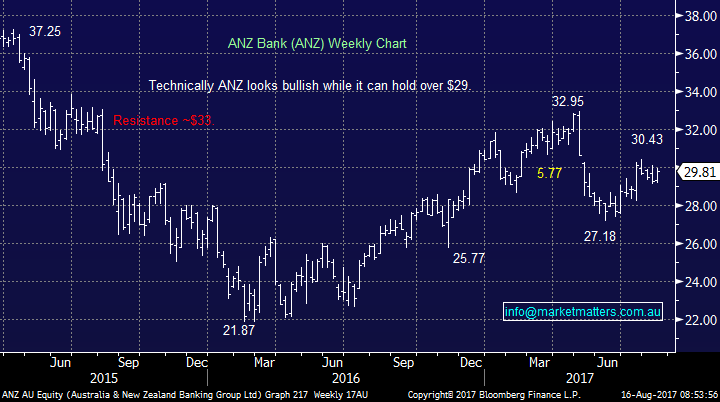
3 ANZ Bank (ANZ) $29.81
ANZ reported a third-quarter cash profit of $1.79 billion, helped by strong growth in owner-occupier mortgage lending. Improved margins and low bad debts were good news for investors. While the trading update did not show performance compared to last year, ANZ said the unaudited cash profit was a 5.3 per cent improvement on the average of the first 2 quarters of this financial year – which is a different way of doing it and makes it harder to view comparisons. Also, Chief executive Shayne Elliott said growth in residential mortgage lending was the result of a deliberate strategy and not a response to the recent regulatory intervention to slow investor lending, which has very much been in the press recently.
We like ANZ at current levels but prefer BOQ and WBC which we purchased yesterday.
ANZ Bank (ANZ) Weekly Chart
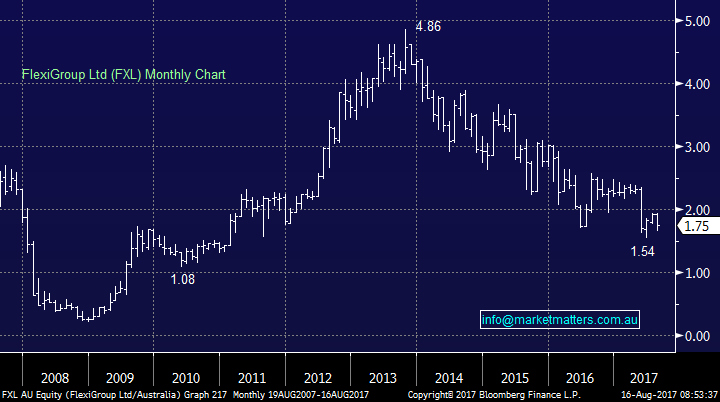
4 FlexiGroup Ltd (FXL) $1.75
FXL was hit ~5% yesterday after reporting a 2017 full-year profit drop of 4%. The leasing and credit card issuer fell the most in 6-months but notably the stock has more than halved since late 2013. While FXL’ net profit rose to $87.4m it missed analysts’ estimates of over $91m. The guidance 2018 implies tough trading conditions ahead but investment growth is expected to return the business to growth in 2019. The main issue with this business is around competition – apps , companies like ZIP Money (ZML) that are getting big traction in consumer credit will have a big impact on FXL into the future.
FXL is clearly not for the faint hearted. MM have no current interest in the stock.
FlexiGroup Ltd (FXL) Monthly Chart
Conclusion (s)
We remain buyers of any major market weakness and although our ideal target for the ASX200 is ~5500 we may slowly deploy some of our ~20% cash holding in the Growth Portfolio before this area.
We like CGF under $11.50, currently have no interest in DMP / FXL and although we like ANZ we prefer others within the banking sector.
Overnight Market Matters Wrap
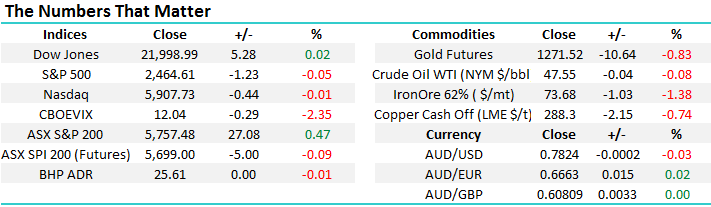
· The US closed with little change overnight, despite retail spending at its best so far this year and ahead of expectations.
· The retail sales show that the US economy is strong and, as a result, government bonds fell as investors speculate that the Fed may raise rates again this year.
· Copper and nickel were weaker on the LME, oil rose, while gold and iron ore eased after recent rallies.
· The September SPI Futures is indicating the ASX 200 to open 17 points weaker towards the 5740 level this morning.
Disclosure
Market Matters may hold stocks mentioned in this report. Subscribers can view a full list of holdings on the website by clicking here. Positions are updated each Friday.
Disclaimer
All figures contained from sources believed to be accurate. Market Matters does not make any representation of warranty as to the accuracy of the figures and disclaims any liability resulting from any inaccuracy. Prices as at 16/08/2017. 8.00AM.
Reports and other documents published on this website and email (‘Reports’) are authored by Market Matters and the reports represent the views of Market Matters. The MarketMatters Report is based on technical analysis of companies, commodities and the market in general. Technical analysis focuses on interpreting charts and other data to determine what the market sentiment about a particular financial product is, or will be. Unlike fundamental analysis, it does not involve a detailed review of the company’s financial position.
The Reports contain general, as opposed to personal, advice. That means they are prepared for multiple distributions without consideration of your investment objectives, financial situation and needs (‘Personal Circumstances’). Accordingly, any advice given is not a recommendation that a particular course of action is suitable for you and the advice is therefore not to be acted on as investment advice. You must assess whether or not any advice is appropriate for your Personal Circumstances before making any investment decisions. You can either make this assessment yourself, or if you require a personal recommendation, you can seek the assistance of a financial advisor. Market Matters or its author(s) accepts no responsibility for any losses or damages resulting from decisions made from or because of information within this publication. Investing and trading in financial products are always risky, so you should do your own research before buying or selling a financial product.
The Reports are published by Market Matters in good faith based on the facts known to it at the time of their preparation and do not purport to contain all relevant information with respect to the financial products to which they relate. Although the Reports are based on information obtained from sources believed to be reliable, Market Matters does not make any representation or warranty that they are accurate, complete or up to date and Market Matters accepts no obligation to correct or update the information or opinions in the Reports.
If you rely on a Report, you do so at your own risk. Any projections are estimates only and may not be realised in the future. Except to the extent that liability under any law cannot be excluded, Market Matters disclaims liability for all loss or damage arising as a result of any opinion, advice, recommendation, representation or information expressly or impliedly published in or in relation to this report notwithstanding any error or omission including negligence.
To unsubscribe. Click Here


