Weekly Overseas Report (IShares iBOXX, QCOM US, 9984 JP,C US,NKE US, MRK US, UNH US)
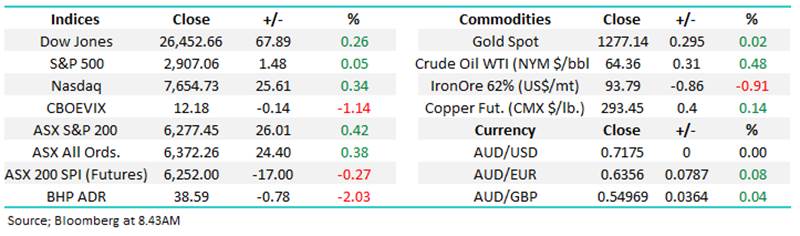
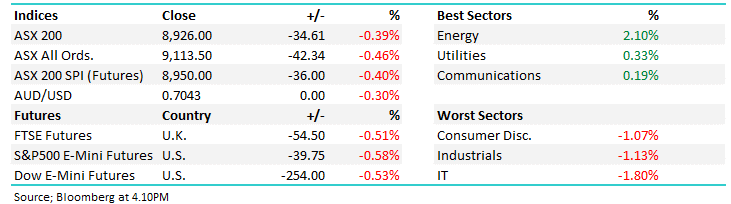
The ASX200 was stronger than expected yesterday rallying +0.4%, a solid performance considering the market opened well in the red i.e. the SPI futures rallied 56-points / 0.9% from their early lows. The gains were fairly hard to pinpoint both during the day and on the close but on reflection it was the same old 2019 story, a lack of selling which led to only 32% of the index closing in the red. On a sector level the influential Banks and Healthcare stocks were strong while the Energy sector was the main index drag closing down -0.8% by the close at 4pm.
The latest minutes from the RBA caught our attention yesterday and we felt they paved the way for at least one interest rate cut in 2019, the futures market agreed with our feeling as they priced in a rate cut before Melbourne Cup Day as basically a given. When Westpac chief economist Bill Evans suggested the RBA would cut twice this year in February the ASX200 took off and yesterday’s comments again appeared to underpin the market, there are no sellers when rate cuts are looming – at least not yet.
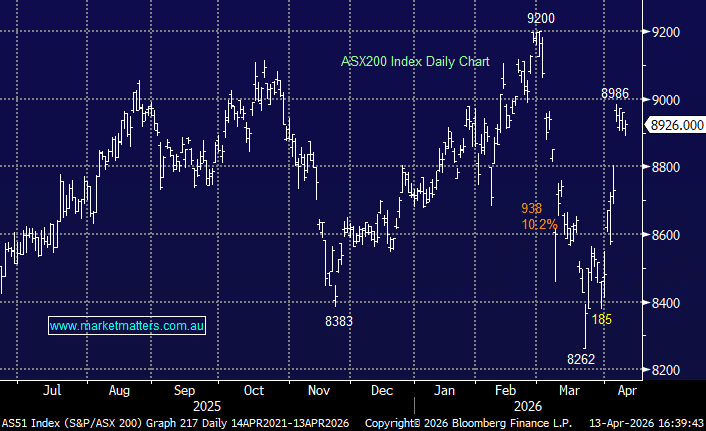
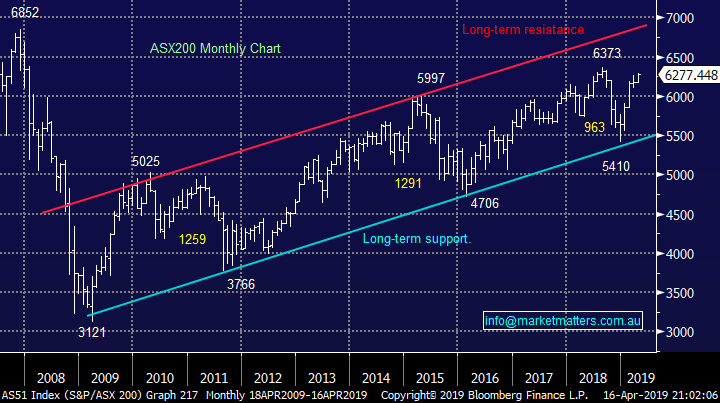
The ASX200 continues to grind higher but our 6000-6300 trading range for Q2 of 2019 remains our preferred scenario.
Overnight the US indices closed marginally higher but the SPI is calling the ASX200 down ~10-points early with BHP trading down 2% in the US likely to weigh on the index..
Today we are going to look at 6 overseas stocks that are catching our eye this week from both ends of the spectrum i.e. winners and losers.
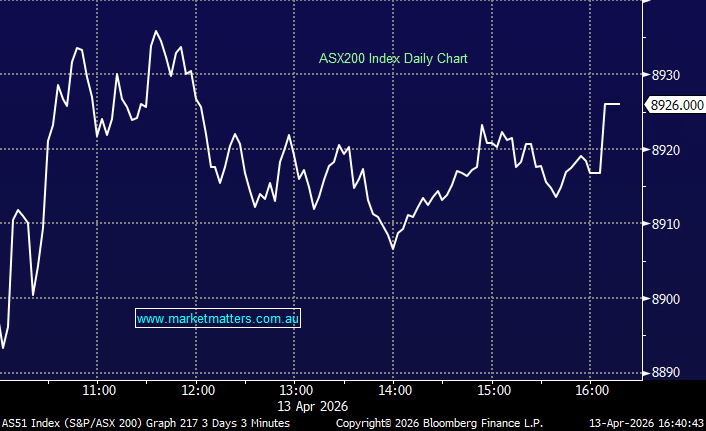
ASX200 Chart
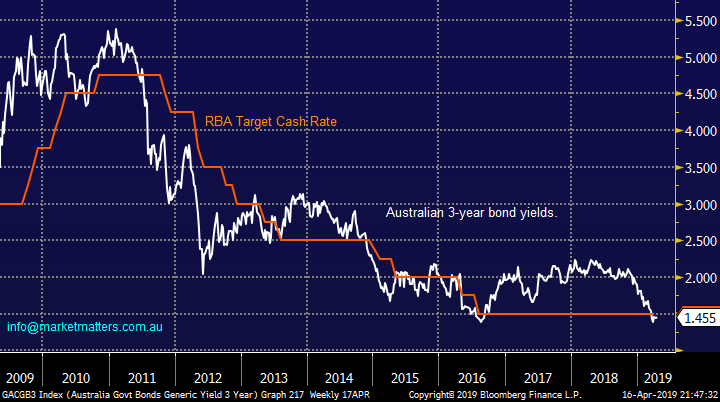
Yesterday we saw Australian 3-year bond yields again turn lower following the RBA minutes and the chart below shows they again closed below the RBA cash rate, usually a precursor for rate cuts.
Previously we had thought the RBA was keen to hold rates at 1.5%, their lowest in history, but yesterdays minutes felt like it was delivering a fresh message where they were hinting strongly that rate cuts were well and truly on the table.
Following the RBA’s comments MM expects one rate cut in 2019 and potentially another in 2020.
Australian 3-year bond yields v RBA Target Cash Rate Chart
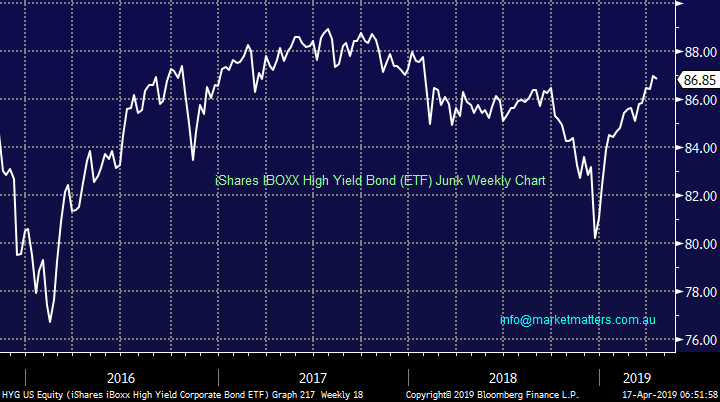
The junk bond market remains strong as the ETF below illustrates, we believe this remains a great indicator to the level of “cheap money” which has fuelled much of the global equities rally in 2019.
To put things into perspective there is now over $US10 trillion debt providing negative yield – investors would be better off with the money under the bed!
No surprise, MM believes global bond yields look set to remain low into 2020.
iShares iBOXX High Yield ETF Chart
Six standout overseas stocks from the last week.
Today we have selected 6 very different international stocks that have caught our eye over the last week.
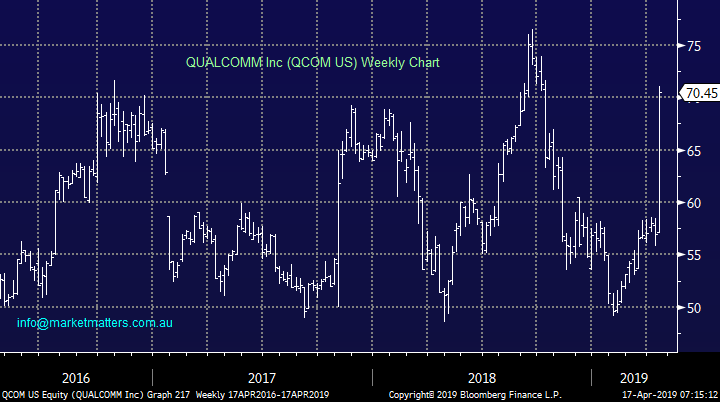
1 QUALCOMM Inc (QCOM US) $US70.45
QUALCOMM has surged +11.2% as the manufacturer of digital wireless equipment looks to diversify its business away from smartphones. The stock surge after announcing a new AI chipset, the Cloud AI 100, for cloud data centre servers. The company boldly claims that the chip will be over 50 times more powerful than its top-end Snapdragon 855 mobile chipset, and will be optimized for making decisions based on voice and image recognition – sounds extremely impressive.
Technically the stocks been a laggard in the IT space over the last decade and remains range bound between $US75 and $US50 over the last 3-years.
MM is neutral QCOM until the companies “claims” become verified.
QUALCOMM Inc (QCOM US) Chart
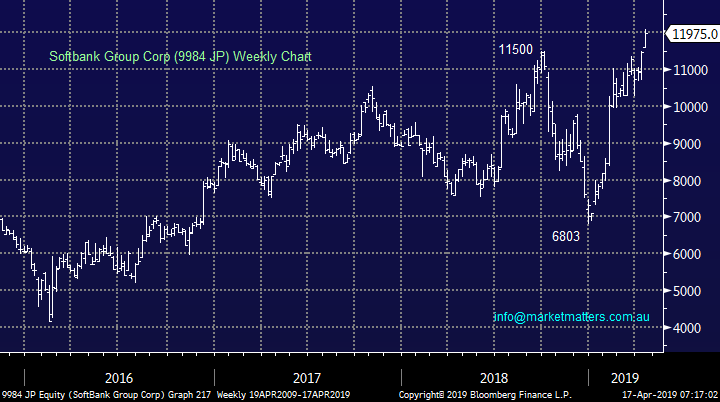
2 Softbank Group (9984 JP) JPY11,975.
Softbank raised over $US23bn in December 2018 for its telecom unit and it hasn’t looked back since. The Japanese telecommunications business has broken out to fresh multi-year highs and is enjoying the added tailwind of an extremely strong Nikkei.
Technically investors can buy Softbank and use stops below JPY11,250.
MM likes Softbank at today’s level.
Softbank Group (9984 JP) Chart
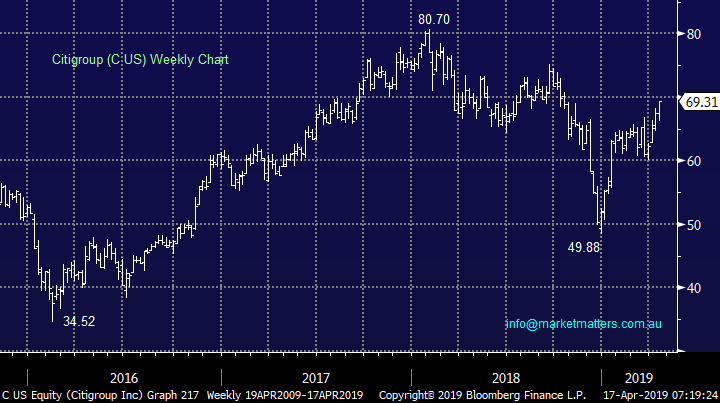
3 Citigroup (C US) $US69.31
Citigroup has rallied over 6% over the last 5-days with the release of its first quarter 2019 earnings the main catalyst for the gains. They reported earnings of $US4.7bn, up 11% from a year ago in a report that looked solid across all areas.
Technically Citigroup looks great with stops below $US64.50.
MM likes Citigroup at current levels.
Citigroup (C US) Chart
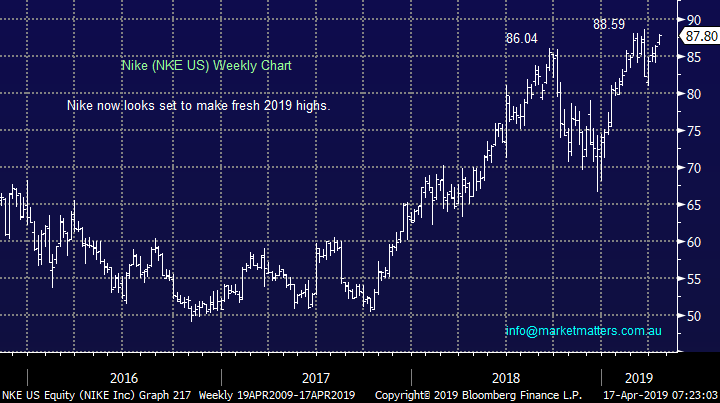
4 Nike (NKE US) $US87.80
Nike has recovered after a tough March, the market reacted negatively to the sports attire manufacturers latest earnings report which showed steady global growth with sales up 11% but revenue growth in North America slowed. Interestingly growth is fairly even across apparel and footwear with the later edging the race in recent months.
Technically Nike looks likely to make fresh 2019 highs but the risk / reward is not compelling.
MM is neutral Nike.
Nike (NKE US) Chart
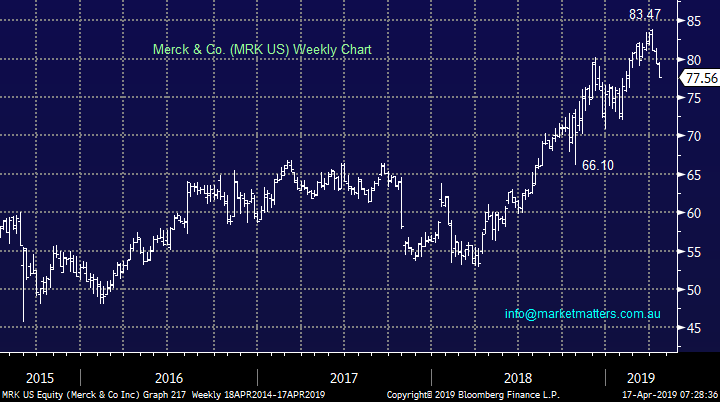
5 Merck & Co. (MRK US) $US77.56
Global health business Merck has slipped 4% over the last 5-days although we should not forget its stellar performance over the last 12-months. Cancer immunotherapy antibody Keytruda is the product which should fuel Merck's growth into the future but the stocks feels like it simply needs a rest.
Technically the stock looks likely to fall another 10% short-term.
MM is not keen on Merck at this point in time.
Merck & Co (MRK US) Chart
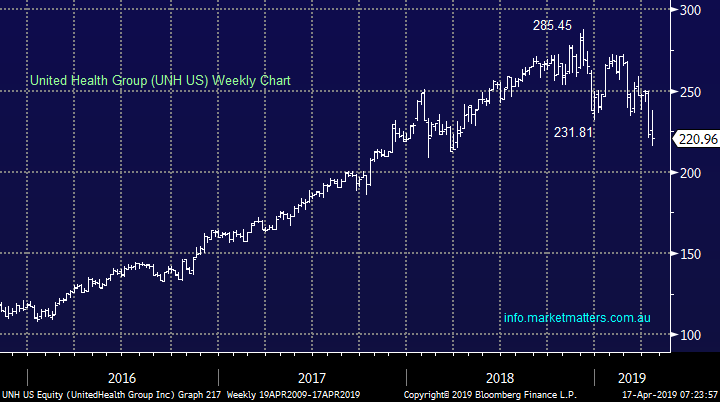
6 United Health Group (UNH US) $US220.96
United Health (UNH US) has tumbled over 11% in just 5-days and has not been helped by Q1 2019 earnings which saw the stock fall 4% last night alone. Investors clearly focused on the future as the surface 9% increase in revenue and adjusted earnings per share growing 23% looked solid plus they have raised expectations for the whole of 2019.
Technically the stocks feels vulnerable to an accelerated decline.
MM has no interest in UNH at this point in time.
United Health Group (UNH US) Chart
Conclusion
Of the 6 stocks we looked at today Citigroup and Softbank are the most appealing.
Global Indices
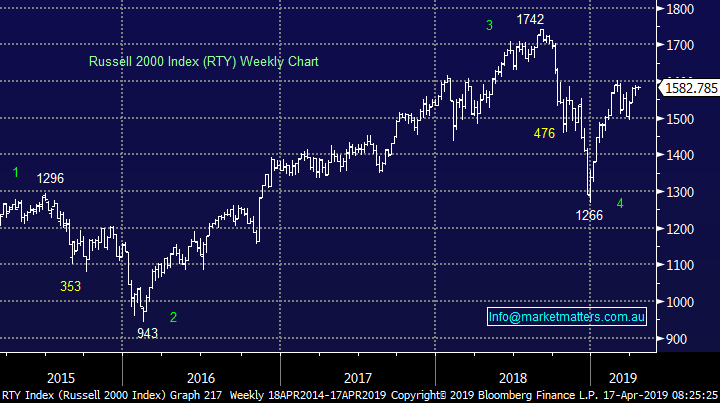
US stocks were again very quiet last night as Easter gets ever closer. Medium-term we still think the NASDAQ has another ~5% upside but a pullback feels overdue – importantly our 8000 target for the NASDAQ is only a good week or two away in today’s market!
With both the S&P500 and tech based NASDAQ recently reaching fresh 2019 highs we have turned mildly neutral / negative US stocks.
US Russell 2000 Chart
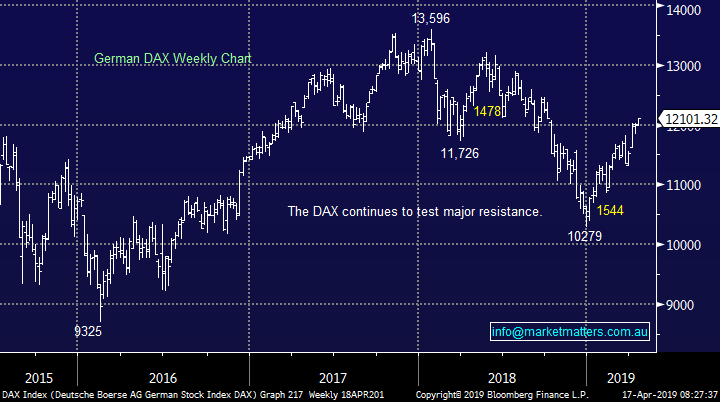
No change with European indices with BREXIT gaining an extension it’s again become yesterday’s “fish and chip paper”, we remain cautious or even slightly bearish in this region.
German DAX Chart
Overnight Market Matters Wrap
· Wall St closed slightly firmer overnight, as the quarterly earnings season continued, with solid results from Black Rock, Bank of America, and healthcare giant Johnson and Johnson. Both Netflix and IBM reported after market, with Netflix beating Q1 expectations, but providing slightly weaker Q2 guidance.
· Interest rates continued their recent selloff, with ten year bonds nudging 2.6% for the first time in a month - from a low point of 2.35% in late March - despite a 0.1% fall in US Industrial Production reported for March.
· Commodities were generally weaker, with gold about 1% lower at US$1280/oz, while oil went against the trend, with the Brent crude price close to a 6 month high of US$72/bbl.
· The June SPI Futures is indicating the ASX 200 to open 7 points lower testing the 6270 level
Have a great day!
James & the Market Matters Team
Disclosure
Market Matters may hold stocks mentioned in this report. Subscribers can view a full list of holdings on the website by clicking here. Positions are updated each Friday, or after the session when positions are traded.
Disclaimer
All figures contained from sources believed to be accurate. Market Matters does not make any representation of warranty as to the accuracy of the figures and disclaims any liability resulting from any inaccuracy. Prices as at 17/04/2019
Reports and other documents published on this website and email (‘Reports’) are authored by Market Matters and the reports represent the views of Market Matters. The MarketMatters Report is based on technical analysis of companies, commodities and the market in general. Technical analysis focuses on interpreting charts and other data to determine what the market sentiment about a particular financial product is, or will be. Unlike fundamental analysis, it does not involve a detailed review of the company’s financial position.
The Reports contain general, as opposed to personal, advice. That means they are prepared for multiple distributions without consideration of your investment objectives, financial situation and needs (‘Personal Circumstances’). Accordingly, any advice given is not a recommendation that a particular course of action is suitable for you and the advice is therefore not to be acted on as investment advice. You must assess whether or not any advice is appropriate for your Personal Circumstances before making any investment decisions. You can either make this assessment yourself, or if you require a personal recommendation, you can seek the assistance of a financial advisor. Market Matters or its author(s) accepts no responsibility for any losses or damages resulting from decisions made from or because of information within this publication. Investing and trading in financial products are always risky, so you should do your own research before buying or selling a financial product.
The Reports are published by Market Matters in good faith based on the facts known to it at the time of their preparation and do not purport to contain all relevant information with respect to the financial products to which they relate. Although the Reports are based on information obtained from sources believed to be reliable, Market Matters does not make any representation or warranty that they are accurate, complete or up to date and Market Matters accepts no obligation to correct or update the information or opinions in the Reports. Market Matters may publish content sourced from external content providers.
If you rely on a Report, you do so at your own risk. Past performance is not an indication of future performance. Any projections are estimates only and may not be realised in the future. Except to the extent that liability under any law cannot be excluded, Market Matters disclaims liability for all loss or damage arising as a result of any opinion, advice, recommendation, representation or information expressly or impliedly published in or in relation to this report not withstanding any error or omission including negligence.