Warning Lights Are Flashing to MM with Stocks
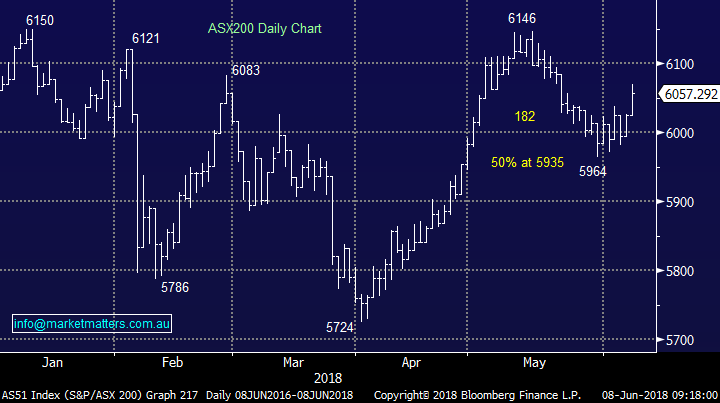
The ASX200 enjoyed another strong performance yesterday rallying +0.53%, managing to close above 6050 in the process – we’re now only 1.5% below a fresh decade high. The strength was encouragingly broader based with gains in the banks and resources, a nice change. It presently “feels” a big ask to break January’s high, but as we saw in April a rally can unfold when least expected.
• Unfortunately, short-term aside, we believe the next 10% move for the ASX200 is down and today we will look at a few of our rising concerns globally.
Some interesting statistics / seasonality came to my attention over the last 24-hours with regard to US stocks, not as strongly correlated to our own over recent times, but still ignored at one’s peril:
1. Over the last 20-years the average return for the US S&P500 over June is -0.5% yet this year it was up almost 2.5% over the first 4-trading days.
2. However, following early June gains of this magnitude, the average return for the rest of June is meaningfullypoor, down over -3%.
3. Also, for the pedantic reader the June high usually kicks in mid-month.
Technically the ASX200 should now hold above the cluster of swing highs around 6020, a failure to do so will question our bullish short-term outlook for the market.
• MM remains mildly bullish ideally targeting ~6250 for the ASX200 BUT we remain in “sell mode”.
Overnight, global markets were quiet on the surface with the tech sector the noticeable weak link. The futures market is calling our market to open down ~10-points, giving back around a 1/3 of yesterday’s gains.
As touched on above, today’s report is going to look at some of our concerns for stocks rolling through 2018 / 9, we must remember successful investing should always consider the risk / reward profile on offer.
ASX200 Chart
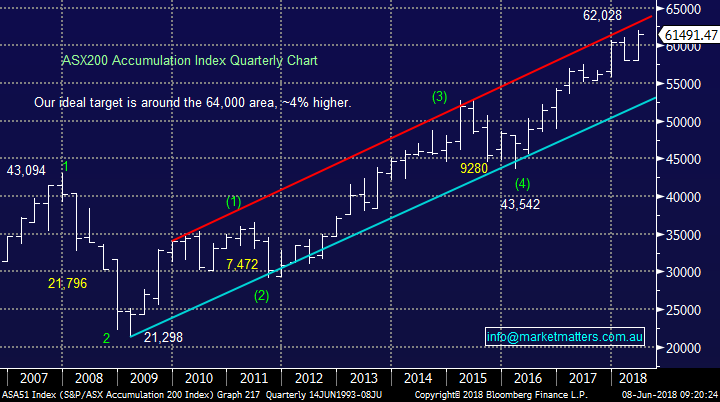
In the bigger picture the ASX200 Accumulation Index, which we’ve watched carefully throughout 2018, is now ~4% from our ideal target. Hence when we consider the seasonal influences and long-term targets we’ve held throughout 2018, our expected actions moving forward should be no surprise:
• MM anticipates increasing our cash levels this June.
We’ve had this target area in place since early 2016 when MM aggressively went long stocks – now it’s basically satisfied our view over 2-years later, we simply cannot ignore the potential risks.
ASX200 Accumulation Index Chart
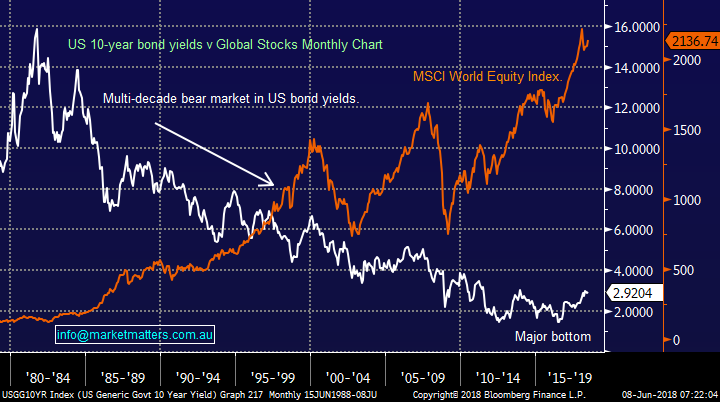
1 Rising bond yields v asset prices
Bond yields have been in a bear market since the 1980’s, helping propel asset prices including housing and stocks significantly higher. We believe interest rates have bottomed, the panic like negative bond yields in the likes of Japan and Europe was a perfect example of the “elastic band” theory with investing i.e. things usually go too far – why, oh why, would somebody lend a country money for a guaranteed negative return!
When interest rates rise, the relative attractiveness of stocks diminishes e.g. if a stock yields 5% while the bank pays 10%on a deposit the stock must rally 5% for an investor to simply breakeven.
• Whether equity markets correct 10, or 20%, we are confident that the January / February sharp sell off triggered by interest rate concerns will be repeated again.
US 10-year bond yield v MSCI World stock index Chart
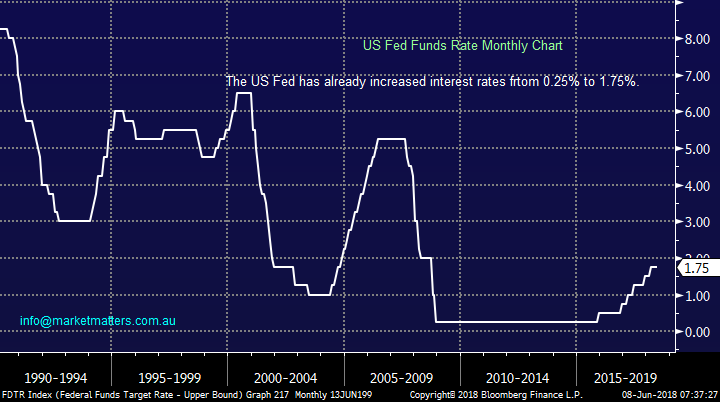
2 Central Banks are balancing on the high wire
The US fed has already hiked interest rates from 0.25% to 1.75%, a 7-fold increase in official interest rates. Central banks are trying to engineer the normalisation of interest rates - investors have to think GFC to acknowledge they don’t always get it right.
Australia through a combination of policy and the Hayne royal commission has boxed itself into a corner, housing prices arguably the corner stay of our economy are falling making it extremely hard for the RBA to hike rates but they are too low and this conundrum will probably become an issue down the track.
• We believe there will at least be periods moving forward when stock markets lose confidence with central banks, leading to falls in stocks and increased volatility.
US Fed Funds Rate Chart
3 What goes up often comes down
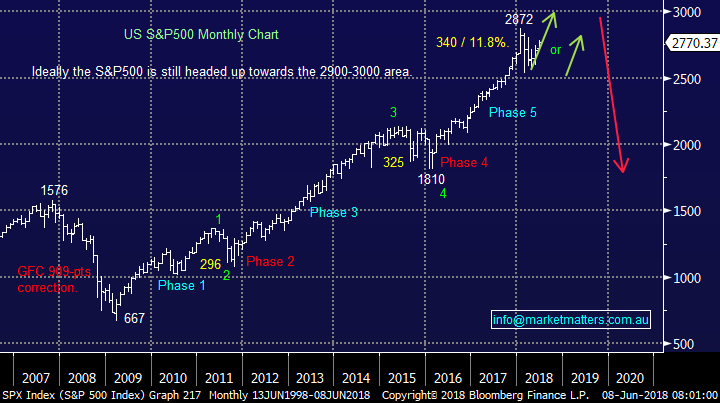
The US stock market in particular has been on a tear since the GFC rallying over 300% at its best and when we look at the chart below another pullback of the same magnitude as the GFC (900-points) would amazingly now look like a bump in the road, just taking us back to the lows of 2016.
Undoubtedly, stocks have embraced positive news like Trump’s tax cuts and deregulation of the financial sector while shrugging off huge potential risks like a trade war with China. We often say a market that ignores bad news is a bullish market and this has undeniably been the case since Trumps election victory.
All certainly feels ok for now with the NASDAQ making fresh all-time highs yesterday, but things can and do change. Our tweaked topside targets off the last few years are now only ~4% away for US stocks, it will be interesting to see if the broad market can muster the strength to match the tech-based NASDAQ but like the local market we believe US stocks are now living on borrowed time.
• MM is “just” bullish very short-term but we believe the next 10% move, and very probably more, is down.
US S&P500 Chart
4 Europe’s wobbling & a trade war is on the table
If we are correct and a change to market sentiment is around the corner, there’s likely to be a catalyst to unleash the selling. There are certainly plenty of potential issues around like rising interest rates, a US-China trade war, the existence of the EU being under threat plus of course the old chestnut North Korea.
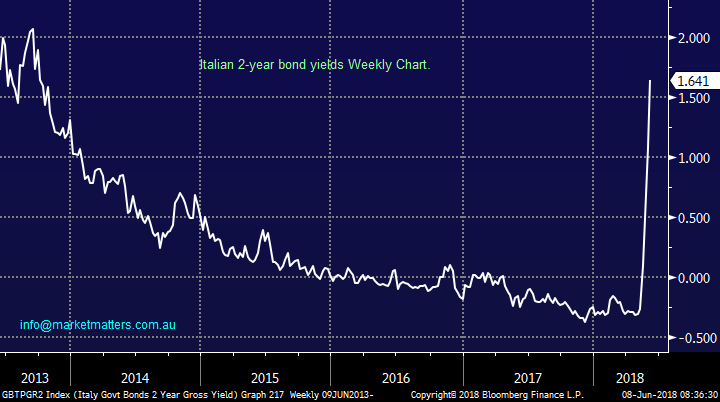
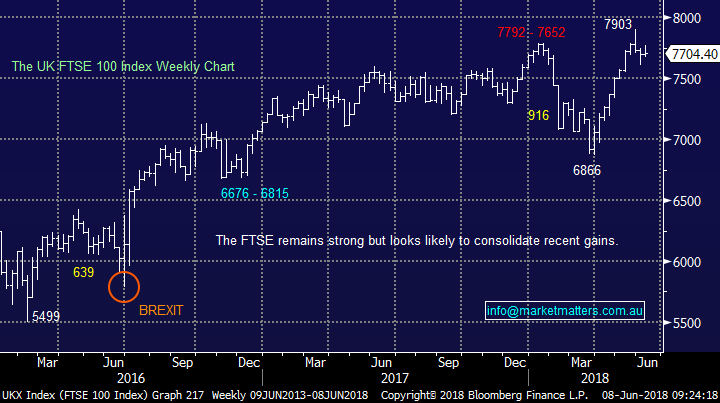
When we look at Europe, the story is similar to the US, the very existence of the EU is under threat but European stocks remain elevated – the UK FTSE made and all-time high in May and the German DAX is only a few good days below its equivalent – the Italian scare was forgotten almost overnight!
Unfortunately, we don’t have a crystal ball but we can weigh up risk / reward and value, which lead us to be cautious at best and definite sellers into strength. The recent amazing and unprecedented rally in Italian bond yield should in our opinion be a huge warning for any complacent investors out there.
• We believe the unexpected may become the norm in 2018/9 – we are sellers of strength in equities.
Italian 2-year bond yields Chart
UK FTSE Chart
Conclusion (s)
No change, we remain short-term positive stocks but sellers into strength as we believe a ~20% correction for stocks is looming on the horizon.
The only “buys” that we envisage moving forward are either negative facing ETF’s, short-term plays like Fortescue (FMG) and / or stocks we believe will outperform during a significant pullback e.g. ugly duckling Telstra (TLS).
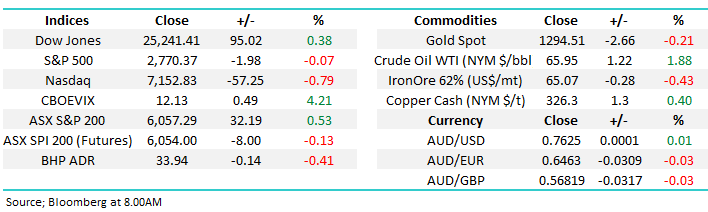
Overnight Market Matters Wrap
· The US closed mixed overnight, with the tech heavy Nasdaq 100 being the laggard against its peers.
· Oil also rallied again, with crude oil currently at US$65.95/bbl. as expectations rose that OPEC would not lift production at their next meeting to offset weaker Venezuelan output.
· Copper also had another strong night, jumping another 1.5% on fears of a looming strike at BHP’s large Escondida mine, however BHP is expected to open lower following its US session ending down an equivalent of 0.41% from Australia’s previous close.
· The June SPI Futures is indicating the ASX 200 to open marginally lower, towards the 6050 level this morning.
Have a great day!
James & the Market Matters Team
Disclosure
Market Matters may hold stocks mentioned in this report. Subscribers can view a full list of holdings on the website by clicking here. Positions are updated each Friday, or after the session when positions are traded.
Disclaimer
All figures contained from sources believed to be accurate. Market Matters does not make any representation of warranty as to the accuracy of the figures and disclaims any liability resulting from any inaccuracy. Prices as at 08/06/2018.
Reports and other documents published on this website and email (‘Reports’) are authored by Market Matters and the reports represent the views of Market Matters. The MarketMatters Report is based on technical analysis of companies, commodities and the market in general. Technical analysis focuses on interpreting charts and other data to determine what the market sentiment about a particular financial product is, or will be. Unlike fundamental analysis, it does not involve a detailed review of the company’s financial position.
The Reports contain general, as opposed to personal, advice. That means they are prepared for multiple distributions without consideration of your investment objectives, financial situation and needs (‘Personal Circumstances’). Accordingly, any advice given is not a recommendation that a particular course of action is suitable for you and the advice is therefore not to be acted on as investment advice. You must assess whether or not any advice is appropriate for your Personal Circumstances before making any investment decisions. You can either make this assessment yourself, or if you require a personal recommendation, you can seek the assistance of a financial advisor. Market Matters or its author(s) accepts no responsibility for any losses or damages resulting from decisions made from or because of information within this publication. Investing and trading in financial products are always risky, so you should do your own research before buying or selling a financial product.
The Reports are published by Market Matters in good faith based on the facts known to it at the time of their preparation and do not purport to contain all relevant information with respect to the financial products to which they relate. Although the Reports are based on information obtained from sources believed to be reliable, Market Matters does not make any representation or warranty that they are accurate, complete or up to date and Market Matters accepts no obligation to correct or update the information or opinions in the Reports.
If you rely on a Report, you do so at your own risk. Any projections are estimates only and may not be realised in the future. Except to the extent that liability under any law cannot be excluded, Market Matters disclaims liability for all loss or damage arising as a result of any opinion, advice, recommendation, representation or information expressly or impliedly published in or in relation to this report notwithstanding any error or omission including negligence.
To unsubscribe. Click Here