Volatility soars led by Telstra and the Dow (TLS, COH, QBE, WES)
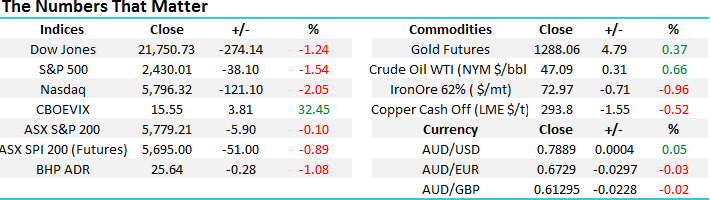
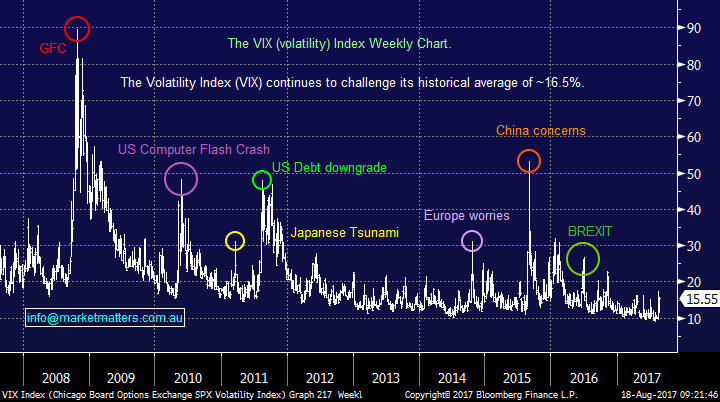
The ASX200 might be ending its 13th week in the tight band between 5629 and 5836 but there’s certainly been significant individual stock moves during this time. Overnight the Dow plunged 274-poinits while the “Fear Index” VIX rallied over 30% in just the one session. Volatility is back with a bang; the US market has now swung over 1% in 3 out of the last 6 days following 3 weeks of trading in a tight range of only 0.3%.
This time last week the ASX200 was trading 100-points lower at 5674, today its looking to open down ~50-points, still well above last Fridays low. Conversely the US S&P500 closed this morning at 5-week lows. We continue to believe that US stocks are in the process of correcting at least 5% whereas the local market is proving harder to pinpoint but at least individual stocks are throwing up some great opportunities for those that remain patient.
Yesterday we bought Telstra at $3.85 and today our initial purchase level for 5% of the portfolio into Challenger under $11.50 feels a strong possibility.
Today we will again look at 4 big movers from reporting season yesterday, leading with Telstra (TLS) of course, as we continue to search for buying opportunities with our 16% cash position in the MM Growth Portfolio.
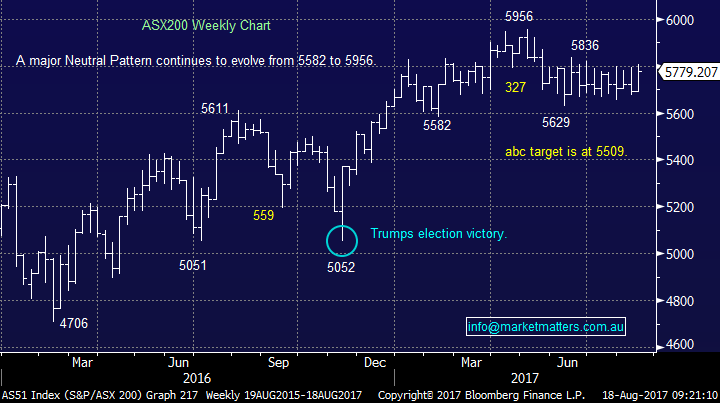
ASX200 Weekly Chart
US Stocks
US equities plunged overnight to a 5-week low as rumours surrounding Donald Trump’s presidency gained momentum – surely it was just a matter of when? It will be very interesting to see if the damage will continue or stocks bounce as they did following the North Korea sabre rattling.
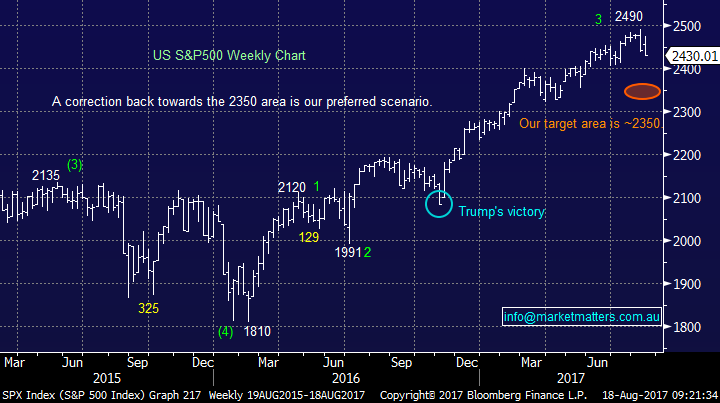
We remain bearish US stocks targeting a correction of ~5% as sell signals continue to emerge.
US S&P500 Weekly Chart
US “Fear Index” VIX Weekly Chart
1 Telstra (TLS) $3.87
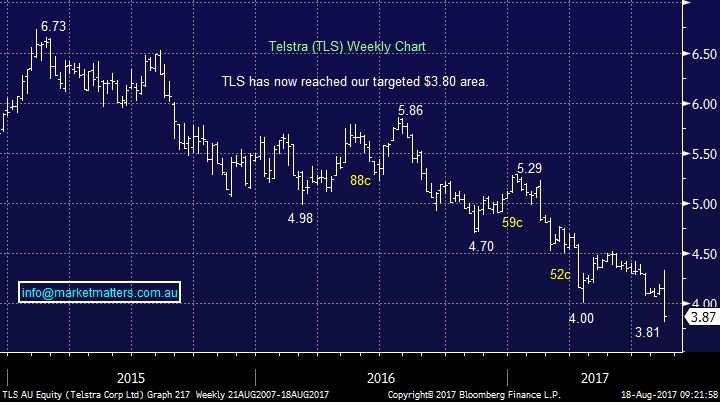
TLS was savaged yesterday as the company signalled their intention to slash the dividend to 22c for FY18. The cut to its sacred dividend was broadly expected due to the estimated $2-3bn fall in earnings courtesy of the NBN - Note they are still paying a 15.5c fully franked dividend later this month. However, while the cut was always inevitable the reality and magnitude certainly rattled the market yesterday. TLS will be yielding what we believe is now a relatively sustainable 5.7% fully franked dividend commencing next financial year, basis $3.87. If the dividend was slashed another 20% to 18c then we need to buy TLS ~$3.60 to receive a 5% fully franked yield, this is our obvious level to average yesterday’s purchase.
MM has been targeting TLS as a buy around $3.80 for many months and as the panic unfolded yesterday we allocated 5% of our Growth Portfolio into TLS at $3.85. We will consider an additional 2.5% purchase of TLS if the aggressive selling continues ~$3.60.
Telstra (TLS) Weekly Chart
2 QBE Insurance (QBE) $11.17
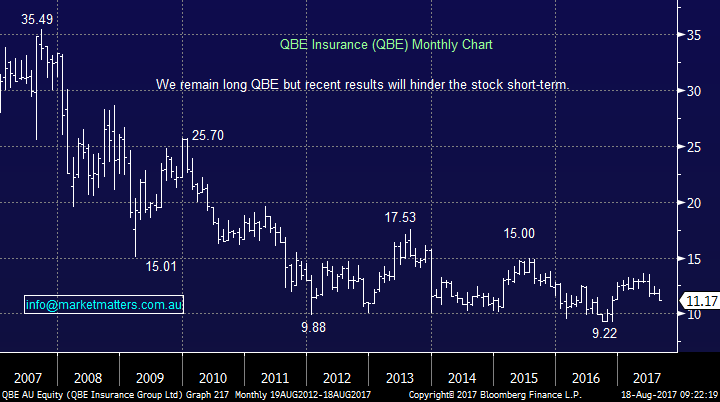
QBE was hammered 7% yesterday to fresh 2017 lows following yet another earnings miss, this time by ~4%. QBE management are arguably the markets main culprit for disappointment and now they simply need to turn their margins around quickly, or major downgrades will follow. We are already seeing analysts this morning calling the stock “too hard” which won’t help short-term.
While QBE are positioned nicely for a rising interest rate environment a lot of these gains will be offset if the $US continues to decline. Yesterday’s weakness felt like the market was long QBE for the interest rate / $US exposure and the company’s poor result was enough for a run to the exit door.
We see value in QBE around this $11 area but are not looking to average our position.
QBE Insurance (QBE) Monthly Chart
3 Cochlear (COH) $153.02
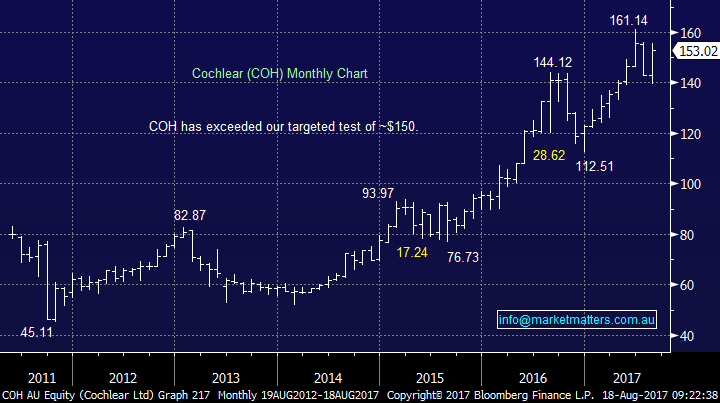
Yesterday COH soared 7.2% in a relatively weak market following the announcement of an 18% increase of net profit and a 17% lift to its dividend. The hearing implant maker pleasantly surprised investors with its performance, almost the complete opposite to QBE.
From a risk / reward perspective we are neutral COH but technically it looks poised for further gains towards its all-time ~$161 high.
Cochlear (COH) Monthly Chart
4 Wesfarmers (WES) $41.87
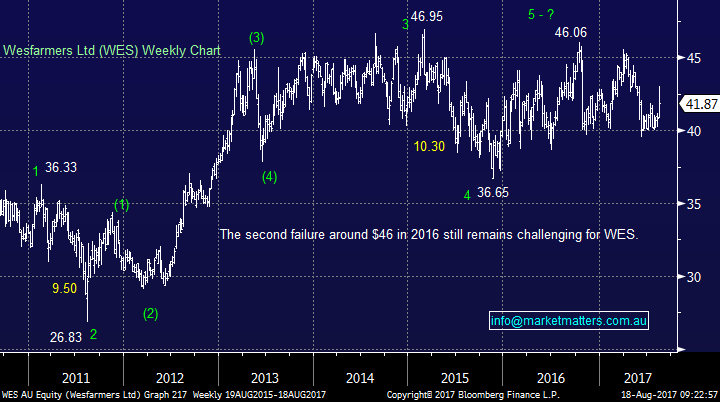
WES almost had a roller-coaster ride yesterday initially tallying ~3% following its result before closing basically unchanged as sellers clearly took advantage of the early strength. WES announced a net profit of $2,873m which was in line with market forecasts not surprisingly helped by a strong recovery from its resources divisions.
Following these numbers, we are neutral WES at current levels.
Wesfarmers (WES) Weekly Chart
Conclusion (s)
We remain buyers of any major market weakness and although our ideal target for the ASX200 remains ~5500 we may slowly deploy some of our ~16% cash holding in the Growth Portfolio before this area e.g. CGF around $11.50.
We like TLS around $3.80 and especially down at $3.60 where we are likely to increase our holding.
We are neutral QBE, WES and COH at current levels.
**Watch for alerts**
Disclosure
Market Matters may hold stocks mentioned in this report. Subscribers can view a full list of holdings on the website by clicking here. Positions are updated each Friday.
Disclaimer
All figures contained from sources believed to be accurate. Market Matters does not make any representation of warranty as to the accuracy of the figures and disclaims any liability resulting from any inaccuracy. Prices as at 17/08/2017. 5.00PM.
Reports and other documents published on this website and email (‘Reports’) are authored by Market Matters and the reports represent the views of Market Matters. The MarketMatters Report is based on technical analysis of companies, commodities and the market in general. Technical analysis focuses on interpreting charts and other data to determine what the market sentiment about a particular financial product is, or will be. Unlike fundamental analysis, it does not involve a detailed review of the company’s financial position.
The Reports contain general, as opposed to personal, advice. That means they are prepared for multiple distributions without consideration of your investment objectives, financial situation and needs (‘Personal Circumstances’). Accordingly, any advice given is not a recommendation that a particular course of action is suitable for you and the advice is therefore not to be acted on as investment advice. You must assess whether or not any advice is appropriate for your Personal Circumstances before making any investment decisions. You can either make this assessment yourself, or if you require a personal recommendation, you can seek the assistance of a financial advisor. Market Matters or its author(s) accepts no responsibility for any losses or damages resulting from decisions made from or because of information within this publication. Investing and trading in financial products are always risky, so you should do your own research before buying or selling a financial product.
The Reports are published by Market Matters in good faith based on the facts known to it at the time of their preparation and do not purport to contain all relevant information with respect to the financial products to which they relate. Although the Reports are based on information obtained from sources believed to be reliable, Market Matters does not make any representation or warranty that they are accurate, complete or up to date and Market Matters accepts no obligation to correct or update the information or opinions in the Reports.
If you rely on a Report, you do so at your own risk. Any projections are estimates only and may not be realised in the future. Except to the extent that liability under any law cannot be excluded, Market Matters disclaims liability for all loss or damage arising as a result of any opinion, advice, recommendation, representation or information expressly or impliedly published in or in relation to this report notwithstanding any error or omission including negligence.
To unsubscribe. Click Here


