Time to watch MM’s large Resources basket very closely! (SSM, CGC, CAT US, BHP, RIO, OZL, FMG, WSA)
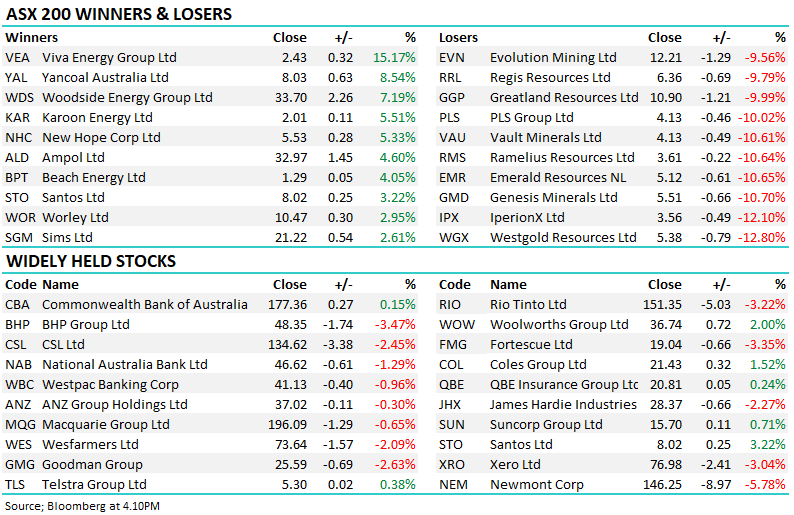
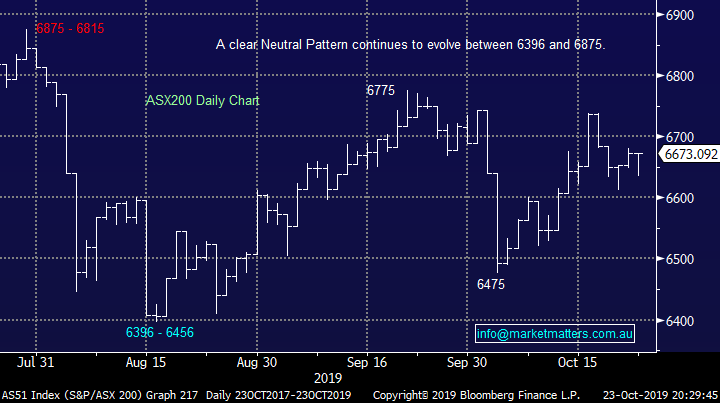
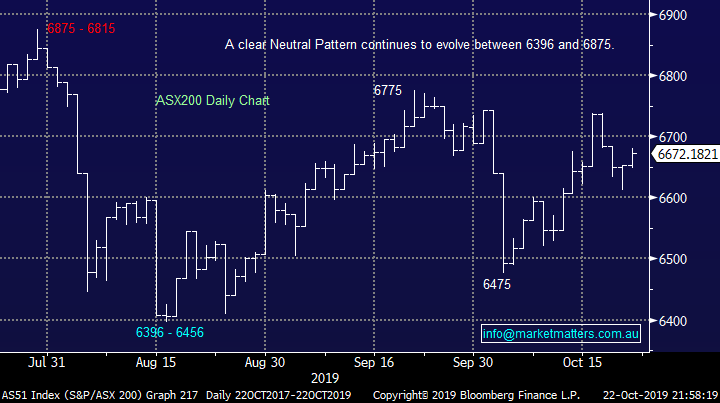
The ASX200 continues to rotate in the same trading range which has incredibly contained our market since the last financial year, again on Thursday we saw buying enter stocks after they initially fell almost 40-points - there simply remains no buyers on strength, or sellers of weakness. Only one sector moved by over 0.5% on the day and that was the Telcos which declined -0.9%, no great surprise for a market which finished the day unchanged.
The local IT sector was the main group that caught our eye as on-line accounting software business Xero (XRO) fell over 3% to join the club of Wisetech Global (WTC), Afterepay (APT), Appen (APX) and Altium (ALU) i.e. stocks within the Software & Services Index that have fallen by more than 5% over the last 5 days – a bad time for the WAAAX stocks. Importantly even after the sectors 8% correction MM remains bearish initially looking for another ~7% downside after this first wave of ‘buy the dip’ breaks down.
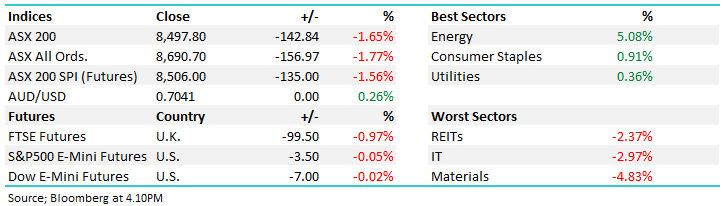
Bond yields are often the main driver of equities hence it’s no surprise in todays quiet market that the Australian 3-years remain around 0.75%, the same level as the RBA Cash Rate, an area they first reached in the first few days of August. Its our opinion at MM that the RBA is unlikely to cut rates again in 2019, any further monetary policy assistance for our economy from Martin Place is likely to be in 2020, if at all. Some form of quantitative easing (QE) by the central bank may be the more likely path given the full impact of rate cuts are not finding their way to borrowers hip pockets – the RBA has actually put a out a paper on this topic with a positive skew. Conversely we also believe it’s time for the Liberal government to consider some form of fiscal stimulus but as Christmas looms rapidly this also now feels unlikely until 2020 hence 2 potential catalysts to lift the ASX200 to a new trading range still appears to be months away.
Short-term MM remains neutral the ASX200.
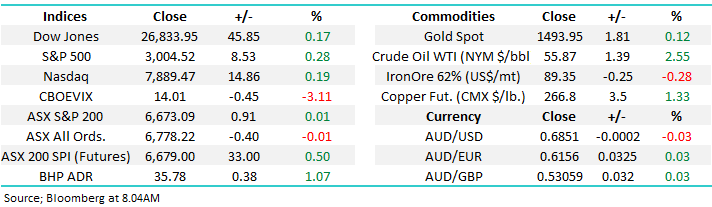
Overnight global stocks were mixed as US reporting season continues to provide no clear direction with Texas Instruments (TXN US) pressuring the NASDAQ lower while Caterpillar (CAT US), the worlds largest construction equipment manufacturer, rallied helping the Dow. This is a positive sign for our bullish view on the Capital Goods Sector. Locally the ASX200 is set to open up around 30-points with BHP gaining ~1% in the US implying the resources will be leading the charge today.
This morning MM has looked closely at the resources sector after we increased our exposure to yesterday through the purchase of Western Areas (WSA).
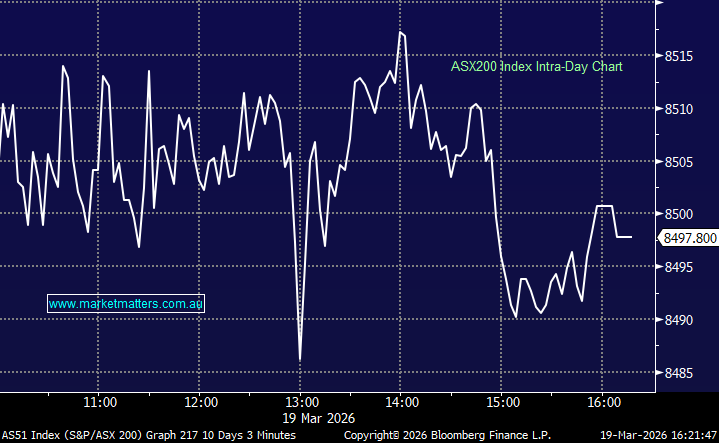
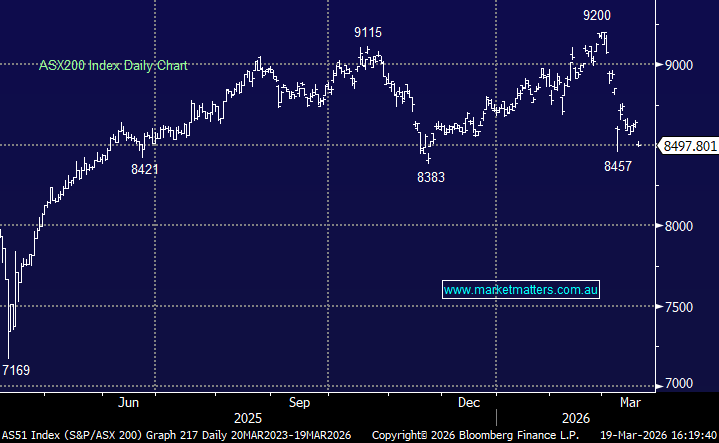
ASX200 Chart
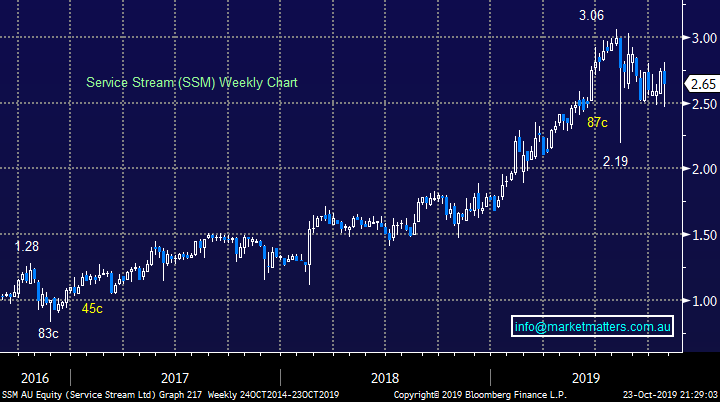
We bought Service Stream (SSM) this week only to see it plunge by over 10% at one stage yesterday following the company’s AGM, however I think the catalyst for the decline was the sale of 1 million shares by MD Leigh Mackender. Its never great news seeing insider selling in a stock but its not always bad news, the stocks strong recovery late afternoon was encouraging and we remain cautiously optimistic after reading the AGM notes a number of times - the companies financials and outlook appear solid just as we thought when we bought on Monday. Technically a close back above $2.80 will be clearly bullish.
MM remains cautiously bullish SSM.
Service Stream (SSM) Chart
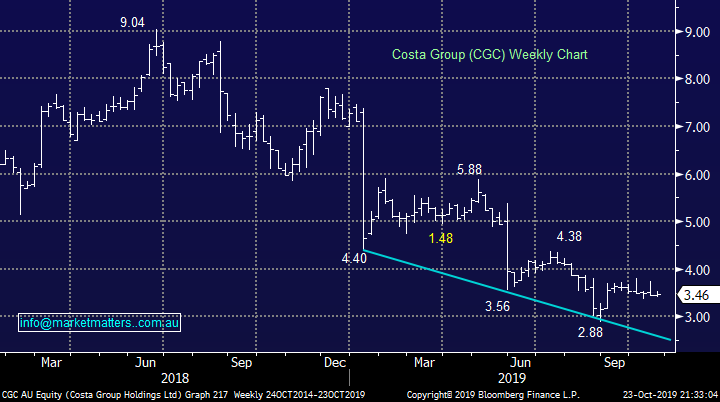
Costa Group (CGC), a position we hold in the Growth Portfolio looks likely to be in suspense at least into early next week as we wait for 2 likely pieces of negative news:
1 – Another trading downgrade is likely which this horticulture business appears to be struggling to quantify
2 – Also a capital raising appears a strong possibility with fund managers appetite and the price feeling like the concern
When a stock goes into a trading halt then suspends trade, its rarely a good thing. In terms of news / broker commentary, the Australian is reporting the potential for the above however no updates from the brokers that cover the stock. There remains 5 buys & 5 holds on CGC.
At this stage all we can do is sit back and brace for at least one tough day at the office next week.
Costa Group (CGC) Chart
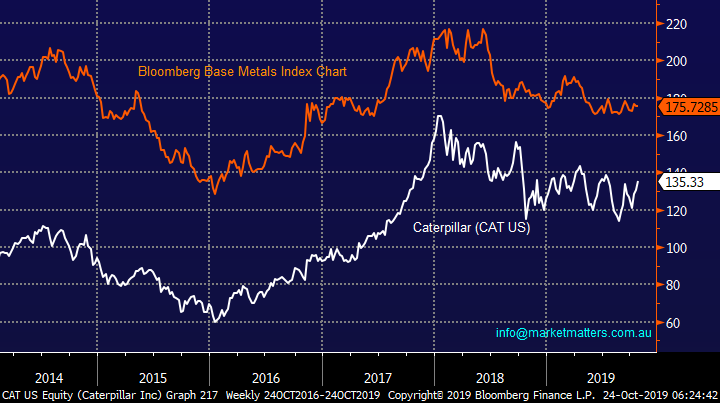
Overnight Caterpillar (CAT US) opened down sharply only to rally throughout the session to make fresh 3-month highs as investors embraced the CEO’s plans to cut production to match dealer demand – a logical step in our opinion as their customers wait to see the washout from US – China trade issues before making major purchases.
This is an encouraging move by CAT because as can be seen below there is a clear positive correlation between its price and that of base metals.
Caterpillar (CAT US) & Base Metals Chart
MM is now aggressively long the resources
The best poker players usually believe the best 2 options in a hand are “raise or fold” well MM has certainly followed this mantra with our high conviction Growth Portfolio after buying Western Areas (WSA) yesterday – a raise! We now have a total of 21% of our Growth Portfolio exposed to the classic resources stocks via OZ Minerals (OZL), BHP Group (BHP), RIO Tinto (RIO), Fortescue Metals (FMG) and of course now Western Areas (WSA), a decent overweight call.
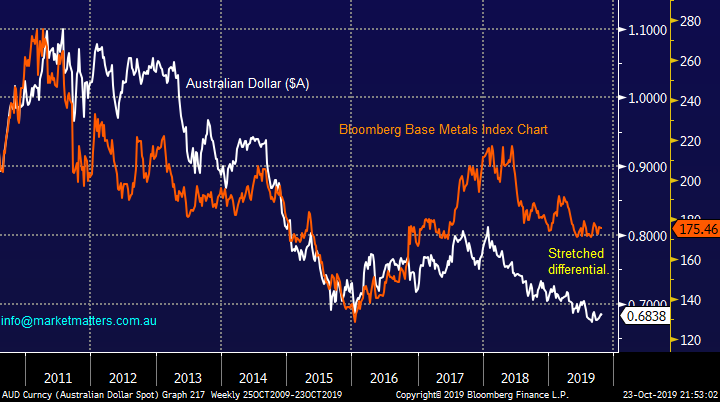
One of our strongest views today at MM is that the Australian Dollar ($A) has reached a major point of inflection on the downside and a bounce back towards 80c is underway. This is not a huge call when we consider the $A has depreciated from ~110 to sub 70c over the last 8-years, its simply regaining around 30% of its losses which amounts to no more than a typical market bounce.
The $A moves in tandem with base metal prices which is both easy to comprehend and very clear from the chart below. If our view on the $A proves correct the strong likelihood is we are set to see another strong move by industrial metals and hopefully their related stocks.
Australian $A v Bloomberg Base Metals Index Chart
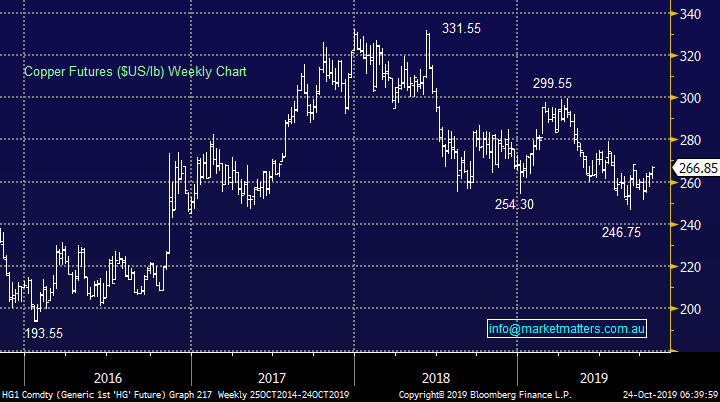
Copper is often referred to as “Dr Copper” and is regarded as an excellent barometer of global economic strength / activity. Just on cue for today’s report copper rallied nicely overnight to approach its 12-week high, technically our initial target is over 5% higher. Copper and other industrial metals have been supressed under the cloud of US – China trade worries but as the midst slowly lifts and the $US wobbles, at the very least, the path of least resistance now feels on the upside.
MM is bullish copper and the resources / growth stocks into 2020.
Copper Chart
Today I have briefly looked at the 5 resource stocks we hold in our Growth Portfolio as we follow one of Warren Buffets attitudes towards investing i.e. he likes to hold a relatively small number of stocks in his portfolio but he then watches these stocks very closely. Two of his quotes sum this up perfectly:
“Diversification is protection against ignorance. It makes little sense if you know what you are doing” and “Wide diversification is only required when investors do not understand what they are doing” – Warren Buffett.
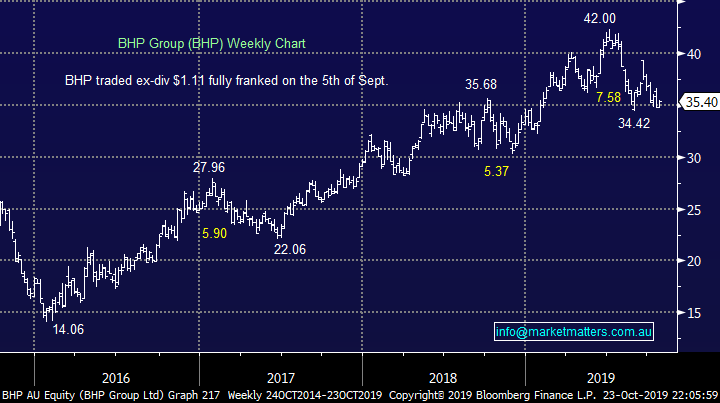
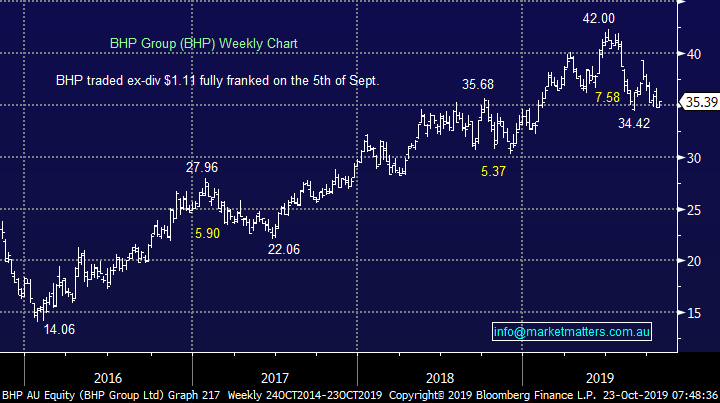
1 BHP Group (BHP) $35.40
BHP is Australia second largest company making up a significant 5.6% of the ASX200 hence when it and the sector are strong the market often rallies – this feels likely today. This huge diversified miner has its fingers in many pies but 2 factors which MM sees unfolding in 2020 are likely to provide major tailwinds for the “Big Australian” i.e. Chinese economic stimulus and a weakening $US.
The stock feels cheap trading on an Est P/E for 2020 of 12x while yielding 5.8% fully franked.
MM is bullish BHP targeting fresh all-time highs above $42.
BHP Group (BHP) Chart
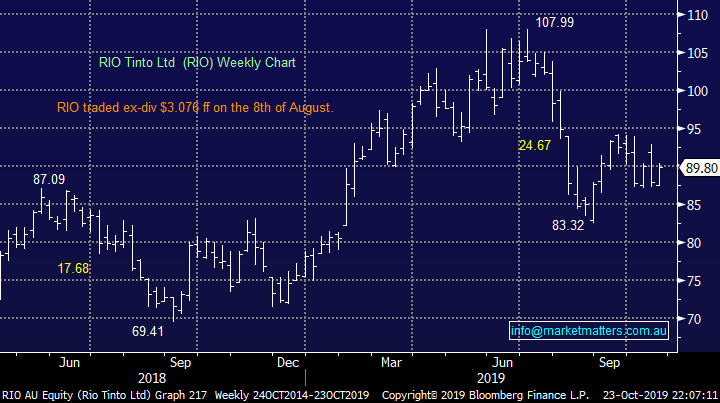
2 RIO Tinto (RIO) $89.80
RIO is also a major diversified resource stock but its earnings are skewed towards iron ore at this stage of its evolution. Technically its gaining strength around the $90 area and our preferred scenario is we see an initial rally towards $100 into Christmas.
RIO also feels cheap trading on an Est P/E for 2020 of 9.7x while yielding 6.4% fully franked – not surprisingly with this yield RIO also resides in our Income Portfolio.
MM is bullish RIO initially targeting ~$100.
RIO Tinto (RIO) Chart
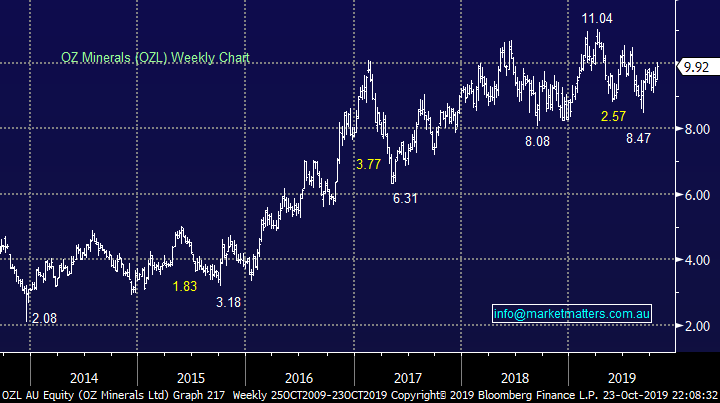
3 OZ Minerals (OZL) $9.92
We purchased major copper producer OZL recently and it was encouraging to see it make 10-week highs yesterday, testing $10 in the process. MM is bullish OZL both as a business and because we have a bullish outlook on the resources sector as a whole, we simply believe the markets undervaluing its assets / production into the future.
MM is bullish OZL with a target ~$12.
OZ Minerals (OZL) Chart
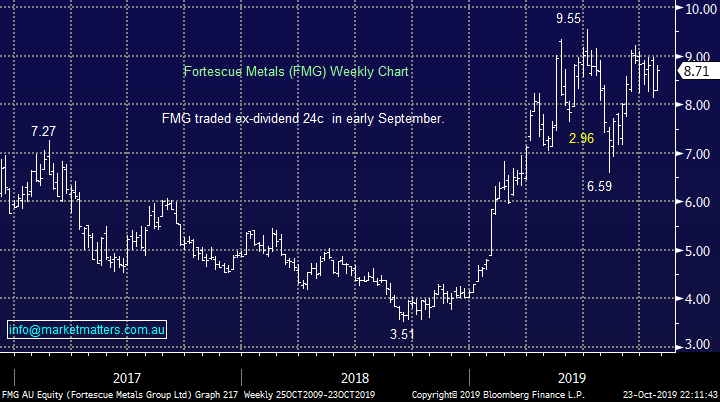
4 Fortescue Metals (FMG) $8.71
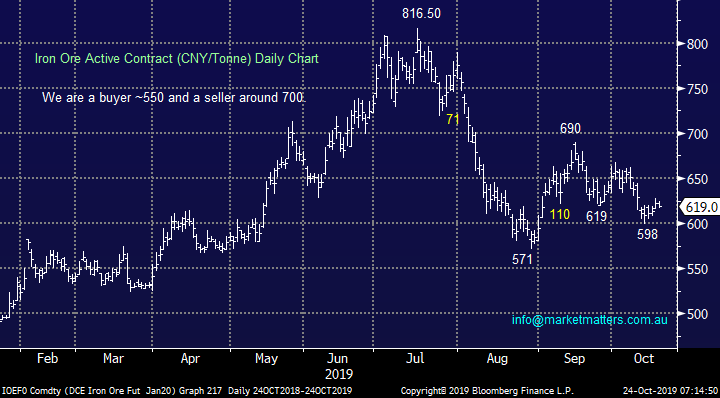
Iron ore producer FMG has been in our Growth Portfolio since early August and touch wood its following our anticipated path perfectly so far. Even while iron ore has corrected 30% the stock has held firm illustrating its intrinsic value in our opinion. We may even consider increasing this position if iron ore breaks its August low in the weeks ahead – obviously this will depend on the underlying reaction by FMG.
FMG is another local miner which feels cheap trading on an Est P/E for 2020 of 4.8x while yielding 5.7% fully franked.
MM is bullish FMG targeting a break of its $9.55 high.
Fortescue Metals (FMG) Chart
Iron Ore (CNY/Tonne) Chart
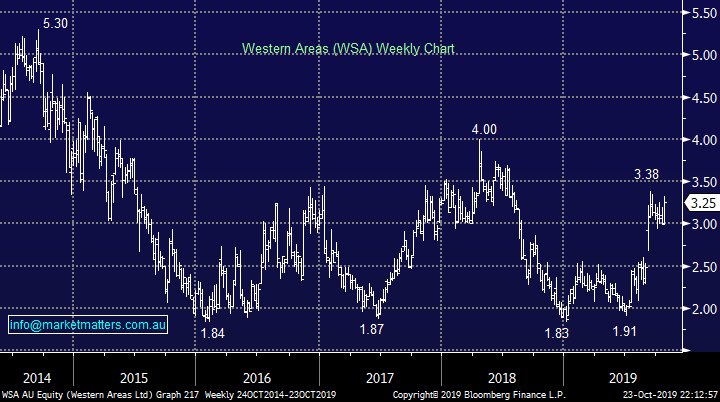
5 Western Areas (WSA) $3.25
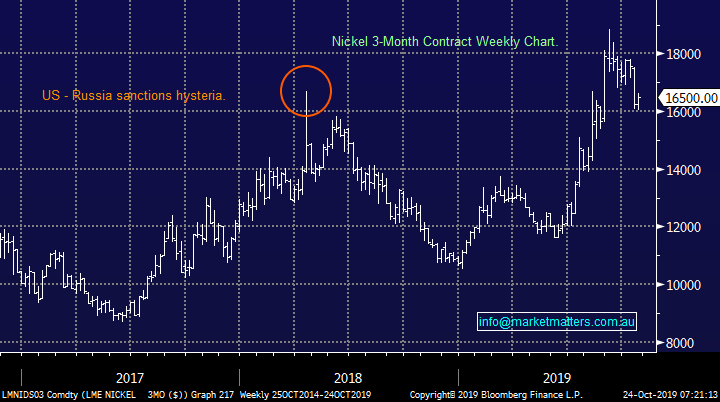
MM purchased nickel producer WSA yesterday which may prove excellent timing after the industrial metal rallied over 3% last night. We are bullish nickel looking for fresh 20119 highs and we believe it’s a matter of time until the producers play aggressive “catch up”.
MM is bullish WSA initially targeting ~20% upside.
Western Areas (WSA) Chart
Nickel 3-month Chart
Conclusion (s)
MM is bullish the cyclical / resource stocks until further notice.
Global Indices
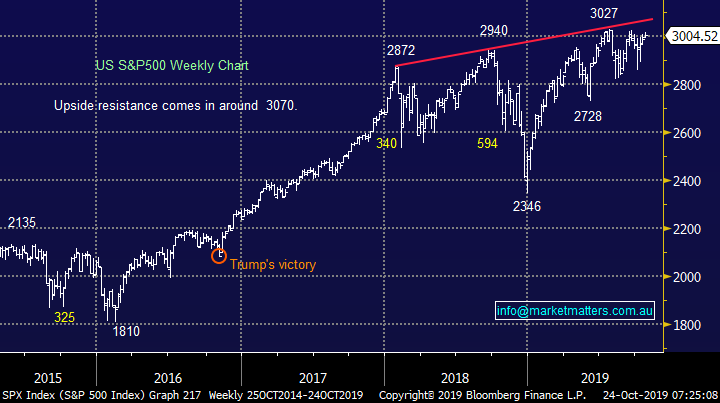
No change, we are now giving the benefit of the doubt to the post GFC bull market with fresh all-time highs ultimately looking likely.
MM is now mildly bullish US stocks.
US S&P500 Index Chart
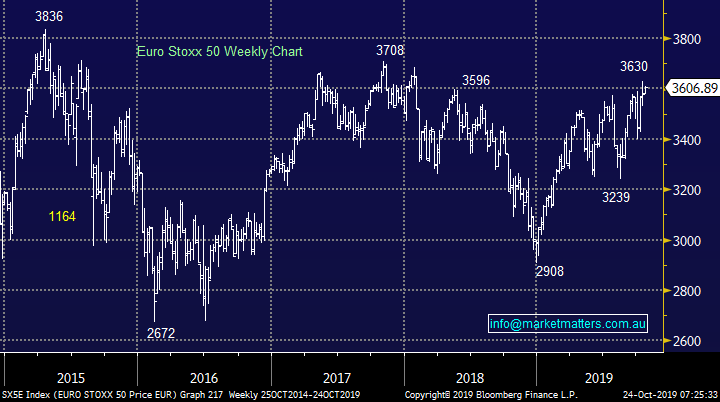
European indices are mixed technically but with no commitment in either direction at this point in time but we maintain our slight positive bias.
Euro Stoxx50 Chart
**Morning Note: Wednesday 23rd October 2019**
Yesterday there were issues with charts in the AM Report. Some subscribers could not see them while the positioning of charts for others was inaccurate. We apologies for the inconvenience. We added a link to the MM website yesterday afternoon however I also include the note below for those who may have missed it. Thanks for your patience - James
Overseas Wednesday – International Equities & ETF Portfolios.
The ASX200 continues to rotate in a tight range while the major sectors / themes within global equity markets jostle for favour into Christmas, and beyond. At MM we have some strong views around what’s on the menu moving forward hence today we’ve written a concise report outlining these often contrarian thoughts and most importantly how we intend to position the MM portfolios to benefit accordingly, assuming of course we are correct! :
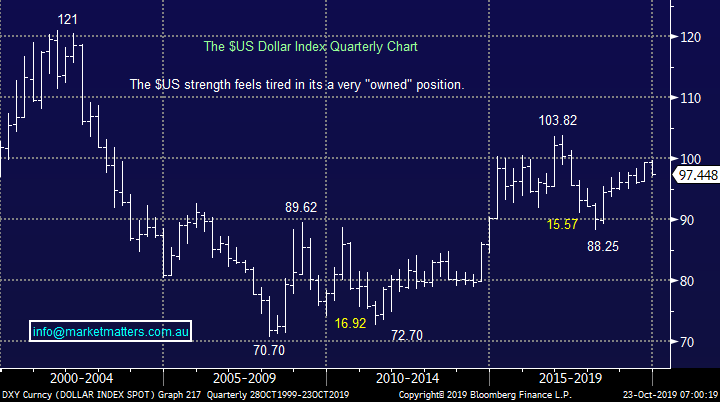
1 – Sell $US: MM believes the $US is commencing a major move to the downside which importantly has reflationary implications – its bullish for commodities and emerging markets (EM).
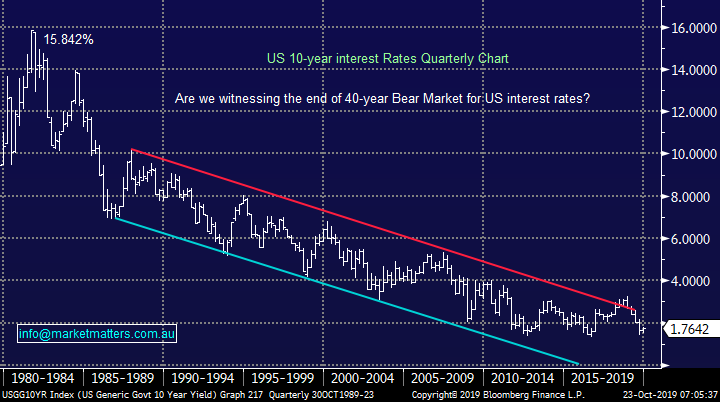
2 – Interest rates bottoming: We believe the risk / reward has tipped in favour of a low being in place for bond yields i.e. interest rates have bottomed. A bullish move for bank earnings.
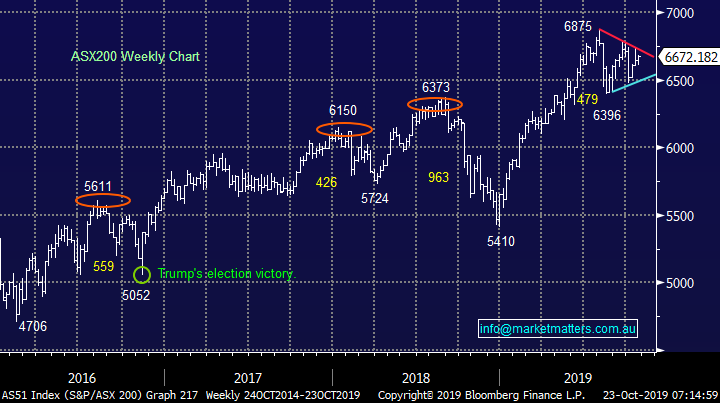
3 – Major stock indices neutral: Underlying equity indices remain neutral with sentiment indicators like the put / call ratio implying a meaningful move to the downside is unlikely i.e. investors are already scarred / bearish.
4 – Buy cyclicals over growth: MM is bullish cyclicals over defensive stocks especially those on the ASX who have enjoyed the strong $US tailwind.
We have touched on these points a few times over recent weeks but they have huge ramifications on how portfolios should be structured hence today when we look at our plans for the International Equity and Global Macro Portfolios both are eyes firmly fixed on these huge market influences on the road ahead.
Overnight US stocks again drifted into the close with the tech based NASDAQ the main culprit falling -0.8%, the SPI futures are suggesting the ASX200 is set to open down less than 10-points with again no clear lead.
ASX200 Chart
The $US is looking “cooked”
The chart below illustrates that any depreciation in the $US is in its infancy and markets are unlikely to have embraced this potentially seismic change in trend. At the very least the risk / reward for investors positioned for an ongoing rally in the $US is very unappealing to MM.
Importantly a weaker $US is reflationary by definition, exactly what central banks are striving for.
$US Index Chart
Bond yields are leading sector rotation
We believe it’s way too early to be talking about an end to the multi-decade bear market for interest rates but we do believe they are reaching, or already have reached, the nadir of the descent.
At MM our strong opinion is central banks are going to implement aggressive fiscal stimulus in 2020 to maintain post GFC economic activity, a move that is both potentially inflationary and an acknowledgement that further rate cuts are pretty much a waste of time.
US 10-year bond yield Chart
Stock markets remain neutral
This churning share market should not be fought with the ASX200 trading at the same level as it was in June.
We believe investors should focus on the correct stocks / sectors as opposed to the underlying index itself – not always the case.
ASX200 Index Chart
Buy Cyclicals over Growth / Defensives
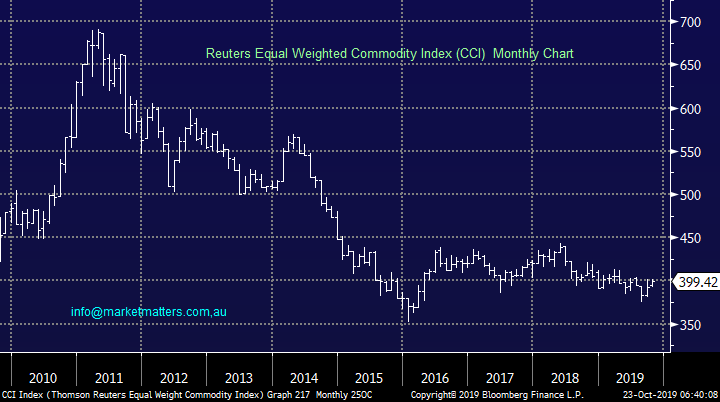
Copper has a record high speculative short position which is a huge contrarian flashing light that a major low is close to hand. As we’ve stated a number of times we’re bullish commodities and the below chart illustrates the obvious room to at least bounce for the equally weighted basket – a huge reflationary warning signal that says to MM avoid defensive and yield play stocks.
MM has an initial target over 15% higher for the Commodity Index (CCI).
Equal weighted Commodity Index (CCI) Chart
International Equites Portfolio
We have recently added Bank of America (BAC), Janus Henderson (JHG US) and United Health (UNH US) to our International Portfolio reducing our cash position to 59% : https://www.marketmatters.com.au/new-international-portfolio/
There are a number of stocks / sectors MM is keen to buy to skew this portfolio very much in-line with our economic views into 2020, some close to home and some far away.
1 – BHP Group (BHP) $35.39 – why get too fancy, BHP is a top international resources business which is only trading on a P/E of 12x for 2020 while it yields 5.8% fully franked, that ticks our boxes.
BHP Group (BHP) Chart
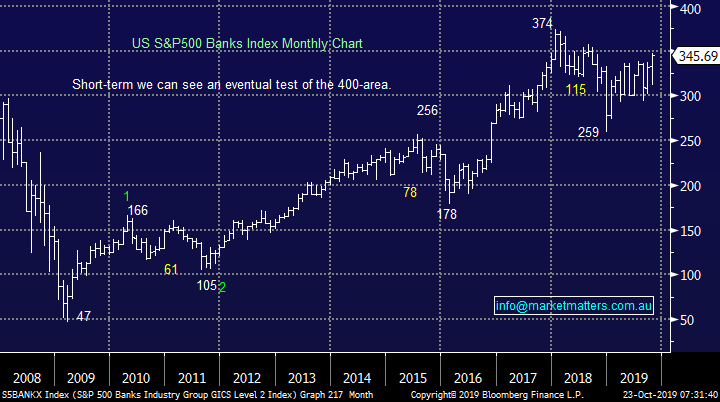
2 – Our favourite banking position to dovetail with our new Bank of America (BAC US) position is JP Morgan (JPM US) where a conservative 5% stop can be adopted. We do ponder long and hard a banking ETF here as well.
US S&P500 Banking Index Chart
Conclusion (s)
Of the 3 stocks / ETF’s MM looked at today we like all 3, especially as we hold a short S&P500 position which is where we see major underperformance moving forward.
MM Global Macro ETF Portfolio
The MM Global Macro Portfolio is in need of tweaking to fully align with our views outlined earlier, expect some action this week. : https://www.marketmatters.com.au/new-global-portfolio/
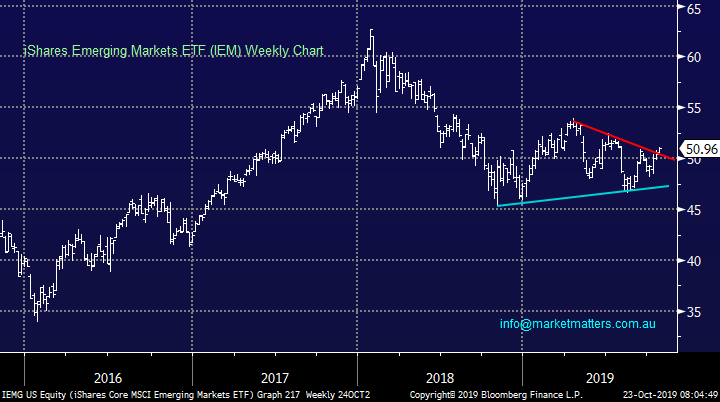
1 – The same as the International Portfolios we are looking to buy the iShares Emerging Markets ETF (IEM).
iShares Emerging Markets ETF (IEM) Chart
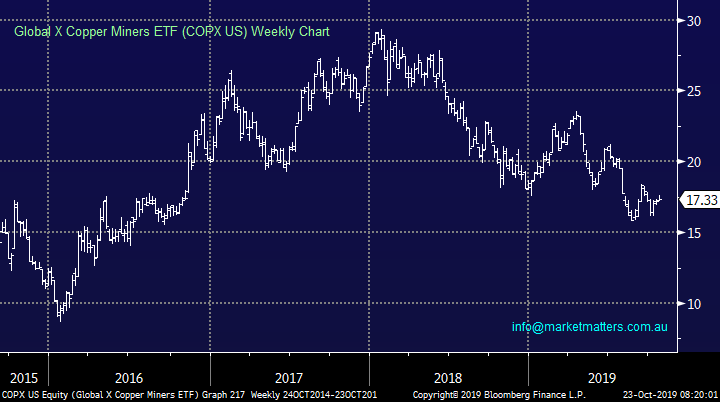
2 – We are especially bullish copper into 2020 with our preferred way of investing around this view is via the Global X Copper Miners ETF (COPX US) at today’s level.
For more information on this ETF go to: https://www.globalxetfs.com/funds/copx/
Global X Copper Miners ETF (COPX US) Chart
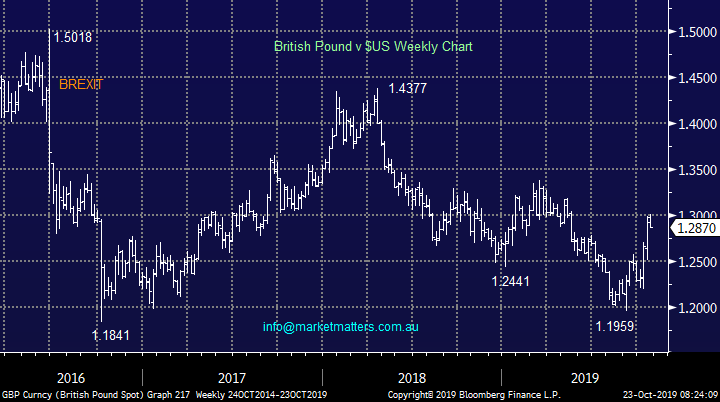
3 – Our thoughts around BREXIT remain positive hence our recent comfort in buying JHG for the International Equities Portfolio, following last night’s pullback after yet more voting in the UK, we like the Pound from a risk / reward perspective.
Our preferred ETF to invest in the Pound is the Invesco ETF: https://www.invesco.com/portal/site/us/investors/etfs/product-detail?productId=FXB
British Pound versus $US Chart
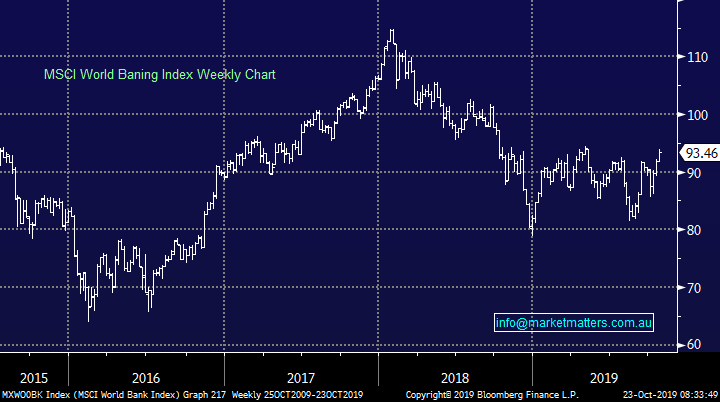
4 – Again as discussed previously we are keen on the banking sector into 2020, a sector which enjoys rising margins as interest rates and reflation rise.
Our preferred ETF for global banks’ exposure is the BetaShares Global banks ETF (BNKS) which is listed in Australia and is currency hedged : https://www.betashares.com.au/fund/global-banks-etf-currency-hedged/
MSCI World Banking Index Chart
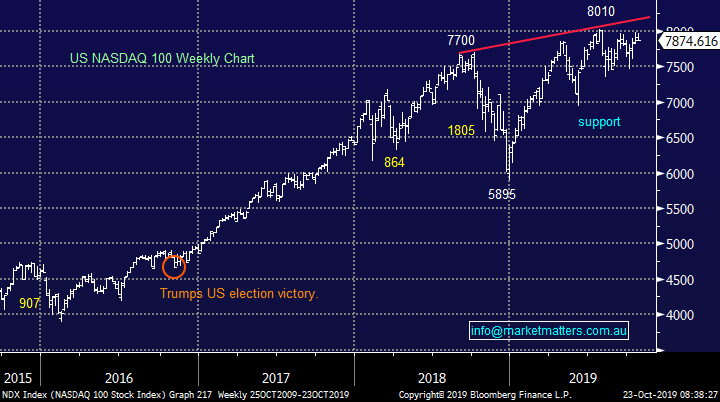
5 – lastly we feel our “anti” growth opinion can be best played through going short the US NASDAQ.
Our preferred ETF for a short exposure to the NASDAQ is the ProShares short QQQ ETF (PSQ US) : https://www.etf.com/PSQ
US NASDAQ Index Chart
Conclusion (s)
Of the 5 ETF’s MM looked at today we like all 5 to “fit” our global macro view on markets.
Overnight Market Matters Wrap
- The US equities markets rose marginally higher on a quiet session overnight as quarterly earnings took over the recent global macro gossip. - 25% of S&P 500 companies have reported their earnings and of those reported, more than 80% have surpassed analyst expectations which is pretty standard.
- It was noticeable that the Philadelphia Semiconductor index lost close to 2% on the back of Texas Instruments weaker than expected forecast,
- The game of snakes and ladders was revived overnight, with Crude oil rallying 2.5% higher to end its session at US$55.87/bbl. following a surprise drop in supplies.
- The December SPI Futures is indicating the ASX 200 to open 34 points higher, testing the 6710 level this morning.
Have a great day!
James & the Market Matters Team
Disclosure
Market Matters may hold stocks mentioned in this report. Subscribers can view a full list of holdings on the website by clicking here. Positions are updated each Friday, or after the session when positions are traded.
Disclaimer
All figures contained from sources believed to be accurate. All prices stated are based on the last close price at the time of writing unless otherwise noted. Market Matters does not make any representation of warranty as to the accuracy of the figures or prices and disclaims any liability resulting from any inaccuracy.
Reports and other documents published on this website and email (‘Reports’) are authored by Market Matters and the reports represent the views of Market Matters. The Market Matters Report is based on technical analysis of companies, commodities and the market in general. Technical analysis focuses on interpreting charts and other data to determine what the market sentiment about a particular financial product is, or will be. Unlike fundamental analysis, it does not involve a detailed review of the company’s financial position.
The Reports contain general, as opposed to personal, advice. That means they are prepared for multiple distributions without consideration of your investment objectives, financial situation and needs (‘Personal Circumstances’). Accordingly, any advice given is not a recommendation that a particular course of action is suitable for you and the advice is therefore not to be acted on as investment advice. You must assess whether or not any advice is appropriate for your Personal Circumstances before making any investment decisions. You can either make this assessment yourself, or if you require a personal recommendation, you can seek the assistance of a financial advisor. Market Matters or its author(s) accepts no responsibility for any losses or damages resulting from decisions made from or because of information within this publication. Investing and trading in financial products are always risky, so you should do your own research before buying or selling a financial product.
The Reports are published by Market Matters in good faith based on the facts known to it at the time of their preparation and do not purport to contain all relevant information with respect to the financial products to which they relate. Although the Reports are based on information obtained from sources believed to be reliable, Market Matters does not make any representation or warranty that they are accurate, complete or up to date and Market Matters accepts no obligation to correct or update the information or opinions in the Reports. Market Matters may publish content sourced from external content providers.
If you rely on a Report, you do so at your own risk. Past performance is not an indication of future performance. Any projections are estimates only and may not be realised in the future. Except to the extent that liability under any law cannot be excluded, Market Matters disclaims liability for all loss or damage arising as a result of any opinion, advice, recommendation, representation or information expressly or impliedly published in or in relation to this report notwithstanding any error or omission including negligence.