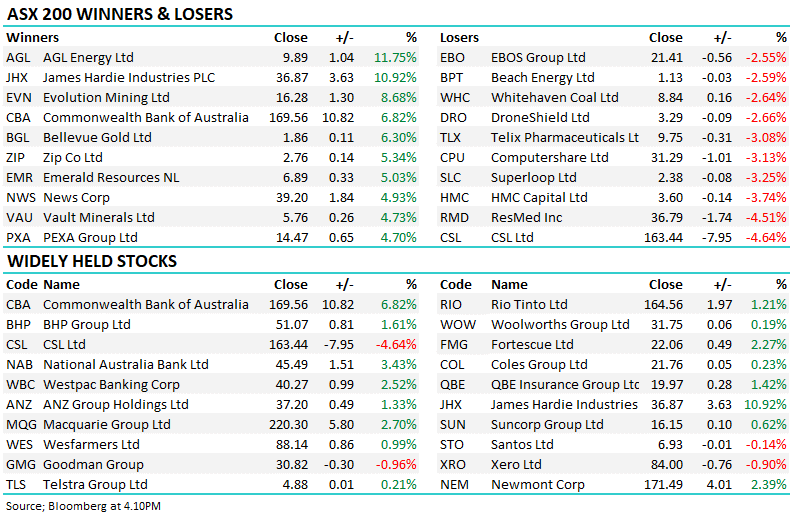
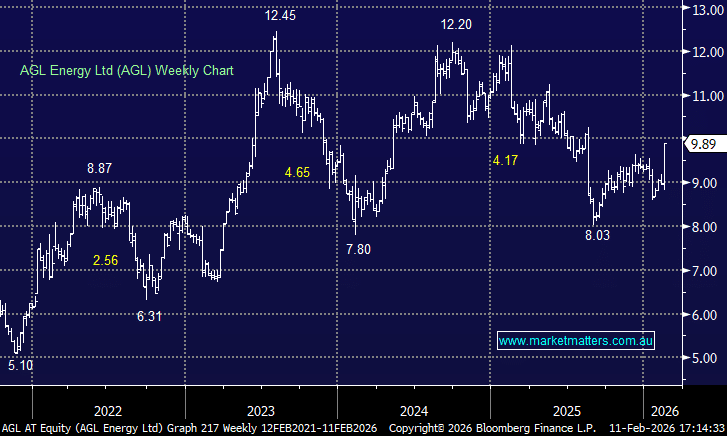
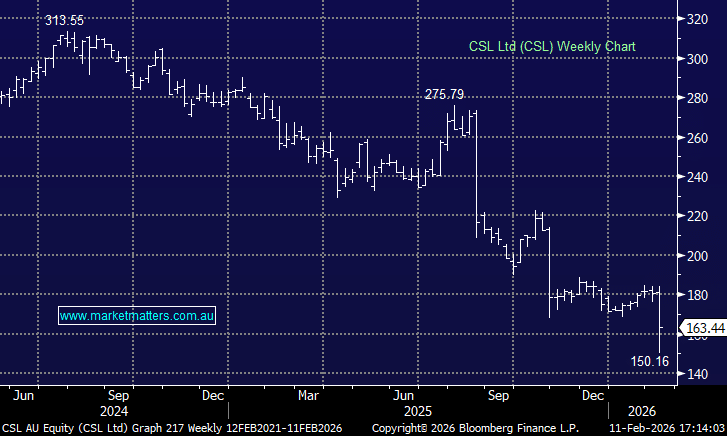
Time to review the MM “losers” as the winners are certainly looking after themselves (FMG, BAL, NST, GUD, CGF, JHG, PPT, GMA)

The ASX200 finally managed to close up 12-points yesterday but the action was again mainly on the stock level with 13 stocks in the ASX200 moving by over 4% on a very quiet day for the index – the standout was the iron ore stocks which soared (Fortescue (FMG) +7.8% & RIO +4.5%) while some companies who missed market expectations on their reporting red carpet were savaged e.g. Syrah Resources (SYR) -13.4% and GUD Holdings (GUD) -9%.
MM remains mildly in “sell mode” with today’s report focusing on what if any stocks should be cut short-term.
Overnight the US stock market rallied strongly following a continued softening by the Fed towards future rate hikes – they have adopted a patient rate stance with balance-sheet flexibility. Hence the “free money” tap that has fuelled the longest equity (asset) bull market in history is not being turned off as dramatically as previously perceived.
Perhaps the Fed is now more concerned around a potential recession moving forward as opposed to inflation - as we have discussed recently they are walking a very tricky tightrope and we all should be very sceptical of the complete about turn from Powell relative to the last meeting.
The Dow finally closed up 434-points following the Feds market friendly comments but the ASX200 is only looking to open up around 20-points this morning – we still believe the short-term risks to stocks are down from here.
Firstly we have initially looked at yesterday’s big movers looking for opportunity within the current volatility – remember we now have 27% cash in the MM Growth Portfolio and 24.5% in the Income Portfolio.
Secondly we are going to review the underperformers in the MM Platinum & Income Portfolios as the winners are certainly looking after themselves e.g. RIO Tinto (RIO), Fortescue (FMG) and Telstra (TLS).
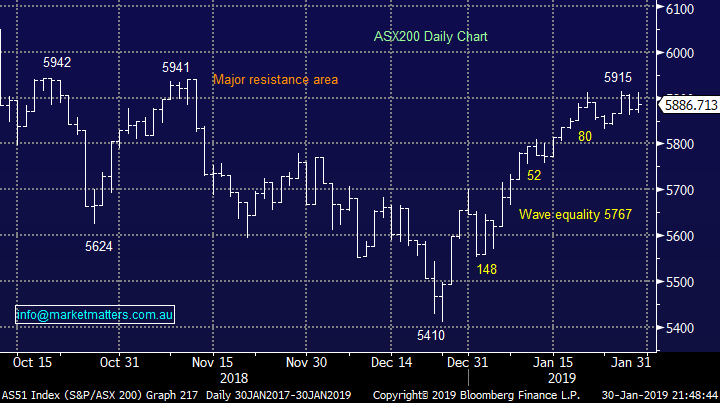
ASX200 Index Chart
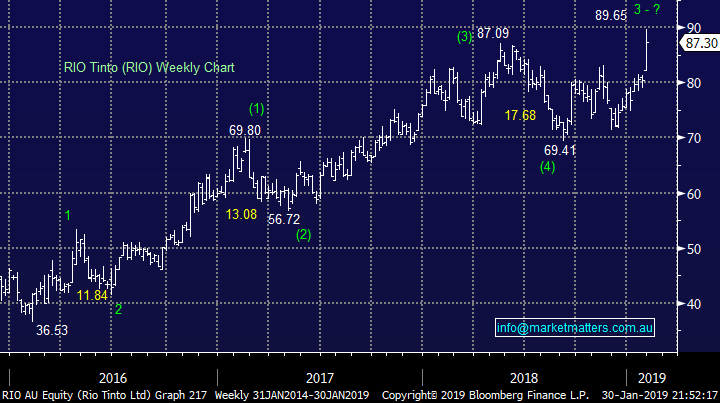
Yesterday MM took a healthy ~20% profit on our RIO position in the Growth Portfolio around $89, a move we flagged in Wednesdays report.
NB a break below $84.50 would be required to actually switch us negative RIO at this point in time.
At MM we strongly believe that being prepared to sell is one of the keys to successful investing in 2019 / 2020, consider our last 5 sell alerts by the Growth Portfolio, while the index has continued to grind higher:
1 – Sold Suncorp (SUN) on the 21st of January around $13 – yesterday SUN closed at $13 i.e. unchanged.
2 – Sold Altium (ALU) on the 17th of January around $23.80 - yesterday ALU closed at $24.01 i.e. 1.5% higher.
3 – Sold Ramsay Healthcare (RHC) on the 11th of January around $59 – yesterday RHC closed at $56.85 i.e. 3.6% lower.
4 – Sold CSL Ltd (CSL) on the 10th of January above $195 – yesterday CSL closed at $194.73 i.e. basically unchanged.
5 – Sold Xero (XRO) on the 9th of January above $44 - yesterday XRO closed at $40.02 i.e. 9% lower.
While we’re slightly ahead from these 5 most recent sells , its not meaningful at this stage, however it does highlight that having a focus on stocks (over and above the market generally) should remain our core priority. .
That said, if the ASX200 does decline below 5800 in the weeks ahead as we expect throwing up stock opportunities, having cash to take advantage will be a very useful value add = alpha!
RIO Tinto (ASX: RIO) Chart
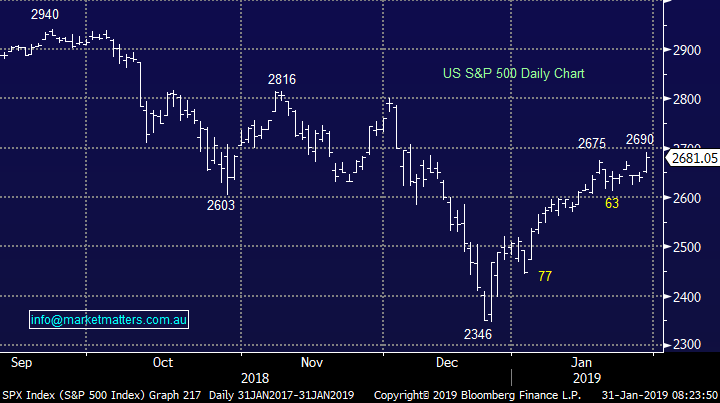
US markets made the fresh highs we have been looking for overnight and we still believe they are vulnerable to a decent correction. Technically a sell signal will be generated by a close below 2675 – not far away.
US S&P500 Chart
Reviewing Yesterdays main movers that look interesting
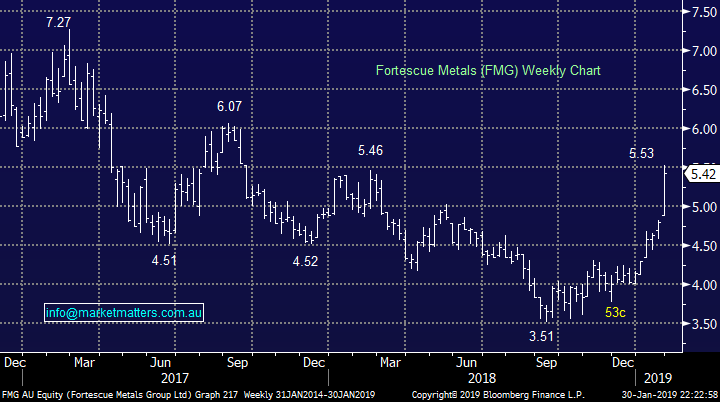
1 Fortescue Metals (FMG) $5.42
FMG has enjoyed an excellent recovery from last Septembers low illustrating the potential benefits of standing up and buying quality companies when the market has thrown them into the naughty corner i.e. oversold.
However we believe that the recovery by FMG has now potentially gotten ahead of itself especially following the surge in iron ore prices on the back of the awful Vale disaster.
The put the Vale issue into context, in the first instance, Vale believed that 40mtpa of iron Ore production would be lost from the market, which is significant – about the size of Roy Hill – hence the big spike in price. They then suggested other operations would fill the void before correcting that announcement by suggesting that they would ‘partially’ fill the void – hence the volatility in prices yesterday.
We are now watching FMG with a thought to buy the next 50c pullback – don’t underestimate how volatile FMG can be!
Fortescue Metals (ASX: FMG) Chart
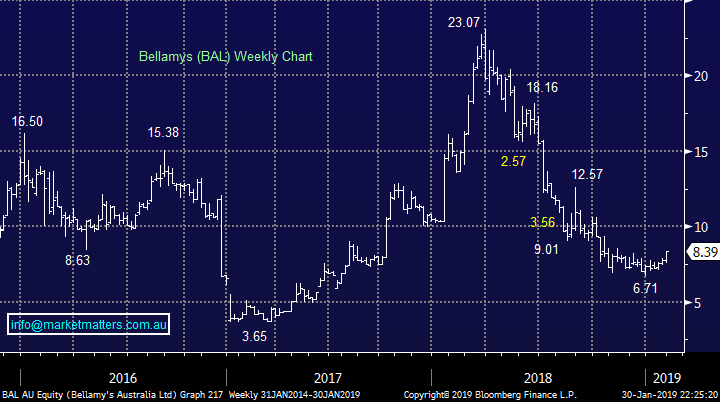
2 Bellamy’s (BAL) $8.39
BAL rallied almost 10% yesterday following a strong buy recommendation from Morgan Stanley calling the company to be on the “cusp of a turnaround” – we tend to agree with these thoughts thinking the stock has a number of near term catalysts for a re-rate higher. The current Est P/E for this year is 22.3x - not too scary for a growth business.
What this rally clearly did illustrate is the lack of selling in BAL following its ~70% fall from last year’s highs. Technically we like BAL with stops below $7.80 – 7% risk.
MM likes BAL as an aggressive buy with stops below $7.80.
Bellamy’s (ASX: BAL) Chart
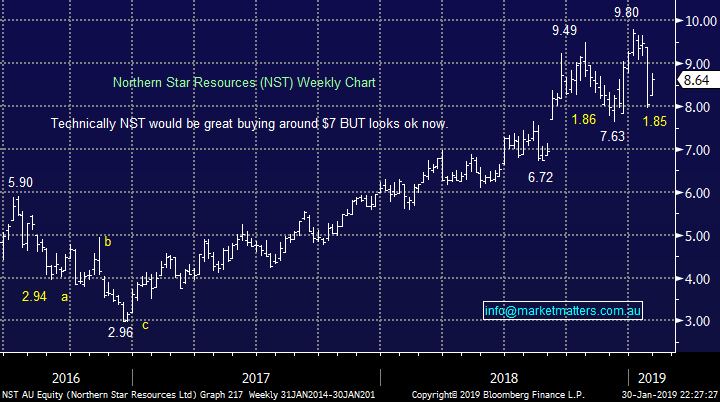
3 Northern Star Resources (NST) $8.64
NST has bounced strongly following last weeks savage sell-off following some strong gains by the underlying gold price – a less hawkish Fed is theoretically positive news for gold i.e. US rates lower for longer should put downward pressure on the US currency + cash is less attractive while interest rates remain low.
We have to now question whether we have been wrong with our short-term call for gold and its sector to retrace, especially as we are looking to establish a position in the precious metal sector.
MM is now considering buying a part position in a gold stock earlier than anticipated.
Northern Star Resources (ASX: NST) Chart
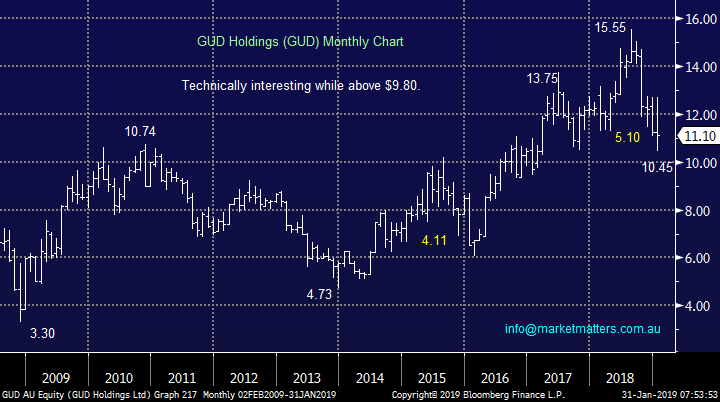
Of the main losers yesterday we are not excited by Syrah Resources (SYR), Webjet (WEB), Credit Corp. (CCP) and QANTAS (QAN) at this stage but GUD Holdings (GUD) feels worthy of some consideration. Yesterday GUD plunged -9% although it did recover around 6% from its intra-day lows. The automotive parts business produced a $29.3m profit for the last 6-months of 2018 making analysts expectations of full year profit of $63.5m extremely optimistic at best.
Recent acquisitions are not yet bearing fruit and market players are becoming concerned around integration risk – clearly not a conservative investment at this stage of the company’s evolution.
However the shares are trading on an undemanding valuation as would be expected while yielding 4.7% fully franked.
From a risk / reward perspective we like GUD around $10.80 but would run stops below $9.80 i.e. 9% risk.
GUD Holdings (ASX: GUD) Chart
Reviewing MM’s underperformers
AS we like to say “look after the losers and the winners will look after themselves”. After watching our positions in Fortescue (FMG), RIO Tinto (RIO) and Telstra (TLS) it’s time to adhere to the mantra after some excellent realised profits over recent months – taking profit when stocks hit our target areas is the relatively easy part of the “game”.
We currently have 4 stocks pressurising our returns, two in each of portfolios:
Growth Portfolio – Challenger (CGF) and Janus Henderson (JHG).
Income Portfolio – Perpetual (PPT) and Genworth (GMA).
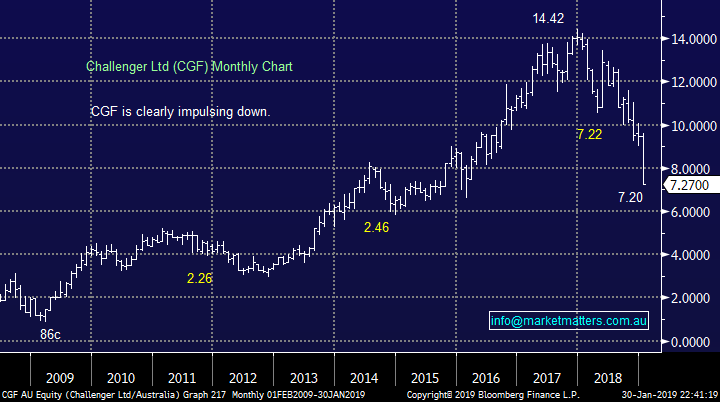
1 Challenger Ltd (CGF) $7.27
CGF has endured an awful month following a very disappointing profit update thanks largely to falling margins. We especially didn’t like them alluding to market volatility and conditions as to one of the main reasons behind the issues – we expect more of the same!
We were hoping to exit this position into a bounce to around $8 but this now looks highly unlikely.
MM cannot see the stock recovering anytime soon and our best guess is a new trading range of $6 to $8 over coming months.
MM is looking to exit our position.
Challenger Ltd (ASX: CGF) Chart
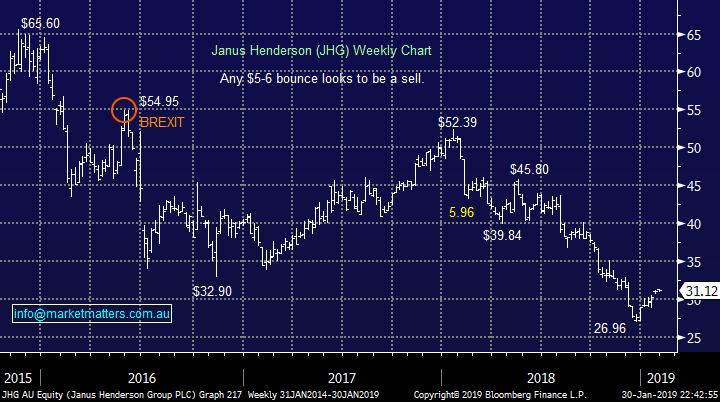
2 Janus Henderson (JHG) $31.12
JHG has experienced consistent outflow of funds under management leading to the declining share price although the recent $4.40 / 16% bounce has been a breath of fresh air.
We have been looking to exit this position into a $5-6 bounce which targets the $32-33 area which is now close at hand.
MM is looking to exit JHG and the opportunity feels close at hand.
NB With both CGF and JHG in the same sector holding both positions is arguably compounding our risk.
Janus Henderson (ASX: JHG) Chart
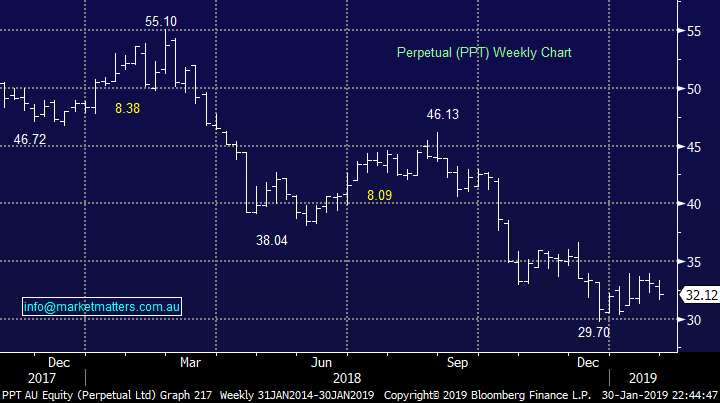
3 Perpetual (PPT) $32.12
PPT was mentioned in a recent Weekend Report looking for a potential squeeze up towards $35 which alas no longer “feels” right.
This is 3 out of 3 of the MM losers from the fund manager space which illustrates the tale of woe last year for the sector. We see a trading range for PPT of $29 to $35 hence will look at our position accordingly.
MM is watching this one carefully but we are enjoying the 8.6% fully franked yield along the way.
Perpetual (ASX: PPT) Chart
4 Genworth (GMA) $2.22
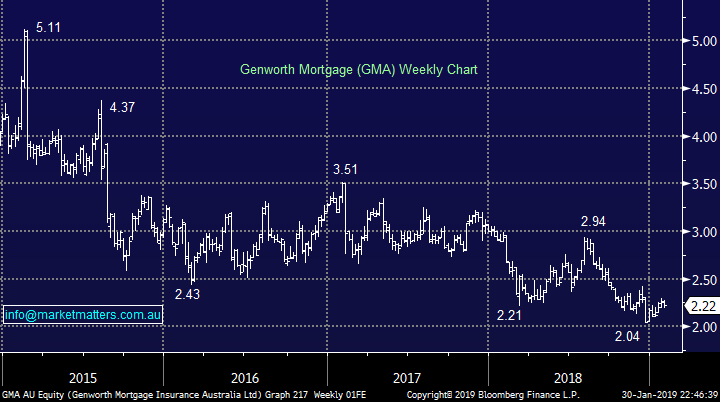
Mortgage insurance business GMA was looking good around a year ago but as is often the case struggling businesses continue to struggle.
Sentiment is clearly against GMA in today’s property market where little optimism can be found today compared to the crazy euphoria of 2-years ago.
The stock is currently cheap, pays a huge dividend + has excess capital on its balance sheet which will go back to shareholders in time.
We are reticent to sell GMA at current levels and would be “sniffing around” on the buy side if we had no position.
Genworth (ASX: GMA) Chart
Conclusion
We are clearly unhappy with our 4 standout losers across the 4 MM Portfolios with the 3 of them from the fund manager space increasing our concern / potential ongoing risks.
Growth Portfolio – expect MM to cut at least one of JHG or CGF in the near future.
Income Portfolio – we are looking for exit opportunities for PPT while GMA may be given longer tenure as a holding.
Overnight Market Matters Wrap
· The US equity markets rallied fiercely overnight following the US Federal Reserve keeping rates on hold and mentioning it will be patient regarding any potential rate rises, removing wording of “gradual rate hikes”. Separately, the Fed signalled it is close to the end of its run-off of its balance sheet. US 10 year government bond yields fell to 2.69%.
· All metals on the LME were better, in particular nickel and copper. Iron ore surged 5%, but closed off its high. Oil is trading higher as the Saudis export less than expected and trouble continues to brew in Venezuela. Gold continued its climb to an 8 month high.
· BHP is expected outperform the broader market after ending its US session up an equivalent of 1.10% from Australia’s previous close.
· The March SPI Futures is indicating the ASX 200 to open 20 points higher testing the 5900 level again this morning.
Have a great day!
James & the Market Matters Team
Disclosure
Market Matters may hold stocks mentioned in this report. Subscribers can view a full list of holdings on the website by clicking here. Positions are updated each Friday, or after the session when positions are traded.
Disclaimer
All figures contained from sources believed to be accurate. Market Matters does not make any representation of warranty as to the accuracy of the figures and disclaims any liability resulting from any inaccuracy. Prices as at 31/01/2019
Reports and other documents published on this website and email (‘Reports’) are authored by Market Matters and the reports represent the views of Market Matters. The MarketMatters Report is based on technical analysis of companies, commodities and the market in general. Technical analysis focuses on interpreting charts and other data to determine what the market sentiment about a particular financial product is, or will be. Unlike fundamental analysis, it does not involve a detailed review of the company’s financial position.
The Reports contain general, as opposed to personal, advice. That means they are prepared for multiple distributions without consideration of your investment objectives, financial situation and needs (‘Personal Circumstances’). Accordingly, any advice given is not a recommendation that a particular course of action is suitable for you and the advice is therefore not to be acted on as investment advice. You must assess whether or not any advice is appropriate for your Personal Circumstances before making any investment decisions. You can either make this assessment yourself, or if you require a personal recommendation, you can seek the assistance of a financial advisor. Market Matters or its author(s) accepts no responsibility for any losses or damages resulting from decisions made from or because of information within this publication. Investing and trading in financial products are always risky, so you should do your own research before buying or selling a financial product.
The Reports are published by Market Matters in good faith based on the facts known to it at the time of their preparation and do not purport to contain all relevant information with respect to the financial products to which they relate. Although the Reports are based on information obtained from sources believed to be reliable, Market Matters does not make any representation or warranty that they are accurate, complete or up to date and Market Matters accepts no obligation to correct or update the information or opinions in the Reports. Market Matters may publish content sourced from external content providers.
If you rely on a Report, you do so at your own risk. Past performance is not an indication of future performance. Any projections are estimates only and may not be realised in the future. Except to the extent that liability under any law cannot be excluded, Market Matters disclaims liability for all loss or damage arising as a result of any opinion, advice, recommendation, representation or information expressly or impliedly published in or in relation to this report notwithstanding any error or omission including negligence.


