Time to buy the embattled Financials? (EHL, CYB, EVN, NAB, IFL, JHG, PNI)
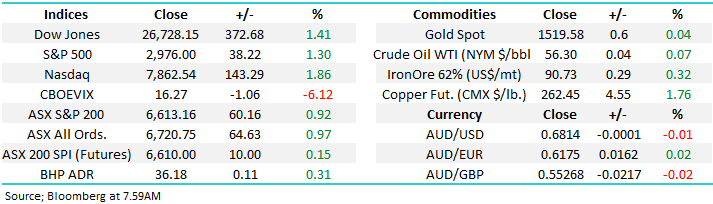
The ASX200 enjoyed a strong Thursday rallying +60-points / 0.9% courtesy of a strong overnight performance by global indices and more importantly the surprise headline which crossed the newswires at 11.30am that the US & China are set to sit down and discuss trade next month in Washington – I doubt things will remain quiet on this front until then but only time will tell. The market was strong across the board except for some defensive pockets like gold and Utilities. We saw some aggressive buying in the value end of town like Emeco (EHL) +9.1% and Costa Group (CGC) +4.5%, a good day for MM here as these 2 make up 10% of our Growth Portfolio – it makes me think of our recent thinking that fund managers are almost excessively long the “safe” blue chips and hence are looking for alternative places to deploy their large cash levels.
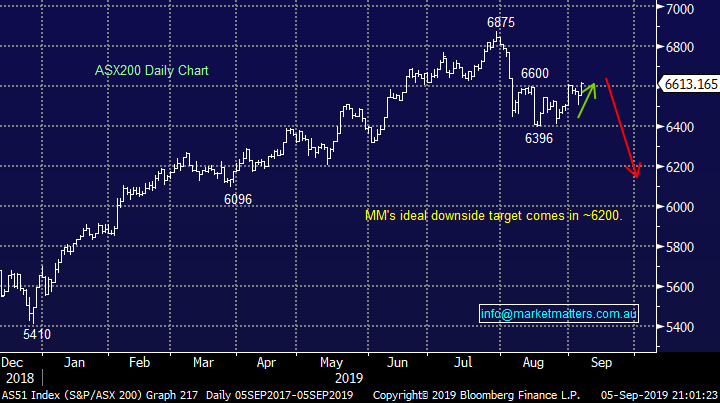
The local market has rapidly moved to, or been forced into, a more “risk on” stance over the last few weeks, pretty much in-line with the green arrow we’ve been anticipating on the daily ASX200 chart below. If we are correct and stocks experience another leg lower before recovering into Christmas it’s the stocks which have rallied strongly in the last few weeks that are likely to perform the heavy lifting hence we are taking note of them now in case we get the opportunity to buy them at better levels in the weeks ahead e.g. the resources sector. Currently we are simply looking for the most common style of market correction to the impressive 27% rally from the December 2018 low, this is just a risk / reward play not reading of “tea leaves” which fills many market newsletters.
Our preferred scenario at MM has been for a news induced spike above the psychological 6600 area before another leg lower, clearly we now have our targeted rally to the upside courtesy of the US & China news, the question now is will they or another left field event give stocks the reason to test down towards 6200. As planned MM has now elevated our cash position in the Growth Portfolio to 29% while also increasing our bearish US S&P500 ETF positions in both the International and ETF Portfolio’s – feels uncomfortable this morning which is often a good sign!
Short-term MM remains comfortable adopting a conservative stance towards equities, especially around this 6600 area.
Overnight US stocks again held onto the positive lead from their futures in our time zone with the Dow closing up 372-points, the SPI futures are pointing to an open around 10-points higher for the ASX200 on the first Friday in September.
This morning MM is going to look at the financials after an email from a subscriber yesterday suggesting we simply split up the market into Resources, Energy, Financials, Growth, Defensive & Speculation and comment on each weekly – made sense, he also noted we hadn’t looked at the Financials for a while. MM is always keen to improve our offering to subscribers, all suggestions are considered very seriously – thanks Lindsay.
ASX200 Chart
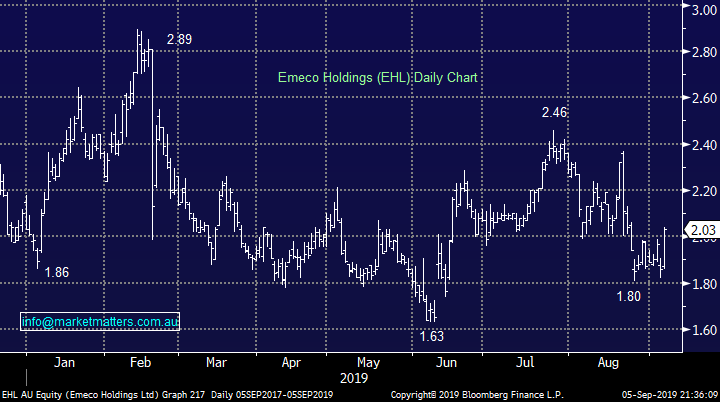
The best performer in the ASX200 yesterday was Emeco Holdings (EHL) which soared over 9% on solid volume but no news – very often the signs of a sustainable bullish move. MM remains a fan of this leaser of earth moving equipment which remains cheap trading on an Est P/E for 2020 of 7.6x but the day to day volatility is not for the fainthearted.
MM is bullish EHL with a target ~30% higher.
Emeco Holdings (EHL) Chart
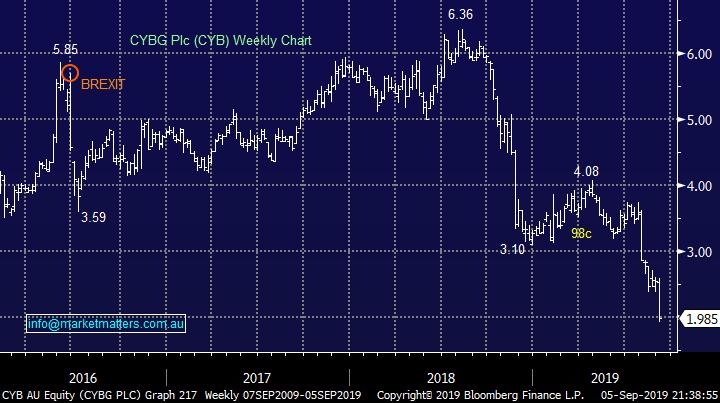
Conversely the worst performer yesterday was UK based bank CYBG Plc (CYB) which plunged another 20% taking its decline over the last year to a painful -67%. The company announced an almost 400% increase in provisions to claims on a bogus PPI product, this is a hit both in terms of $$ and credibility to the board of directors.
Just to rub salt in the wounds of Clydesdale, we feel the outlook for the bank is poor with minimal loan growth, from riskier end of town, while cost of funding is trending in the wrong direction.
MM still has no interest in CYB.
CYBG Plc (CYB) Chart
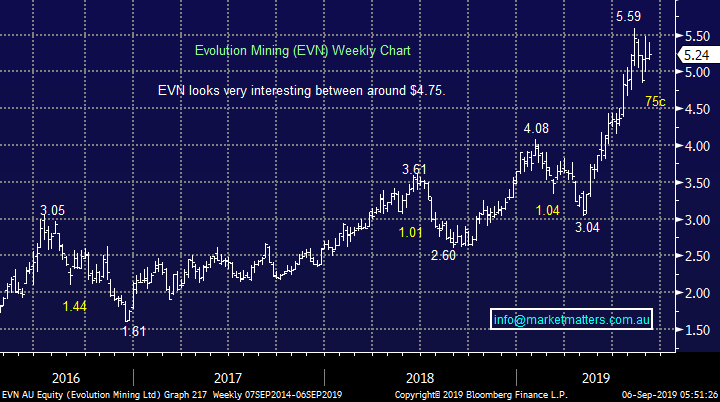
Overnight gold tumbled -$US35/oz / 2.2% on the trade talks news sending the gold miners ETF down around 5%.The local gold sector has already been punished as investors appeared to pre-empt this correction in gold, not helped by the $A finding a floor – our updated ideal entry levels into some well know names are:
Newcrest (NCM) $33.50, Evolution $4.75, Regis Resources (RRL) $4.80 and Northern Star (NST) $11.
MM is looking to re-enter the gold sector into weakness.
Evolution Mining (EVN) Chart
MM’s view on the Financials
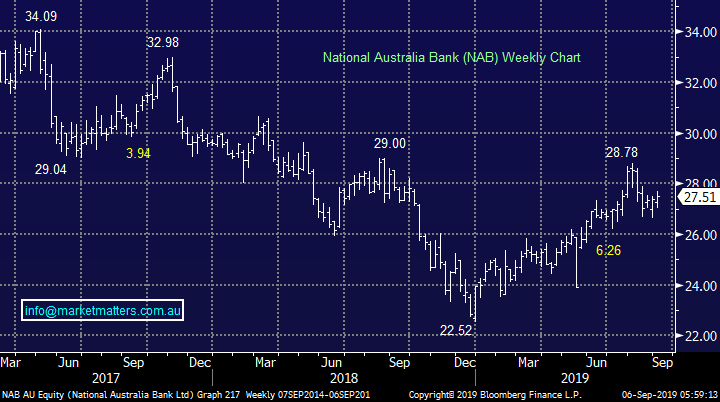
Firstly I have briefly touched on the Banking Index which has moved pretty much in tandem with the ASX200 throughout 2019 – no major surprise considering the “Big Four” currently make up over 20% of our index.
I have used National Australia (NAB) to illustrate our view today as its yielding an attractive 6.6% fully franked dividend, with the next dividend due in November. In the case of NAB, before its next dividend, we are simply buyers around $26 and sellers above $29 hence it may be in inactive period on the banking front but it’s always important to be prepared.
MM is looking to buy weakness & sell strength in the banks.
National Australia Bank (NAB) Chart
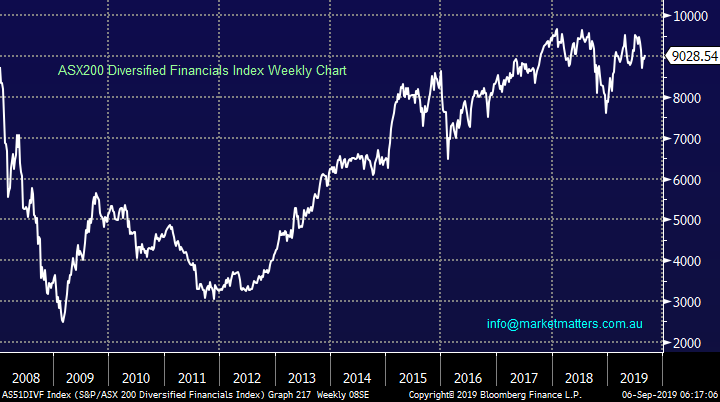
The Diversified Financials are looking interesting after a very mixed year under the hood which has seen at one end of the spectrum Magellan (MFG), Credit Corp (CCP) and ASX Ltd (ASX) rally strongly while the fund managers like Janus Henderson (JHG), IOOF Holdings (IFL), Challenger (CGF) and Perpetual (PPT) have struggled, significantly underperforming the market.
When we look at the index below things look good but over the last year only 36% of the sectors stocks are in positive territory while the average return is down more than 1%. A great example that an index does hide many sins, in this case with only a couple of large cap members making this sector look very healthy on the surface. We feel that the outperformers like the ASX Ltd (ASX) are no longer offering any value as it trades on an Est P/E for 2020 of 32.5x, although many will still like its anticipated 2.9% fully franked yield. Hence this morning I have focused on the battered end of the sector, focusing on 3 stocks, with two very cheap on traditional valuation metrics.
MM is evaluating the sector on a stock by stock basis.
ASX200 Diversified Financials Index Chart
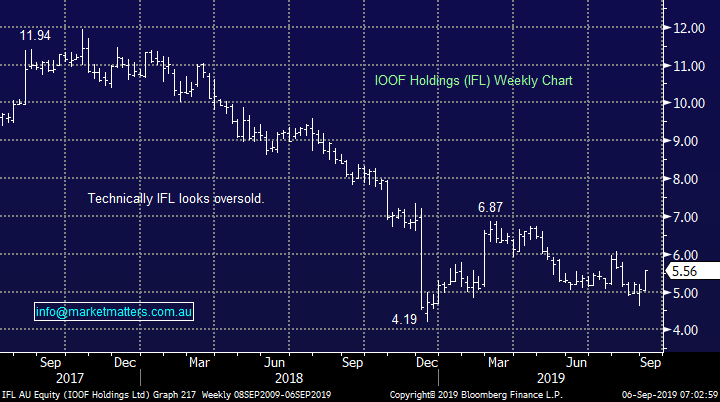
1 IOOF (IFL) $5.56
In the video below discussing the recent reporting season I touched on IFL describing it as a classic deep value play - click here to view.
IFL has literally had the proverbial kitchen sink thrown at it over the last 12-months since it’s looked to buy ANZ’s pension business however in our opinion there’s a lot of bad news built into the share price at today’s level. We can see a number of potential scenarios unfolding in the year ahead which could support the stock.
The stocks currently trading on an Est P/E for 2020 of 12.2x, while yielding 5.6% fully franked – some enticing numbers.
MM likes IFL into weakness.
IOOF (IFL) Chart
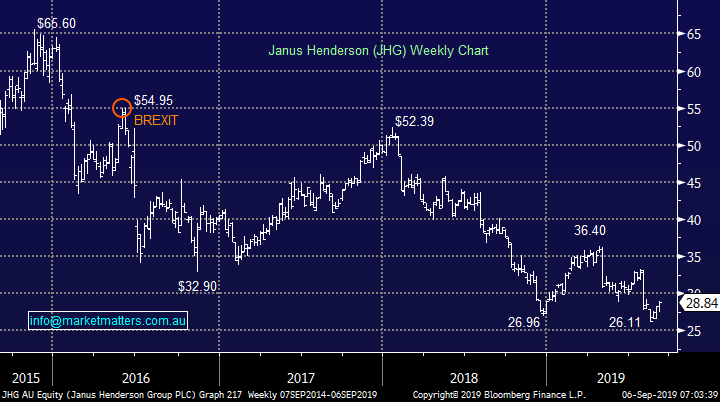
2 Janus Henderson (JHG) $28.84
JHG has been a poor performer for MM but at least we reduced our exposure at higher levels – they fundamentally need to stem the flow of FUM (funds under management) from the business.
The stocks currently trading on an Est P/E for 2019 of 8.2x, while yielding 7.3% unfranked – again some enticing numbers.
MM likes JHG around current levels.
Janus Henderson (JHG) Chart
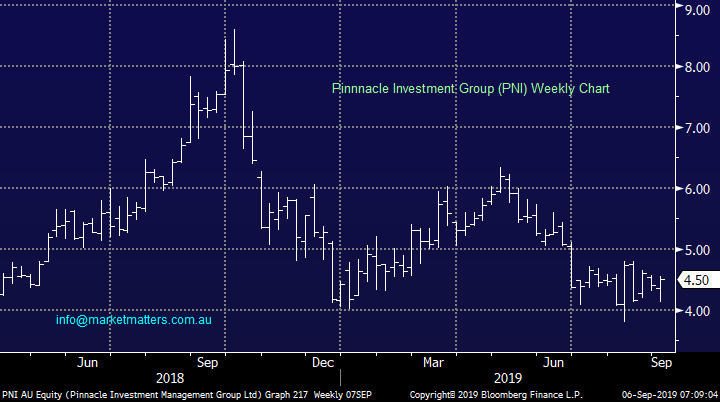
3 Pinnacle Investment Group (PNI) $4.50
Sydney based International investment manager PNI reported good numbers in August lifting net profit 32% to over $30m, on an increase in FUM of 43% to $54.3bn. In our opinion a strong performance of both organic and acquisition growth. We like the stock / company but it’s leveraged to overseas equities hence if / when stocks correct it will struggle at best.
The stocks currently trading on an Est P/E for 2020 of 22.6x, while yielding 3.5% fully franked – not in the cheap corner like the first 2 stocks but it’s down over 40% over the last year leaving plenty of room for a recovery.
MM likes PNI into weakness.
Pinnacle Investment Group (PNI) Chart
Conclusion (s)
MM likes IFL, JHG and PNI into weakness, they look very capable of an explosive recovery if stocks do correct from current levels, our preferred scenario.
We will consider adding IFL or PNI to the Growth Portfolio, at this stage we feel there’s no need to take on the stock specific risk by averaging JHG.
Global Indices
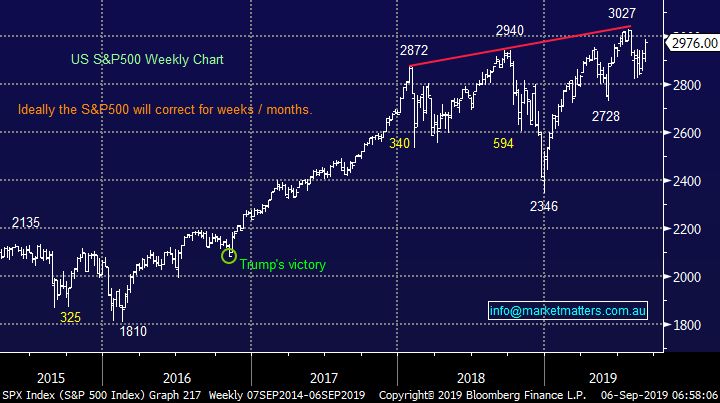
No change yet, we believe US stocks are now bearish as discussed over recent weeks however we now need to see some reception after last night’s elation following the news of pending US – China talk.
US stocks will generate a short-term sell signal below 2935, or 1.4% lower.
US NASDAQ Index Chart
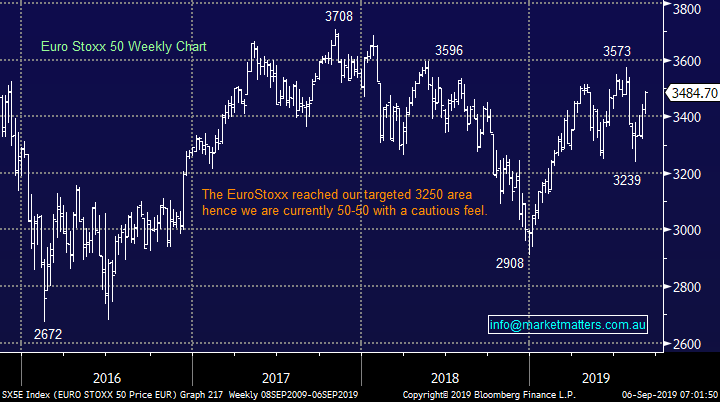
No change again with European indices, while we remain cautious European stocks as their tone has become more bearish over the last few months, however we had been targeting a correction of at least 5% for the broad European indices, and this has now been achieved.
The long-term trend is up hence any “short squeezes” might be harder and longer than many anticipate, perhaps one is unfolding today.
Euro Stoxx 50 Chart
Overnight Market Matters Wrap
· Risk was certainly back on in the US following better than expected data and an ease of US-China trade tension (for now!)
· Crude oil gave back most of its intraday gains as focus shifted back on current oversuply of its inventory.
· The September SPI Futures is indicating the ASX 200 to open marginally higher, testing the 6620 level this morning.
Have a great day!
James & the Market Matters Team
Disclosure
Market Matters may hold stocks mentioned in this report. Subscribers can view a full list of holdings on the website by clicking here. Positions are updated each Friday, or after the session when positions are traded.
Disclaimer
All figures contained from sources believed to be accurate. All prices stated are based on the last close price at the time of writing unless otherwise noted. Market Matters does not make any representation of warranty as to the accuracy of the figures or prices and disclaims any liability resulting from any inaccuracy.
Reports and other documents published on this website and email (‘Reports’) are authored by Market Matters and the reports represent the views of Market Matters. The Market Matters Report is based on technical analysis of companies, commodities and the market in general. Technical analysis focuses on interpreting charts and other data to determine what the market sentiment about a particular financial product is, or will be. Unlike fundamental analysis, it does not involve a detailed review of the company’s financial position.
The Reports contain general, as opposed to personal, advice. That means they are prepared for multiple distributions without consideration of your investment objectives, financial situation and needs (‘Personal Circumstances’). Accordingly, any advice given is not a recommendation that a particular course of action is suitable for you and the advice is therefore not to be acted on as investment advice. You must assess whether or not any advice is appropriate for your Personal Circumstances before making any investment decisions. You can either make this assessment yourself, or if you require a personal recommendation, you can seek the assistance of a financial advisor. Market Matters or its author(s) accepts no responsibility for any losses or damages resulting from decisions made from or because of information within this publication. Investing and trading in financial products are always risky, so you should do your own research before buying or selling a financial product.
The Reports are published by Market Matters in good faith based on the facts known to it at the time of their preparation and do not purport to contain all relevant information with respect to the financial products to which they relate. Although the Reports are based on information obtained from sources believed to be reliable, Market Matters does not make any representation or warranty that they are accurate, complete or up to date and Market Matters accepts no obligation to correct or update the information or opinions in the Reports. Market Matters may publish content sourced from external content providers.
If you rely on a Report, you do so at your own risk. Past performance is not an indication of future performance. Any projections are estimates only and may not be realised in the future. Except to the extent that liability under any law cannot be excluded, Market Matters disclaims liability for all loss or damage arising as a result of any opinion, advice, recommendation, representation or information expressly or impliedly published in or in relation to this report notwithstanding any error or omission including negligence.


