The Santa Claus Rally “Truth or myth?” (CPU, RWC, SVW)
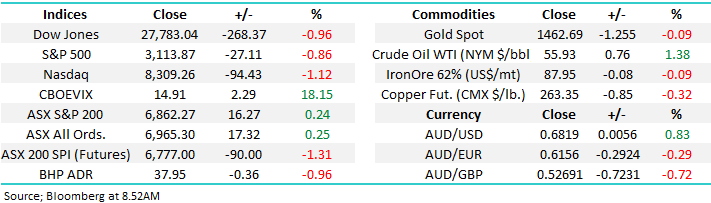
The ASX200 kicked off December on a positive note closing up 16-points, less than -0.5% below its all-time high set last month. The Financials and Healthcare sectors were the backbone of the day’s gains while the Energy stocks again struggled. The main standout on a relatively quiet day was the aggressive selling MOC (market on close) where 10% of the days SPI futures volume was sold in the last 3-minutes of the day – perhaps somebody had a sniff of Trumps overnight intentions on trade? A trader that gets these notes from an investment bank once told me that the movement in the match in Australia relative to the close is a very good indicator of what to expect in international markets that night. i.e. if the market closes lower at 4.10 than it was at 4.00 it’s a negative sign and vice versa, yesterday -15pts was lost in the match – a good precursor to last night’s sell off.
I started writing this report at 9pm last night when the lead headline in the AFR was “Here we go again on house prices” and as we wrote yesterday prices in many Sydney suburbs are scaling the dizzy heights of 2017, not surprising if we consider the RBA are expected to cut Official rates from 0.75% to 0.25% in 2020 - although no change expected when they meet today. Back in 2017 rates were at 1.5%, if Westpac’s Bills Evans is correct and we do see 0.25% in 2020 that represents more than a 80% cut in interest rates in 2-years, a tailwind and a half for risk assts like property and shares.
However a new headline caught both my and clearly the markets eye overnight as President Trump opened up a new trade war front almost like an army general whose trying to fight too many battles at one time. He’s now imposed tariffs on all steel & aluminium shipped to the US from Brazil and Argentina - suddenly out of nowhere a global trade war looks far more likely and the ASX200 is poised to open down close to 100-points this morning. For good measure he also continued his tirade towards the Fed wanting lower interest rates to devalue the $US making the US more competitive on the global stage.
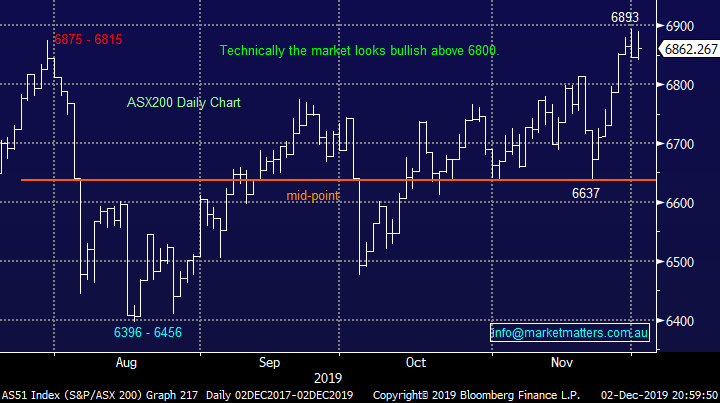
MM is again neutral the ASX200 – a frustrating range still playing out locally
Overnight US markets were driven lower by Trumps move against Brazil and Argentina with the Dow closing down over 260-points and the ASX200 looks set to follow it and Europe which actually fared far worse with the German Dax, French CAC and Eurostoxx all tumbling over 2%, the SPI futures are pointing to 90-point drop this morning – ouch! If the US market is a guide to where the pain will be felt today the Real Estate & IT Sectors were the worst performing in the S&P500, both down over 1%.
This morning MM has looked at the characteristic of December as the months poised to start badly yet the “Santa / Christmas rally” is almost expected by many investor’s, we question if its characteristics are fully understood by the very same people.
ASX200 Chart
3 stocks we like from a technical perspective
When MM talks about “technicals” its with reference to pattern recognition i.e. what usually comes after the moves we are currently experiencing combined with simple risk reward. Obviously these technicals have to agree with our fundamental view for a stock and its sector for us to consider investing but the technicals sometimes make us delve deeper into a stock that had not previously been on our shopping list.
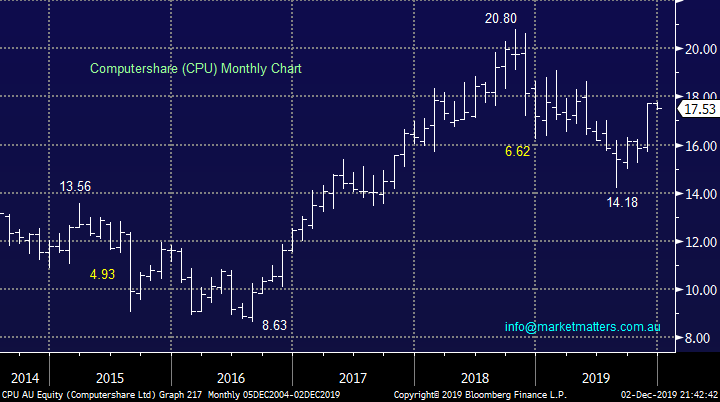
1 Computershare (CPU) $17.53
MM has been watching this share registry business carefully in 2018/9, correctly calling it lower this year only to reverse our feelings in recent weeks as the risk / reward favoured a rally. The stock had been under pressure as the ASX Ltd.’s blockchain potential growth leaves many questioning the future for CPU but perhaps the ASX has its eyes on CPU to kickstart the next step of its evolution. MM would particularly like the risk / reward around $17, only a few % lower.
MM likes CPU with stops below $16.20, or 8% lower.
Computershare (CPU) Chart
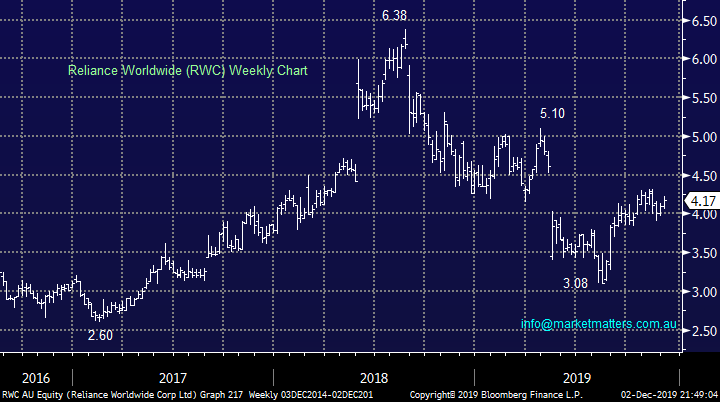
2 Reliance Worldwide (RWC) $4.17
The plumbing business RWC shares have experienced a similarly tough time as CPU with a sell down by the previous Chairman plus a lack of “winter freeze” in the US being two major headwinds. We feel the worse is behind this $3.3bn business especially as fiscal stimulus is expected in 2020 which should become a tailwind, while the current Est P/E for 2020 of 20.9x is not too challenging.
MM is bullish RWC with ideal entry sub $4.
Reliance Worldwide (RWC) Chart
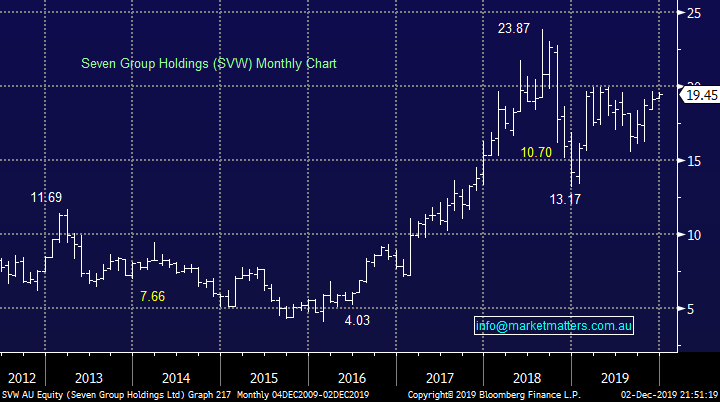
3 Seven Group Holdings (SVW) $19.45
The Stokes family’s investment vehicle SVW has its fingers in a number of pies including media & TV, publishing, Telco and heavy equipment dealership that operates Caterpillar dealerships – the later exposure we particularly like.
The stocks trading on a conservative Est P/E for 2020 of 13.3x while the 2.2% fully franked yield is better than cash – we like the stock with short-term stops below $18.
MM is bullish SVW expecting a breakout above $20 shortly.
Seven Group Holdings (SVW) Chart
Delving into the ghosts of Xmas rallies.
It’s easy to stand back and quote that over the last 10-years the average return by the ASX for December is +1.6% however we believe this is a subject where the devils very much in the detail. Post the GFC on a pure average basis December is only the 4th best month of the year, not what many would imagine considering all the fanfare around the Christmas rally.
We have gone through the last decades gyrations by the ASX200 for the last month of the year, importantly by hand as opposed to computer, as we look for characteristics and nuances which can add some value / alpha before we start thinking about Santa sliding down the chimney.
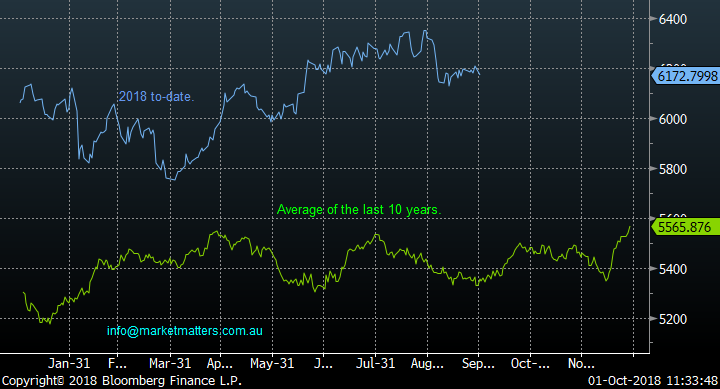
Below is a chart we published last September illustrating that Decembers average inflection point (bottom) is usually in the middle of the month with the high at the end, considering we are set to open down around 100-points this morning a drop for the next 10-days or so would not surprise but as we alluded to earlier averages only tell half the tail.
The “average” ideal time to buy the ASX200 in December is mid-month.
ASX200 Seasonality Chart
After “playing” with the numbers last night for the ASX200 over last decade over a cup of tea – would normally be a glass of vino however I’m battling both the flu and a case of gout!! the below 5 points stood out:
1 – On 4 occasions the market bottomed mid-month, 4 times in the first week and twice at the end of the month – no clear pattern here as the averages above would suggest.
2 – Only on one occasion in 2011 did the market fail to rally / bounce in December, the ensuing rally from December’s low on the other 9 occasions averaged a whopping 275-points with the smallest being 155-points.
3 - Pullbacks in December appear to be split into 2 groups on 4 occasions they are inconsequential while on 5 occasions they average over 200-points – the later feels very possible after Trumps move last night.
4 – The average return for the last 7 trading days of December is +120-points while it didn’t close negative on any single occasion.
5 – However under the hood of these last 7 sessions on 4 occasions the average return was over 200-points while 5 times it was less than 60-points, in other words when she goes she really goes!
6 – Not surprisingly the more the market falls into mid-late December the more aggressive the springboard like rally that follows.
We strongly believe the “Christmas Rally” is more about not selling as opposed to aggressive buying but the net result is the same i.e. why would fund managers dump stocks into December as it will damage their annual calendar returns and potentially bonuses in the process.
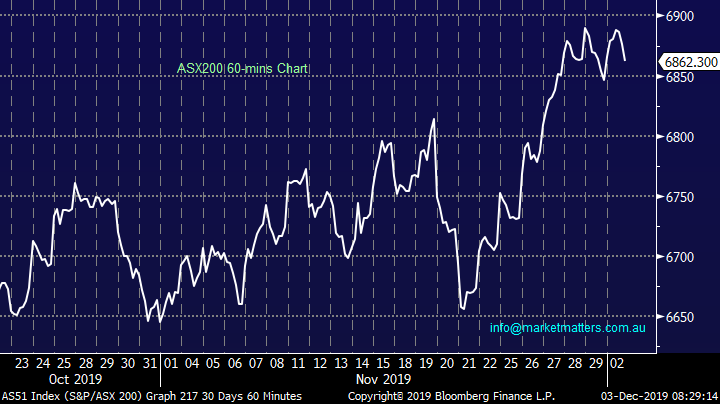
The million dollar question today is how far will the current pullback go, 6800 support will go early today hence a test of 6650-6700 should not be ruled out from a technical perspective.
ASX200 Short-term Chart
When we look at the above 5 points MM thinks 3 conclusions can be drawn with comparative ease:
1 The risk / reward favours buying the ASX200 during December into weakness – potentially accumulate every 50-points after an initial 150-point decline.
2 – The ASX200 half of the time has corrected ~200- points in December before finding a springboard to rally strongly into the months end.
3 – Traders never want to be short stocks in the last 7-10 days of December.
Conclusion (s)
Statistically the ideal area to start going long stocks basis the ASX200 is sub 6750.
Global Indices
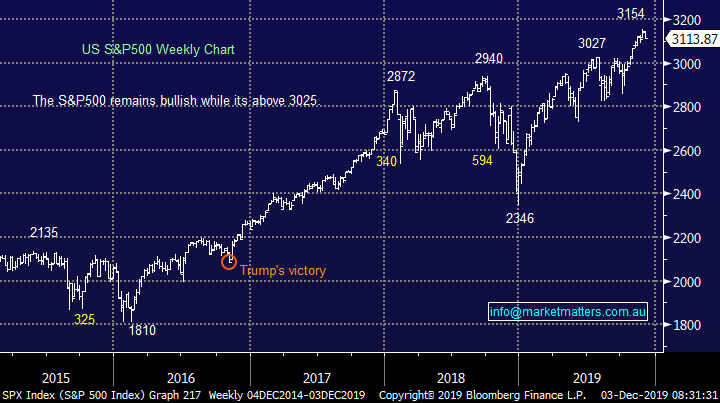
No change, previously we have given the benefit of the doubt to the post GFC bull market and fresh all-time highs have been achieved as anticipated, a close well under 3025 is required for the S&P500 to switch us to a bearish short-term stance.
MM remains now neutral / positive US stocks.
US S&P500 Index Chart
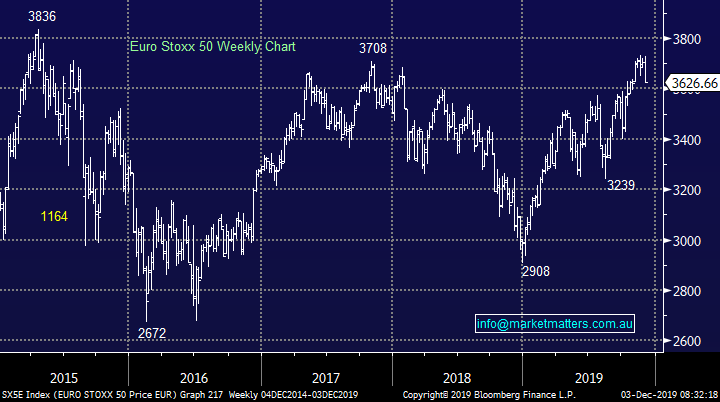
European indices continue to “climb a wall of worry” at this point in time MM is neutral but we maintain our slight positive bias with a target ~5% higher looking realistic.
EuroStoxx50 Chart
Overnight Market Matters Wrap
- The US and European equity markets sold off overnight as global trade concerns reignited after US President Trump hinting new tariffs on China as well as reinstating levies on steel and aluminium from Argentine and Brazil.
- A decline in US manufacturing didn’t assist the global trade woes and helped the US investors to remove risk from the table.
- BHP is expected to underperform the broader market after ending its US session off an equivalent of 0.96% from Australia’s previous close with the Aussie battler currently sitting above US68.c.
- The December SPI Futures is indicating the ASX 200 to open 87 points lower, testing the 6775 level this morning.
Have a great day!
James & the Market Matters Team
Disclosure
Market Matters may hold stocks mentioned in this report. Subscribers can view a full list of holdings on the website by clicking here. Positions are updated each Friday, or after the session when positions are traded.
Disclaimer
All figures contained from sources believed to be accurate. All prices stated are based on the last close price at the time of writing unless otherwise noted. Market Matters does not make any representation of warranty as to the accuracy of the figures or prices and disclaims any liability resulting from any inaccuracy.
Reports and other documents published on this website and email (‘Reports’) are authored by Market Matters and the reports represent the views of Market Matters. The Market Matters Report is based on technical analysis of companies, commodities and the market in general. Technical analysis focuses on interpreting charts and other data to determine what the market sentiment about a particular financial product is, or will be. Unlike fundamental analysis, it does not involve a detailed review of the company’s financial position.
The Reports contain general, as opposed to personal, advice. That means they are prepared for multiple distributions without consideration of your investment objectives, financial situation and needs (‘Personal Circumstances’). Accordingly, any advice given is not a recommendation that a particular course of action is suitable for you and the advice is therefore not to be acted on as investment advice. You must assess whether or not any advice is appropriate for your Personal Circumstances before making any investment decisions. You can either make this assessment yourself, or if you require a personal recommendation, you can seek the assistance of a financial advisor. Market Matters or its author(s) accepts no responsibility for any losses or damages resulting from decisions made from or because of information within this publication. Investing and trading in financial products are always risky, so you should do your own research before buying or selling a financial product.
The Reports are published by Market Matters in good faith based on the facts known to it at the time of their preparation and do not purport to contain all relevant information with respect to the financial products to which they relate. Although the Reports are based on information obtained from sources believed to be reliable, Market Matters does not make any representation or warranty that they are accurate, complete or up to date and Market Matters accepts no obligation to correct or update the information or opinions in the Reports. Market Matters may publish content sourced from external content providers.
If you rely on a Report, you do so at your own risk. Past performance is not an indication of future performance. Any projections are estimates only and may not be realised in the future. Except to the extent that liability under any law cannot be excluded, Market Matters disclaims liability for all loss or damage arising as a result of any opinion, advice, recommendation, representation or information expressly or impliedly published in or in relation to this report notwithstanding any error or omission including negligence.


