The “risk on” button appears to being pressed into the G20 (ANN, SFR, WOR, STO, FB US, AAPL US)
The ASX200 meandered through another choppy and quiet day with the market finally closing down just 17-points with losers outstripping the winners by well over 2:1, however any major movement was thin on the ground with only 1% of the market moving by more than 5%. Even on the sector level it was a lacklustre affair with only the Telcos and Utility sectors falling by ~1% implying some investors taking a little profit after these sectors have rallied strongly on the coattails of plunging bond yields– actually a minor “risk on” bias which is unusual on a down day.
The EOFY is now only 2 trading days away and some classic tax loss selling appears to be drifting into some of the “dogs” of the last 12-months, unfortunately 3 of which we own – Orocobre (ORE), Emeco Holdings (EHL) and Janus Henderson (JHG). Hopefully the reverse will kick in with some of the outperforming names we hold e.g. Bingo (BIN), Healius (HLS), NIB Holdings (NHF) and Iluka (ILU). If any of these names do receive a nice shove higher over the next 48-hourts don’t be surprised to see us lock in some $$.
Over the last few months the local market has continued to shrug off company downgrades with ~20 stocks in the ASX200 disappointing the market, if it wasn’t for Australian 3-year bond yields more than halving in 2019 we would usually expect this performance on the corporate level to significantly punish local stocks. However for now investors who have been caught “long cash” are focusing on interest rates as opposed to company performance, importantly in our opinion this cannot last forever. We have remained fairly well invested in stocks throughout 2019 but the risk / reward is feeling less attractive by the day, especially if we get an optimistic pop on the upside courtesy of hopes of a positive outcome from the G20 meeting on US – China trade.
MM is now in “sell mode” looking to adopt a more conservative stance than over the previous 6-months.
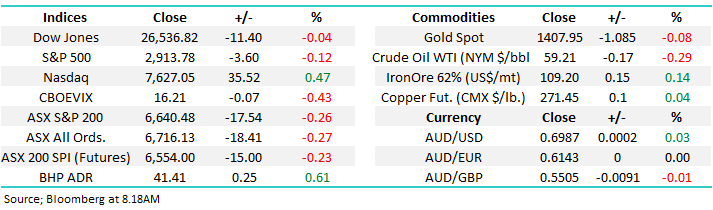
Overnight US stocks closed basically unchanged with the SPI pointing to a 20-point drop early although BHP is up 26c in the US.
In today’s report we have looked at 5 “risk on stocks” that look ok for the brave, even after equities have soared in 2019.
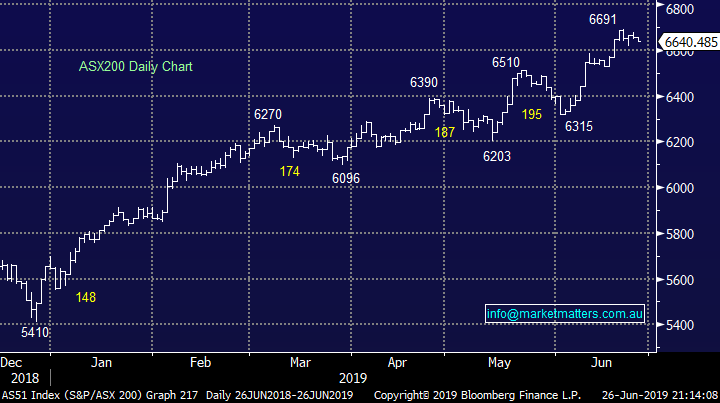
ASX200 Chart
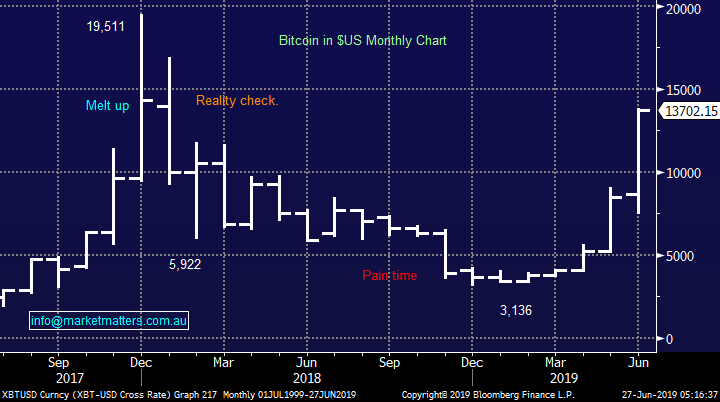
This is more a point on risk appetite / interest rates as opposed to an investing idea, Bitcoin has now rallied over 40% this week & 60% this month, illustrating there’s certainly plenty of “hot money” looking for a home. This surge in the major crypto currency reinforces a point we’ve been making over recent months i.e. remain open-minded to where / how stocks / markets can move, with bond yields now trading down into uncharted territory nothing should be considered out of the question.
However interestingly most of the lower tier crypto’s have hardly rallied in comparison so perhaps we have irrational exuberance in the quality end of town, probably a first!
Bitcoin ($US) Chart
Previously we’ve talked about the enormous volume and impact of buybacks in the US, in 2018 the dollar figure was over $US1 trillion and in 2019 the purchases in Q1 of 2019 imply this year will match last year’s record. Data compiled by Ned Davis Research shows the S&P 500 would be 19% lower between 2011 and the first quarter of 2019 without any buybacks, even if they are a touch off with their maths the major tailwind for equities is undeniable over recent times.
Hence locally it should come as no surprise that shares enjoying buybacks have performed strongly. The 2 groups that matter to MM are the stocks who have completed a decent % of their announced buyback and those who have relatively little left, unless of course they announce more:
1 – Over 85% of buyback remaining: Ansell (ANN), Bingo (BIN), Brambles (BXB), Fortescue (FMG), Platinum (PTM), Scentre Group (SCG) and Sims Metals (SGM).
2 – Under 15% of buyback remaining: BlueScope Steel (BSL), Capitol Health (CAJ), Incitec Pivot (IPL), QANTAS (QAN) and South32 (S32).
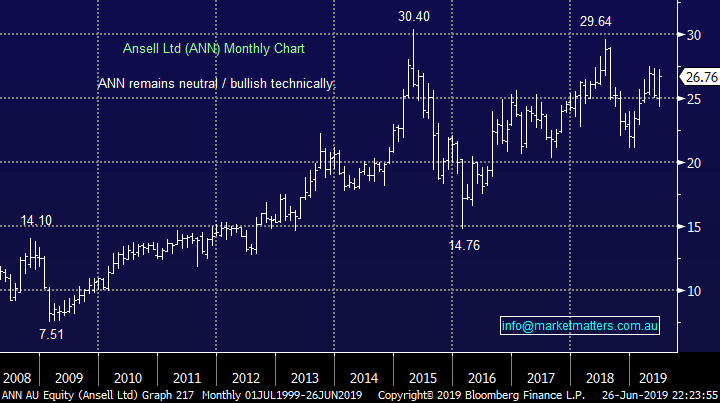
While there are many more pieces of the puzzle remaining before we buy or sell a particular stock, buyback numbers can reinforce our view on a company and its shares Genworth (GMA) is an example we used in the income note this week – of those listed above technically we like Ansell (ANN) and Brambles (BXB), the buyback adds a nice tick to our research.
Ansell (ANN) Chart
Looking at 5 risk / on stocks for next Financial Year
We have already mentioned bitcoin earlier, arguably the largest “risk on” trade of all in 2019, plus the light selling we saw in Australian Utilities and Telco’s yesterday. Interestingly overnight the market was lifted by the Energy & IT stocks whereas Consumer Staples, Healthcare, Real Estate and Utilities all fell by over 1%, another classic example of a “risk on” session although at MM we could interpret it slightly differently and say investors are cashing in on the almost panic like hunt for yield witnessed so for this year.
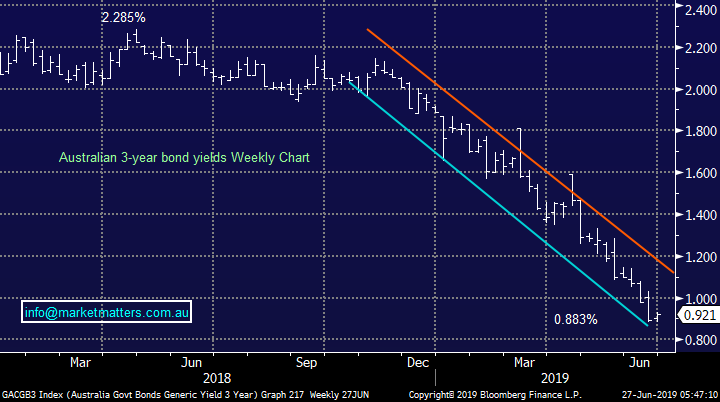
The more than 50% plunge in Australian 3-year bond yields we believe now requires further poor economic news to take rates / yields down to the next level implying some profit taking in the “yield play” end of town - this makes perfect sense i.e. there is already plenty of bad news baked into this cake.
MM would not be blindly chasing yield at this stage of the cycle.
Australian 3-year Bond yields Chart
If cash are considering rotating out of the yield play we’ve highlighted a few “risk on” stocks that may benefit from the reallocation of funds. However as we are generally looking to move towards a more defensive portfolio stance all of these ideas come with a clear stop.
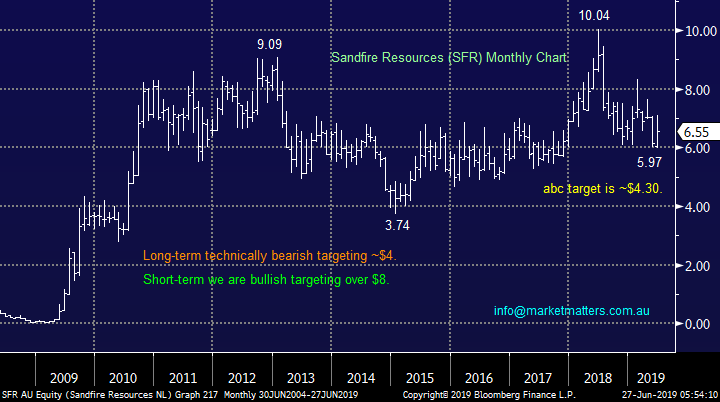
1 Sandfire Resources (SFR) $6.55.
Copper has corrected ~10% in 2019 and its closer to 20% below its 2018 highs. A positive resolution on US – China trade should act as at least a short-term positive tailwind for the copper price making this clearly a play on Trump & Xi, as well as the business itself.
SFR has made a bid for MOD Resources which on balance we believe is positive for the business - tripling its cashflow time from 3-4 years to 12-years. The revised $167m offer has already been accepted by the MOD board and the Botswana exposure from this deal is historically far more stable than the likes of Indonesia, Philippines plus most of Africa. Importantly SFR is cheap trading on an Est P/E for 2019 of 9x while actually yielding ~4% fully franked with its next dividend due in August.
MM is short-term bullish SFR with stops below $6.20 or ~5%.
Sandfire Resources (SFR) Chart
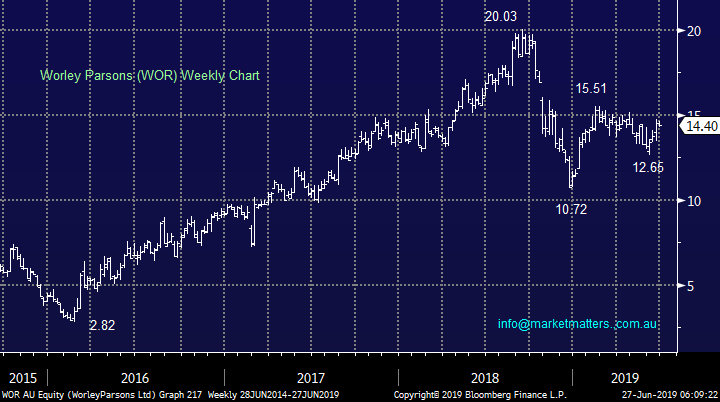
2 Worley Parsons (WOR) $14.40
The engineering company’s shares have struggled following their $4.55bn acquisition of Jacobs Engineering Group’s Energy, Chemicals and Resources division – not an unusual outcome with the market generally sceptical of integration risks associated with a large deal. However over the last 6-months the stocks calmed down and we believe it’s now providing a reasonable risk / reward opportunity for investors prepared to accept ~13% downside potential
Technically WOR is forming a classic bullish / pennant pattern with a break towards $16 looking on the horizon.
MM is bullish WOR with stops below $12.50.
Worley Parsons (WOR) Chart
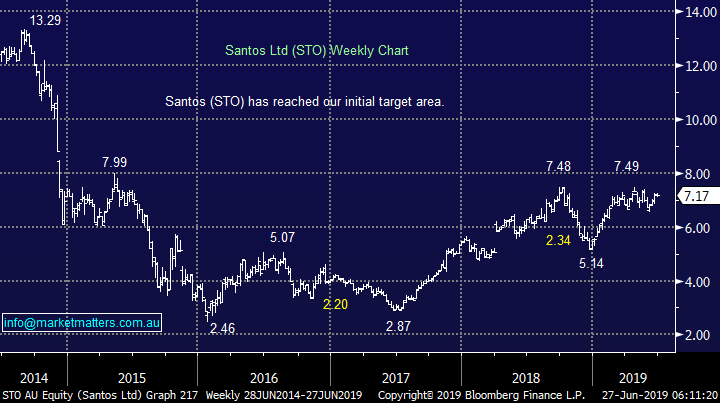
3 Santos (STO) $7.17
MM had been anticipating STO would struggle after reaching our initial $7.50 target area but its resilience while the oil price struggled has really caught our attention. We actually saw some reasonable flow through the desk on STO yesterday with some reasonable buy lines from strong performing funds.
Technically STO now looks poised for an assault on the $8 area, or over 10% higher.
MM likes STO for a “pop” towards $8, stops below $6.50.
Santos (STO) Chart
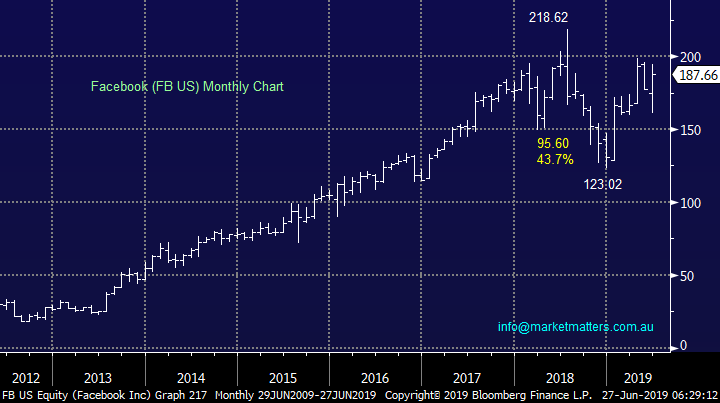
4 Facebook (US FB) $187.66
While buying the US IT space now sort of feels like we’re arriving late to the party, there are still opportunities within a very diverse sector. Social media giant Facebook is a stock we like as it continues to monetise it’s ‘know everything about everyone’ platform. There are of course regulatory risks , however a broken up FB may actually unleash more value for shareholders.
Technically we can still see fresh all-time highs by FB but the risk / reward is only ok with stops required ~14% lower.
MM likes FB for a “pop” towards $US220, stops below $US160.
Facebook (US FB) Chart
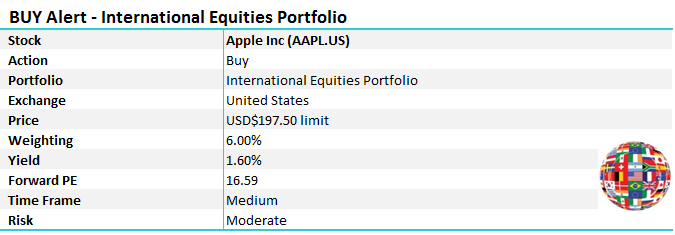
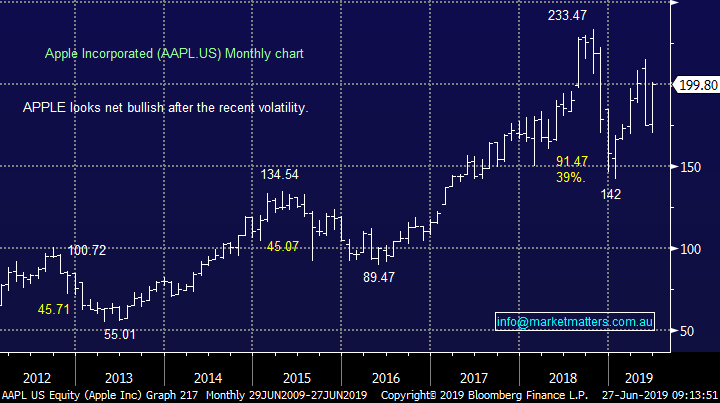
5 Apple (US AAPL) $US199.80
For those that missed it yesterday’s we said – “Apple has been experiencing a correction of late due to fears of deteriorating trade between the US and China. The company’s latest numbers showed they realised $US11.58bn profit on $US58bn revenue with services revenue hitting an all-time high although gross margins fell from 38.3% to 37.6% - plus they announced yet another $75bn in share buybacks which is likely to be just one more of many as they sit on literally “buckets” of cash.
We see solid value in Apple around $US195 with buybacks, large cash balance etc i.e. at this price investors are not paying any premium for growth.
While we acknowledge the current iPhone product cycle is going poorly especially in of course China the business is looking to allay concerns around life after just selling phones / iPads by increasing its services revenue. Stocks with leverage to China have been sold down aggressively on trade concerns but we feel the risk / reward is now attractive with plenty of bad news built into the price.
MM likes Apple around the $US195 area.”
Hence, overnight we went long Apple for our freshly launched Overseas Portfolio which was just filled with an intra-day low overnight of $US197.35 – phew!
Apple (US AAPL) Chart
Conclusion (s)
Of the 5 “risk on” stocks we looked at today our favourite short—term plays are Santos (STO) and Worley Parsons (WOR) locally, both from our Energy sector plus of course Apple from the US which we purchased overnight.
Global Indices
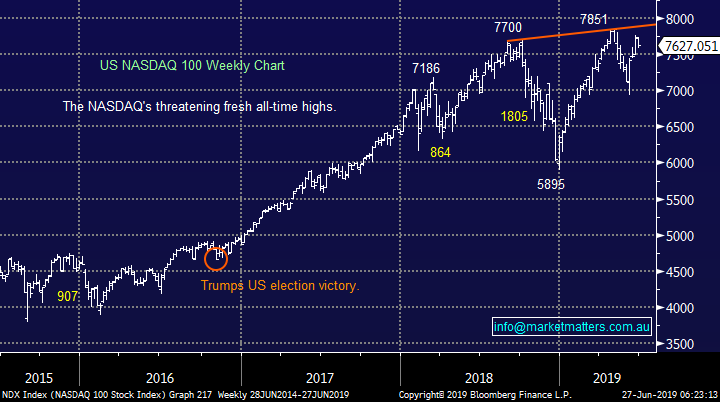
Interestingly while the broad based S&P500 and small cap Russell 2000 are generating a few short-term sell signals the IT based NASDAQ looks poised to make a fresh all-time high – perhaps on positive news from the G20 meeting.
The technical target for the NASDAQ is ~3% higher.
US NASDAQ Index Chart
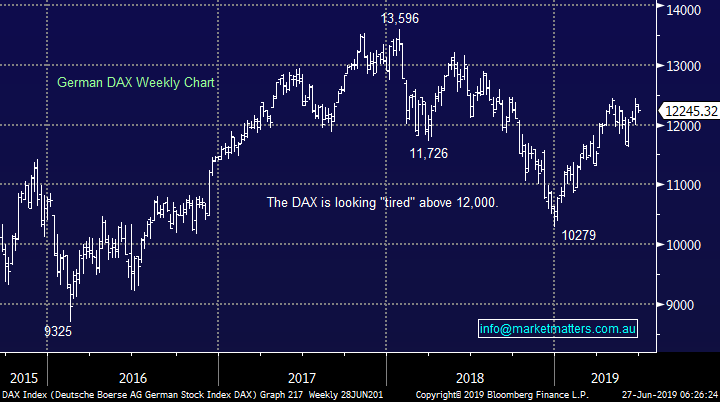
No change again with European indices, we remain cautious European stocks but the tone has improved recently and fresh highs in 2019 look a strong possibility.
German DAX Chart
Overnight Market Matters Wrap
· The US gave up early gains to close little changed ahead of this weekend’s G20 meeting of the leading economies in Osaka, Japan, when US President Donald Trump and China’s President Xi Jinping are due to meet to discuss the current US-China trade war.
· The markets were buoyed in early trading, with the Dow up about 100pts, after US Treasury Secretary Steven Mnuchin said he thought there was a path for the US and China to complete a trade deal. President Trump also said that a trade deal was possible but that he was happy with the current tariffs from which the US is “taking in a fortune”. Markets ran out of steam, and the Dow closed 11pts lower. The NASDAQ closed 0.3% higher, helped by a rally in semi-conductor shares, led by Micron Technology, which jumped 13% after it announced it had “lawfully” resumed sales to China’s telco group Huawei.
· The gold price eased back from its recent 6 year high, while crude oil rallied after weekly figures from the EIA showed an unexpected large drop in US inventories of 12.8mmbbls driven by increased exports and domestic gasoline demand.
· Iron ore prices also rallied to 5 year highs, while base metals were mixed, with BHP expected to outperform the broader market after ending its US session up an equivalent of 0.61% from Australia’s previous close.
· The September SPI Futures is indicating the ASX 200 to open 21 points lower, with June equity options expiry this afternoon.
Have a great day!
James & the Market Matters Team
Disclosure
Market Matters may hold stocks mentioned in this report. Subscribers can view a full list of holdings on the website by clicking here. Positions are updated each Friday, or after the session when positions are traded.
Disclaimer
All figures contained from sources believed to be accurate. Market Matters does not make any representation of warranty as to the accuracy of the figures and disclaims any liability resulting from any inaccuracy. Prices as at 27/06/2019
Reports and other documents published on this website and email (‘Reports’) are authored by Market Matters and the reports represent the views of Market Matters. The MarketMatters Report is based on technical analysis of companies, commodities and the market in general. Technical analysis focuses on interpreting charts and other data to determine what the market sentiment about a particular financial product is, or will be. Unlike fundamental analysis, it does not involve a detailed review of the company’s financial position.
The Reports contain general, as opposed to personal, advice. That means they are prepared for multiple distributions without consideration of your investment objectives, financial situation and needs (‘Personal Circumstances’). Accordingly, any advice given is not a recommendation that a particular course of action is suitable for you and the advice is therefore not to be acted on as investment advice. You must assess whether or not any advice is appropriate for your Personal Circumstances before making any investment decisions. You can either make this assessment yourself, or if you require a personal recommendation, you can seek the assistance of a financial advisor. Market Matters or its author(s) accepts no responsibility for any losses or damages resulting from decisions made from or because of information within this publication. Investing and trading in financial products are always risky, so you should do your own research before buying or selling a financial product.
The Reports are published by Market Matters in good faith based on the facts known to it at the time of their preparation and do not purport to contain all relevant information with respect to the financial products to which they relate. Although the Reports are based on information obtained from sources believed to be reliable, Market Matters does not make any representation or warranty that they are accurate, complete or up to date and Market Matters accepts no obligation to correct or update the information or opinions in the Reports. Market Matters may publish content sourced from external content providers.
If you rely on a Report, you do so at your own risk. Past performance is not an indication of future performance. Any projections are estimates only and may not be realised in the future. Except to the extent that liability under any law cannot be excluded, Market Matters disclaims liability for all loss or damage arising as a result of any opinion, advice, recommendation, representation or information expressly or impliedly published in or in relation to this report not with standing any error or omission including negligence.


