The path of most pain clearly remains up! (CBA, BHP, CSL, STO, TCL, SYD)
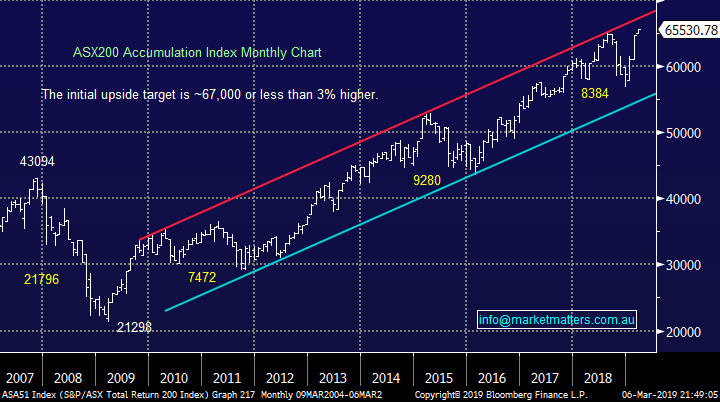
The ASX200 rallied to a fresh 26-week high even though it was again given plenty of reasons to pullback - it simply continues to ignore negative news – a great sign of a strong market. The market has now risen 836-points / 15.5% in a straight line from its late December panic sell off taking the much watched ASX200 to within 2% of its 2018 high, but the ASX200 Accumulation Index (including dividends) has now reached a fresh all-time high, less than 3% below major overhead resistance which has contained the market uptrend since the GFC bottom in Q1 2009 – see below chart. When we consider Australian property at the moment it’s certainly not a case of all assets are rising on the same tide but as we said earlier in the week it seems we are witnessing the previously unheard of switch from property into equities.
Yesterdays strength was again across the boards with less than 25% of the index closing in the red and if I was to sum up the day, like much of 2019, it would be that the local market continues to encounter a distinct lack of selling. It still feels like many fund managers have been caught napping and are significantly underweight Australian stocks just as a number of the macro concerns have gone quiet, at least for now.
Amazingly it doesn’t yet feel like we have experienced a panic style FOMO (Fear of missing out rally), perhaps a sharp push to test red resistance line shown below – however we could argue that we are “popping” higher on a relative basis i.e. the Dow has fallen over 600-points over the last 2-weeks while the ASX200 has rallied 3%, why I can hear subscribers think:
We feel investors continue to move capital to countries where interest rates are likely to be lowest which by definition results in a weaker currency in this case making Australian stocks more attractive to overseas investors holding $US for example - the ASX200 like US stocks is down in $US terms over the last few weeks. However there is always an “uncle point” with this theory - if the economy weakens too far leading to painful recession which generally results in a rush for the exits. Take the banks for instance, a 50bp cut to interest rates as forecast by Westpac & UBS would hit bank earnings by $2.2bn if passed on it full, that’s an 8% hit.
We certainly have been correct with our forecast the 2019 / 2020 would be exciting and full of opportunity!
Fundamentally
Yesterday we saw the Australian economy slip closer to a recession with growth numbers (GDP) coming in far worse than expected causing the “Aussie battler” to fall ~1% towards the psychological 70c area – undoubtedly our view that the $A will see 80c against the $US before 60c is certainly running against the current tide of economic data.
At this stage we will sit with our $A call as an Australian recession and a booming US economy is pretty much baked into the 70c price leaving surprises in our direction but we will remain open-minded to being wrong.

The local stock market is clearly in a strong “glass half full” mood as it focuses on lower interest rates as opposed to a potential recession - which is both looking closer by the month - and is what sent equities crashing in December - invest / trade what you see not what you think would certainly have helped us all in 2019. The current bullish trend reminds me of a quote from famous stock trade, Jesse Livermore; ‘Markets are never wrong, opinions often are’.
Perhaps investors are listening to the RBA who said yesterday that “a residential slowdown does not pose a threat to economic activity and its unlikely to derail our economic expansion” – we all hope they are correct.
Statistically
The ASX200 is literally blowing away all of its usual statistical comparisons although we shouldn’t be totally surprised by some outperformance after the aggressive declines in H2 of 2018 i.e. over the last 10-years the average move for January is -0.47%, followed by +7.35% into the end of April – we all know that May / June is seasonally the weakest time for stocks averaging a decline of over -4.5%. So far, only a few days into March and we are already up well over 10% for 2019, that’s both a range and performance extension of almost 50%.
MM is now neutral the ASX200 after its +15% rally from late December lows.
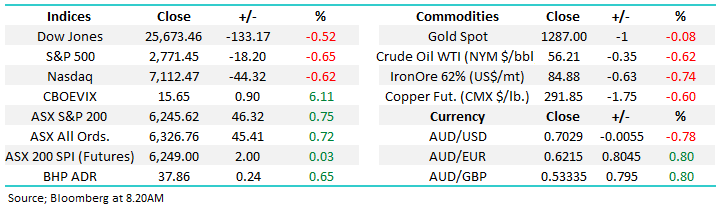
Overnight US markets were again week with the Dow down -133-points but the SPI is still pointing a marginally positive open by the local index.
Today we are going to stand back and look at a few influential stocks that will feed into our game plan / thinking for the rest of this financial year.
ASX200 Accumulation Index Chart
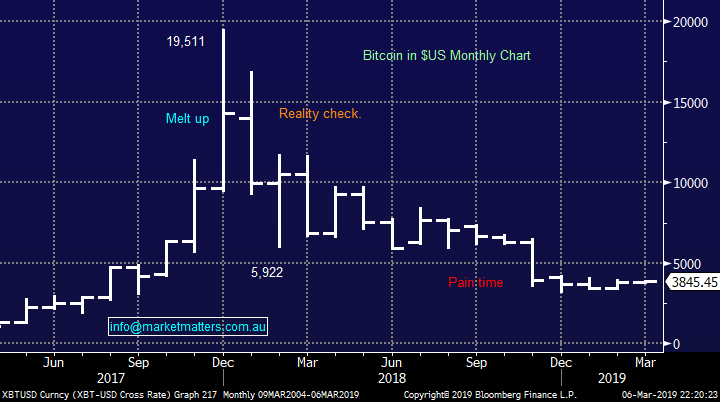
Bitcoin has gone from hero to villain in just over one year, pretty much as we expected. Investors should not have become too carried away with the degree of crypto currency press coverage – its estimated that less than 2% of Americans have invested / punted in bitcoin compared to over 55% that have at least dabbled in shares.
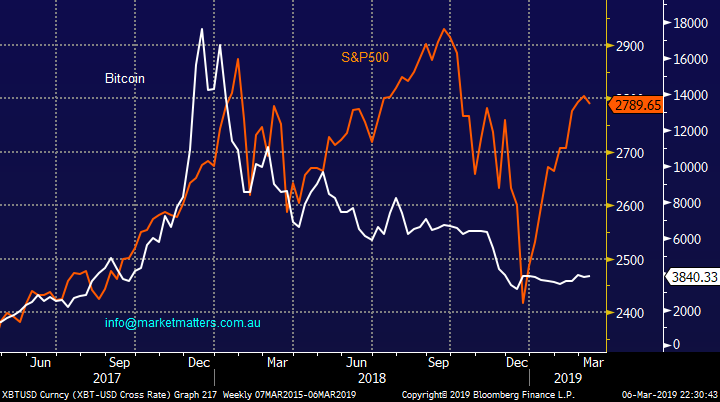
However during 2017 / 2018 rallies in bitcoin often led the way for stocks which was easy to comprehend i.e. investors / traders would only pour monies into the high risk bitcoin when confidence levels were high. However in 2019 bitcoin has struggled to get off the canvas while stocks have rallied strongly, the correlation looks to have been short-lived, potentially similar to Bitcoin itself.
MM is no longer watching Bitcoin as an stock market / asset indicator.
Bitcoin Chart
Bitcoin v US S&P500 Chart
Global stock markets
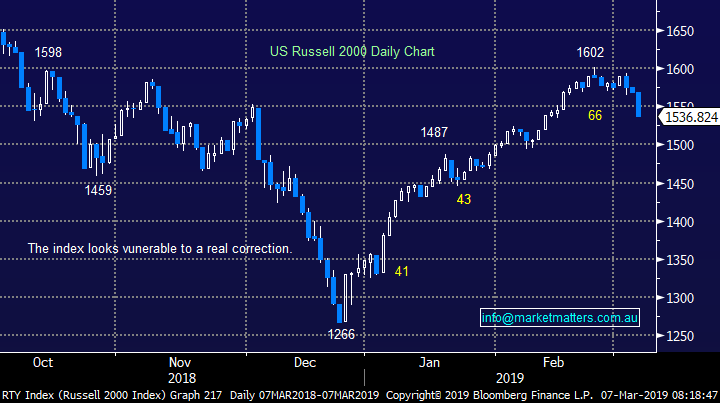
The small cap Russell 2000 which we often use as a leading indicator for US stocks has struggled over recent days and closed over 4% below its recent high this morning but just as we pointed out earlier its having no effect locally – we actually sense during our daytime investors / fund managers are buying Australia (SPI) and selling the US (S&P500)which implies our recent outperformance may have further to run.
We would avoid stocks that are highly correlated to the US at this point in time e.g. Macquarie Bank (MQG).
US Russell 2000 Chart
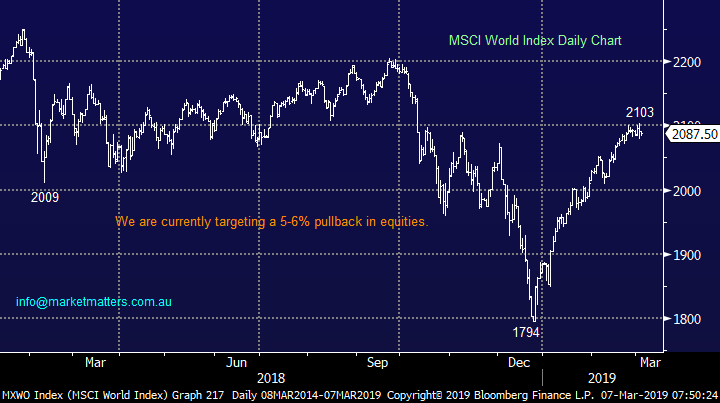
Even with the boom in Chinese stocks the global world index is coming off the boil slightly – not the ASX200 as we have discussed. History tells us that local stocks can only ignore negative influences from international stocks for so long but it’s usually longer than many expect.
Increasing our equities exposure moving forward may be accompanied by purchasing a negative facing ETF.
MSCI World Equities Index Chart
Where should we invest for the remaining 30% of this financial year?
MM was a rare bullish breed back in December 2018, even if we fired a few shots too early however we never for one moment thought the ASX200 would by trading ~6250 by March and hence we have taken a few profits too soon, the important question is what now – remember to “look forward not back as it’s the way you’re travelling”.
Interestingly during the markets surge we have not seriously considered reducing our overweight position in the banks, perhaps a sign that the ASX200 was going to struggle to experience a meaningful correction.
The Banks
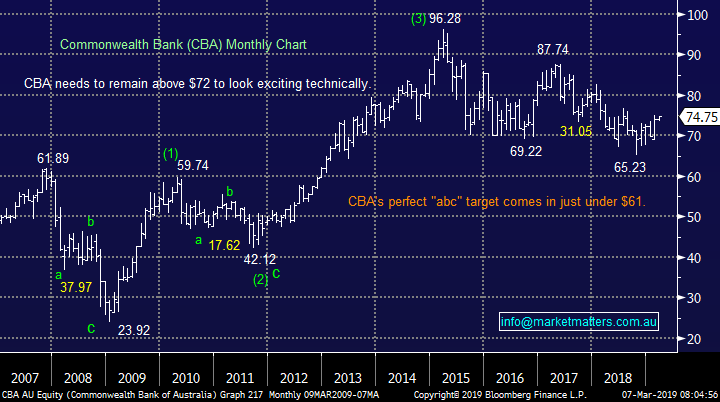
The “big 4” banks have enjoyed a strong recovery in 2019 with heavyweight CBA up 14.6% from its lows before we include its attractive $2 fully franked dividend paid last month however in an environment when investors are chasing perceived cheap stocks across the board the banks remain on the menu with best performer CBA still over 20% below its 2015 high.
With local rates now looking set to fall, or at least not increase, the yield from our banks remain very attractive even if Labor do make some changes to franking credits, assuming the bookmakers are correct and they win the federal election in May.
Currently CBA is yielding 5.8% fully franked while NAB pays 7.8% fully franked i.e. extremely attractive and sustainable (probably in NAB’s case).
MM remains comfortable with our bank holdings for now but we may consider trimming our large CBA or NAB position by ~2% if we feel local stocks are experiencing a blow off top.
Commonwealth Bank (CBA) Chart
Resources
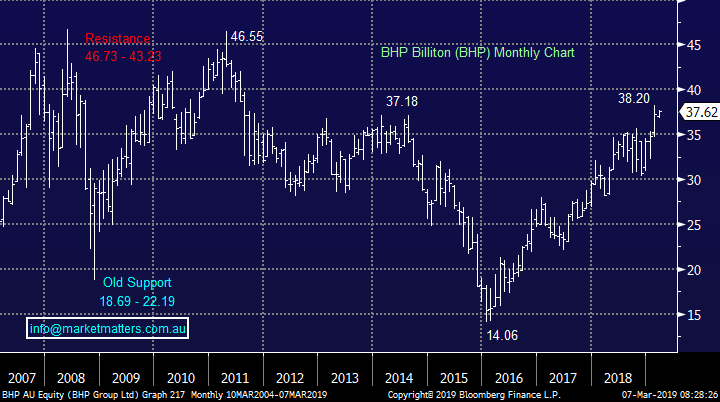
Over the last 3-months heavyweights BHP and RIO are up 25% and 34% respectively – that’s rocket fuel for the local index. At MM we have been guilty in taking our money too soon from these sector heavyweights but resources are a cyclical industry and chasing strength can often be a dangerous game.
At current levels we are cautious the in favour resources which was illustrated by our selling out of nickel miner Western Areas (WSA) earlier in the week.
At this stage we will be monitoring the resources closely but not chasing with a “FOMO” mentality.
BHP Billiton (BHP) Chart
Healthcare
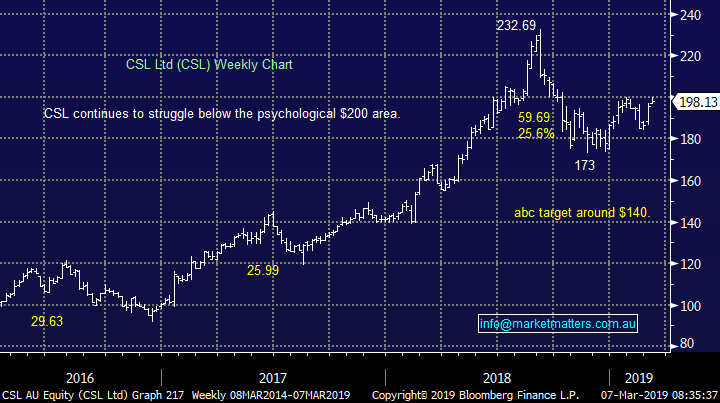
The healthcare sector has become a very influential part of the ASX200 with CSL the 4th largest stock on our bourse, however its actually been a drag in 2018/9 with the likes of CSL (CSL), ResMed (RMD) and Cochlear (COH) all significantly below their 12-month highs.
We can see a FOMO pop up towards $210 for CSL, over 5% higher, as people chase relatively weak stocks, although we have no interest in joining this ride.
At this stage we have no broad interest in the healthcare sector.
CSL Ltd (CSL) Chart
Energy Stocks
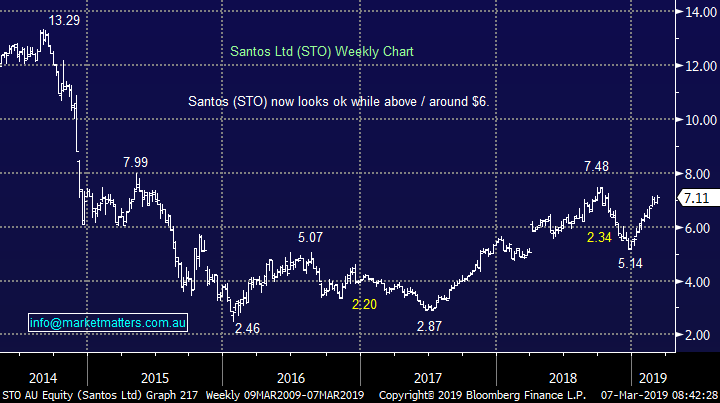
The Energy Sector has enjoyed the almost 40% appreciation in crude oil but the risk / reward is no longer attractive in our opinion.
However, we will have interest if crude falls around 8% to revisit the mid-February levels but just here we are neutral but with an upside bias.
At this stage we continue to like Santos and would buy a reasonable dip.
Santos (STO) Chart
The yield play
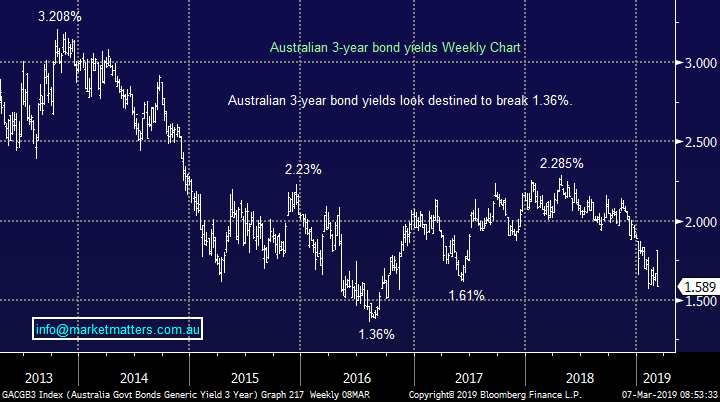
Interest rates in Australia look destined to head lower as our first recession in 27-years looms on the horizon.
Hence we are seeing a steady grind higher by the likes of Transurban (TCL) and Sydney Airports (SYD) – the classic “yield play” heavyweights.
At this stage we prefer the banks to the likes of TCL and SYD but are mindful of potential bad debts locally if our economy turns ugly.
Australian 3-year bonds yield Chart
Growth stocks
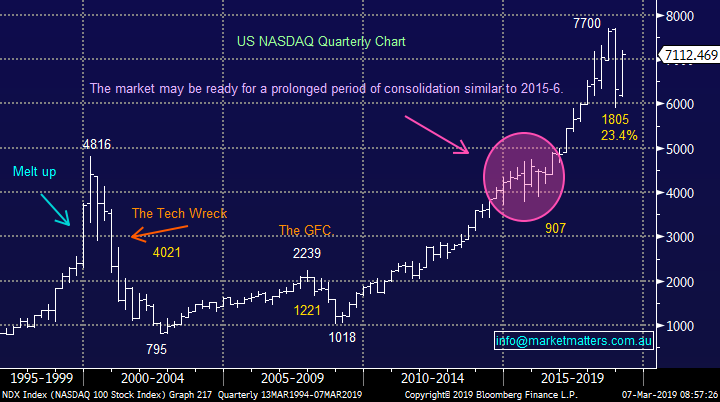
Back in 2018 we called the NASDAQ to spend the next year or two in a choppy consolidation pattern, similar to 2014 /6. This has proven correct so far although our highly correlated growth stocks have outperformed in places e.g. Appen (APX) has showed what a great business can do.
At this stage we remain only buyers of Australian growth stocks into a pullback.
NASDAQ Chart
Conclusion
We are not keen on chasing the fully valued overall market at current levels but we are still considering a few situation stocks like G8 Education (GEM) and Healius (HLS).
Overnight Market Matters Wrap
· The US majors sold off overnight with little update on the progress of the US-China trade talks and following the release of the Fed Reserve’s latest beige book survey, exhibiting that the US economy cooled off for the first 2 months of this year.
· The energy sector also weakened following the release of the latest US oil stockpiles which saw a greater than expected rise of 7.1million barrels. Crude oil lost 0.62% to settle at US$56.21/bbl.
· The March SPI Futures is indicating the ASX 200 to open marginally higher this morning, testing the 6250 level with the big names such as BHP, RIO and QBE trading ex-dividend.
Have a great day!
James & the Market Matters Team
Disclosure
Market Matters may hold stocks mentioned in this report. Subscribers can view a full list of holdings on the website by clicking here. Positions are updated each Friday, or after the session when positions are traded.
Disclaimer
All figures contained from sources believed to be accurate. Market Matters does not make any representation of warranty as to the accuracy of the figures and disclaims any liability resulting from any inaccuracy. Prices as at 07/03/2019
Reports and other documents published on this website and email (‘Reports’) are authored by Market Matters and the reports represent the views of Market Matters. The MarketMatters Report is based on technical analysis of companies, commodities and the market in general. Technical analysis focuses on interpreting charts and other data to determine what the market sentiment about a particular financial product is, or will be. Unlike fundamental analysis, it does not involve a detailed review of the company’s financial position.
The Reports contain general, as opposed to personal, advice. That means they are prepared for multiple distributions without consideration of your investment objectives, financial situation and needs (‘Personal Circumstances’). Accordingly, any advice given is not a recommendation that a particular course of action is suitable for you and the advice is therefore not to be acted on as investment advice. You must assess whether or not any advice is appropriate for your Personal Circumstances before making any investment decisions. You can either make this assessment yourself, or if you require a personal recommendation, you can seek the assistance of a financial advisor. Market Matters or its author(s) accepts no responsibility for any losses or damages resulting from decisions made from or because of information within this publication. Investing and trading in financial products are always risky, so you should do your own research before buying or selling a financial product.
The Reports are published by Market Matters in good faith based on the facts known to it at the time of their preparation and do not purport to contain all relevant information with respect to the financial products to which they relate. Although the Reports are based on information obtained from sources believed to be reliable, Market Matters does not make any representation or warranty that they are accurate, complete or up to date and Market Matters accepts no obligation to correct or update the information or opinions in the Reports. Market Matters may publish content sourced from external content providers.
If you rely on a Report, you do so at your own risk. Past performance is not an indication of future performance. Any projections are estimates only and may not be realised in the future. Except to the extent that liability under any law cannot be excluded, Market Matters disclaims liability for all loss or damage arising as a result of any opinion, advice, recommendation, representation or information expressly or impliedly published in or in relation to this report notwithstanding any error or omission including negligence.


