The markets stumbling, what’s MM considering today?
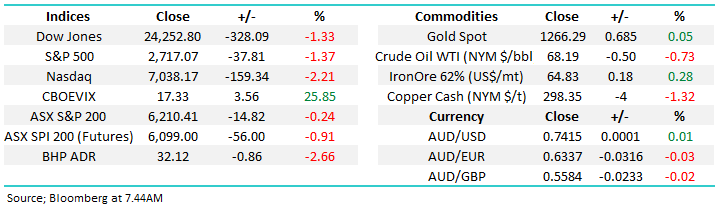
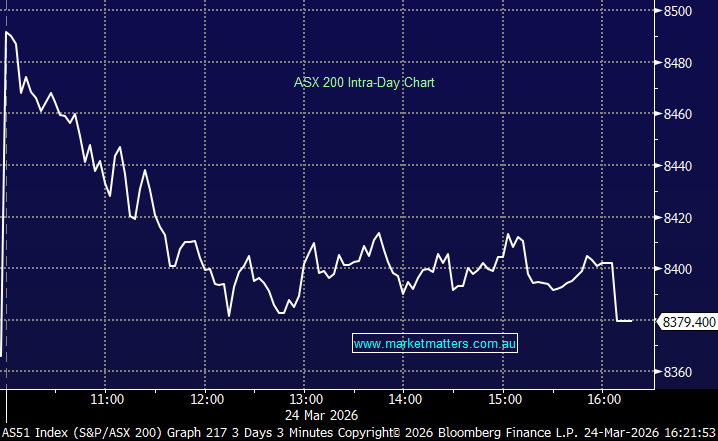
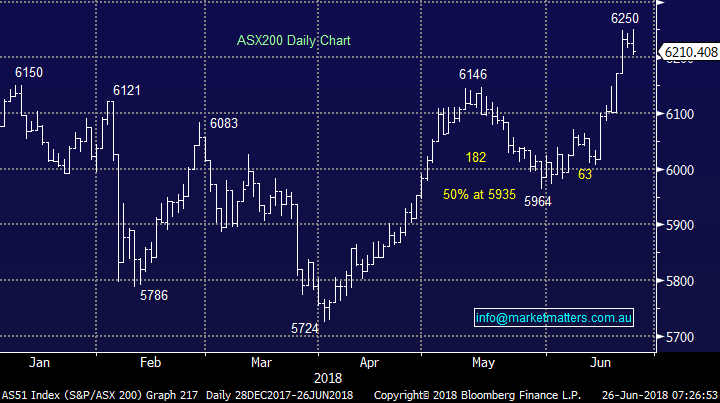
The ASX200 had a disappointing day yesterday reversing early gains from our 6250-resistance area for the third time in the last few days. The banks gave back 1% of their recent gains while the energy and large cap resources enjoyed a return to favour which now looks likely to be very short-lived - BHP tumbled over 2.5% in the US and is set to open just above $32 this morning testing its lows for ~6-weeks. With EOFY now only 4 trading days away some choppy action on the stock level remains possible although external forces may takeover fund managers thoughts today.
Overnight stocks were sold off pretty hard with the broad based S&P500 down -1.37% and the Dow Jones falling -328 points for its ninth decline in 10-days. The ASX200 is set to open just below 6150, already a 100-point decline from yesterday morning’s high and likely to generate technical sell signals for MM. Last night’s weakness on overseas markets was the worst since April and was primarily attributed to further trade tensions courtesy of Donald trump, potentially one step too far for a bull market that’s trading at historically expensive levels.
Harley Davidson announcing they were looking at moving further production overseas because of tariffs was a catalyst for the selling to accelerate with its shares falling 6% but more importantly it illustrated to many investors that Trumps protectionist policies are fraught with risks and are certainly not clear and simple. Ongoing tensions erode confidence and this has negative implications for growth.
The ASX200 has ignored most of the bad days on US / overseas markets over the last 10-days but we feel today may be the day the chickens come home to roost.
- Short-term MM is now neutral with a close below 6140 generating a clear sell signal - we remain in “sell mode”.
Today’s report is going to focus on the position of global equities and 2 ETF’s MM are considering this morning as we look to increase the defensive nature of our Growth Portfolio in particular – we currently are holding 20% in $A cash plus 3% in a $US cash ETF, a decent cash exposure but it’s never high enough if the markets going to experience a decent correction.
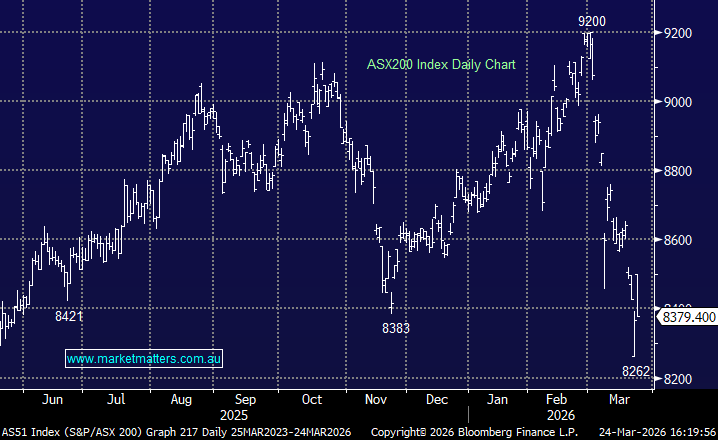
ASX200 Chart
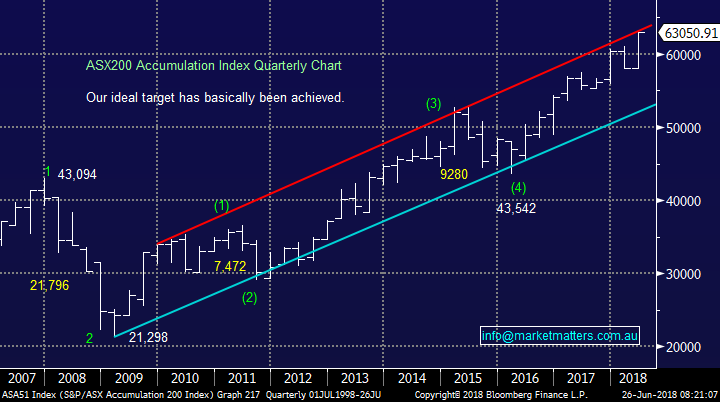
The ASX200 Accumulation Index made new all-time highs yesterday and has basically reached our long-term target for the index. As we’ve said previously “if we are correct this is the time to be slowly adjusting portfolios to a more defensive stance, as opposed to becoming euphoric and chasing stocks:
- From a simple risk / reward perspective we are bearish Australian stocks as they continue to test long-term resistance.
ASX200 Accumulation Index Chart
With overseas stocks potentially leading the domestic market lower it felt important today to firstly consider how MM sees some of the most influential global markets.
Overseas Indices
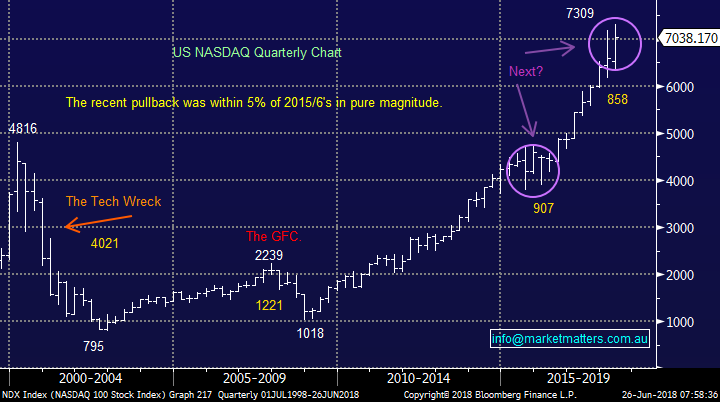
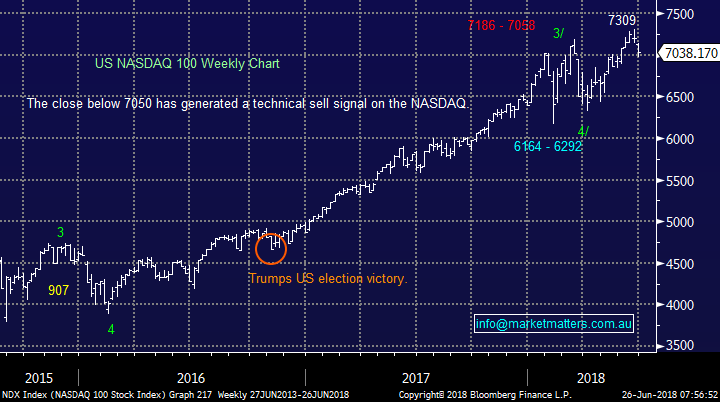
Firstly looking at the high flying tech based NASDAQ which we believe often leads other indices both up and down.
- We have been targeting a consolidation between 7500 and 6500, this now looks more likely to be between 7300 and 6300 i.e. we see another 10% downside.
- In the shorter-term we have been targeting a close below 7050 to generate a sell signal targeting 6200, over 10% lower – achieved today.
We are now bearish the NASDAQ and US stocks until further notice.
US NASDAQ Chart
US NASDAQ Chart
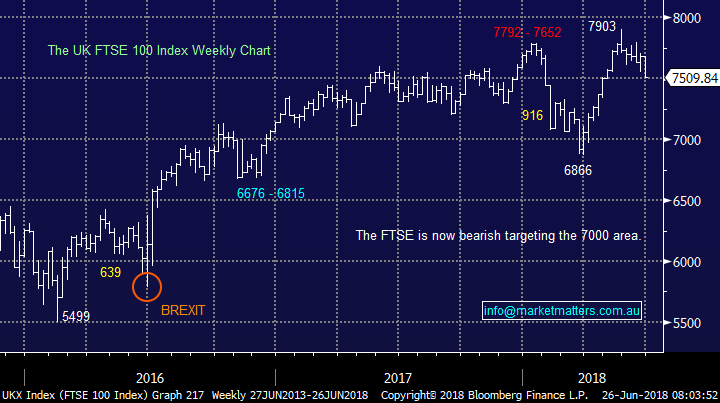
We’ve been watching the UK FTSE very carefully over the last month for 2 important reasons:
- The FTSE has provided a clear technical roadmap for MM and last night it generated a strong sell signal targeting ~7000, at least 7% lower.
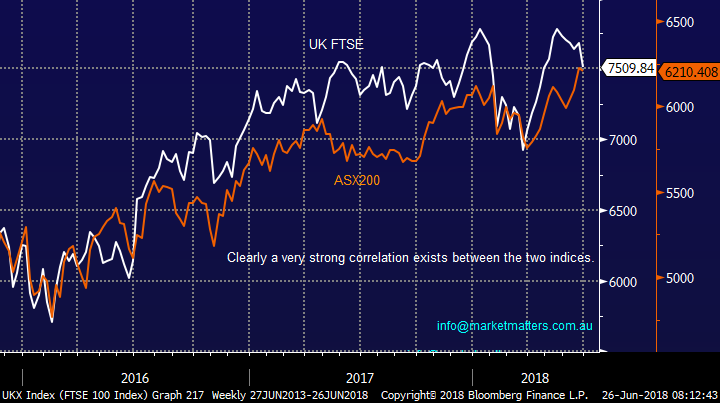
- The correlation between the UK FTSE and the ASX200 is far stronger than say with US indices.
UK FTSE Chart
UK FTSE v ASX200 Chart
So with MM getting sell signals from both the US and Europe markets plus the local ASX200 struggling at our medium-term 6250 target area the obvious question is how should MM be positioned moving forward?
- Platinum Portfolio – Increase our 20% cash / 3% $US cash position and potentially use ETF’s to cover downside risks to equities plus sell any stocks that are lucky to receive an EOFY push higher.
- Income Portfolio – We are defensive in this portfolio but an increased cash position is a consideration while a hedging position using an ETF is certainly on the cards but in a less aggressive manner than the Growth Portfolio
Two ETF’s we may use in the coming days / weeks.
The 2 ETF’s we are considering have excellent liquidity, reasonable costs for “shorting” and satisfy our objective of protecting investors to market declines.
I actually spoke with Betashares a few months ago about their products – with the video available here – goes into more detail about their suite of ETFs with an emphasis on the two outlined below.
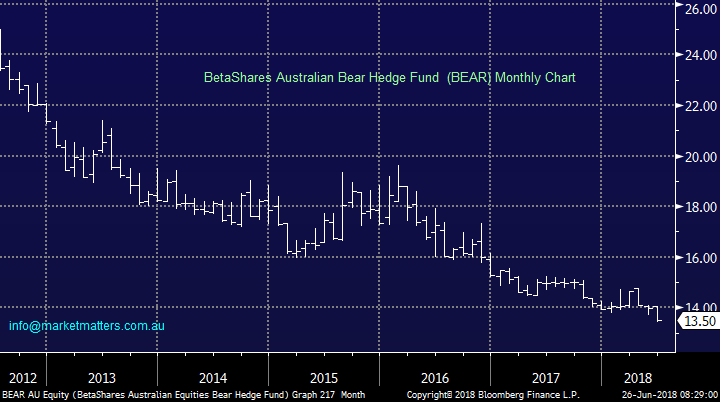
1 BetaShares Australian Equities Bear Fund (BEAR) $13.50.
The BEAR has a market cap of around $50m while being designed to generate returns negatively correlated to the ASX200, its actual depth (liquidity) is determined by the ASX200 stocks and SPI futures hence no issues for investors.
The fund is on the expensive end of the scale costing 1.38% p.a. to administer but we believe this is fair for an ETF that allows us to easily short the ASX200.
Buying the BEAR is like purchasing shares in a company for $13.50 which benefits from the ASX200 falling, two examples:
- The ASX200 rallied +7.4% from early April into Mays 6146 high while the BEAR fell -7.2%, good enough correlation for us.
- In January / February the BEAR rallied 6% when the ASX200 corrected -5.9%, again excellent correlation.
Simply put a position in the BEAR ETF hedges the equivalent $$ exposure to a basket of ASX200 shares. Hence if we allocated 5% of our 20% $A cash holding to the BEAR, we would have a net exposure of 15% cash + 3% cash in the USD through an ETF, 77% long stocks with a 5% hedge on the ASX 200 - hope that makes sense!
NB There is also a strong equivalent to the BEAR, providing leverage, but we felt keeping things simple made more sense with the local ETF.
BetaShares Australian Equities Bear Fund (BEAR) Chart
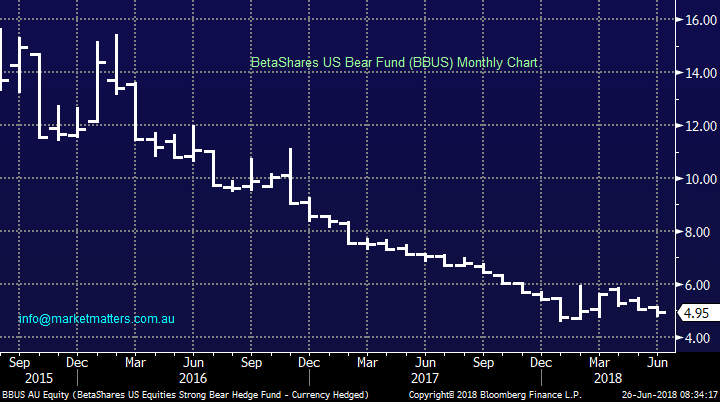
2 BetaShares US Equities Strong Bear Hedge Fund – currency hedged (BBUS) $5.06
The BBUS is designed to be negatively correlated to the US share market (using the S&P500) while being hedged to the $A. The ETF currently only has a market cap of $57m but its liquidity is determined by the S&P futures where the depth makes our own ASX200 feel like a child’s toy hence no issues there for MM.
Like the BEAR this fund is on the expensive end of the scale costing 1.38% p.a. to administer but we again believe this is fair for an ETF that allows us to easily short the US stock market.
Its important investors understand the leverage in this ETF, which is implied by the “Strong” in its title:
- The BBUS at one stage rallied over 30% in January when the actual S&P500 only fell -12% at its worst.
- Similarly, from the S&P500’s low in February 2016 to its top in January 2018 the BBUS fell by over 70% while the Index only rallied by 59%.
At MM we can see ourselves using the BBUS in a similar manner to the BEAR as we feel that US equities are likely to suffer a decent correction moving forward - we will remain mindful of the leverage / currency adjustment skew in this ETF.
BetaShares US Equities Strong Bear ETF – currency hedged (BBUS) Chart
Conclusion
We have a “sellers hat” firmly in place and will continue to look for opportunities to increase our cash holding by simply selling shares, especially if any “pop” into EOFY.
Also we are likely to buy one of both of the BEAR / BBUS today.
Watch out for alerts.
Overnight Market Matters Wrap
· The selloff in the US escalated and spread across the European nations overnight as trade tensions between the US and China had started a global domino effect.
· The tech. heavy Nasdaq 100 fared the worst, starting the week off 2.21%, whilst the broader S&P 500 closed 1.37% lower overnight, led by the Energy and IT sector.
· Volatility jumped close to 26% higher, starting to test the complacency resistance level.
· Locally, the energy sector is expected to give back yesterday’s gains and possibly more, with BHP in the US ending its session down an equivalent of -268% from Australia’s previous close.
· The September SPI Futures is indicating the ASX 200 to open 50 points lower towards the 6160 level this morning.
Have a great day!
James & the Market Matters Team
Discloser
Market Matters may hold stocks mentioned in this report. Subscribers can view a full list of holdings on the website by clicking here. Positions are updated each Friday.
Disclaimer
All figures contained from sources believed to be accurate. Market Matters does not make any representation of warranty as to the accuracy of the figures and disclaims any liability resulting from any inaccuracy. Prices as at 26/6/2018
Reports and other documents published on this website and email (‘Reports’) are authored by Market Matters and the reports represent the views of Market Matters. The MarketMatters Report is based on technical analysis of companies, commodities and the market in general. Technical analysis focuses on interpreting charts and other data to determine what the market sentiment about a particular financial product is, or will be. Unlike fundamental analysis, it does not involve a detailed review of the company’s financial position.
The Reports contain general, as opposed to personal, advice. That means they are prepared for multiple distributions without consideration of your investment objectives, financial situation and needs (‘Personal Circumstances’). Accordingly, any advice given is not a recommendation that a particular course of action is suitable for you and the advice is therefore not to be acted on as investment advice. You must assess whether or not any advice is appropriate for your Personal Circumstances before making any investment decisions. You can either make this assessment yourself, or if you require a personal recommendation, you can seek the assistance of a financial advisor. Market Matters or its author(s) accepts no responsibility for any losses or damages resulting from decisions made from or because of information within this publication. Investing and trading in financial products are always risky, so you should do your own research before buying or selling a financial product.
The Reports are published by Market Matters in good faith based on the facts known to it at the time of their preparation and do not purport to contain all relevant information with respect to the financial products to which they relate. Although the Reports are based on information obtained from sources believed to be reliable, Market Matters does not make any representation or warranty that they are accurate, complete or up to date and Market Matters accepts no obligation to correct or update the information or opinions in the Reports. Market Matters may publish content sourced from external content providers.
If you rely on a Report, you do so at your own risk. Past performance is not an indication of future performance. Any projections are estimates only and may not be realised in the future. Except to the extent that liability under any law cannot be excluded, Market Matters disclaims liability for all loss or damage arising as a result of any opinion, advice, recommendation, representation or information expressly or impliedly published in or in relation to this report notwithstanding any error or omission including negligence.
To unsubscribe. Click Here