The IT sector led us up but its having a mixed time at present (CBA, WBC, AAPL US, XRO, ALU, APX)
The ASX200 enjoyed another strong day rallying almost +0.5% with heavyweight Commonwealth Bank (CBA) contributing over 60% of the days 33-point gain, CBA’s rally was not surprising following an excellent result which allowed MM to follow our previously well flagged plan to take profits in Australis largest bank while reducing our market exposure in the process – more on this later. With only 53% of the ASX200 closing up on the day it was an interesting session which reminded me of a line in yesterday’s note with regard to US stocks:
“These marginal new highs in the indices like the S&P500 and NASDAQ are selective and mega cap driven, whereas the overall market momentum is waning which is not a good sign for the bulls from a risk / reward perspective.” – Wednesdays MM Am Report.
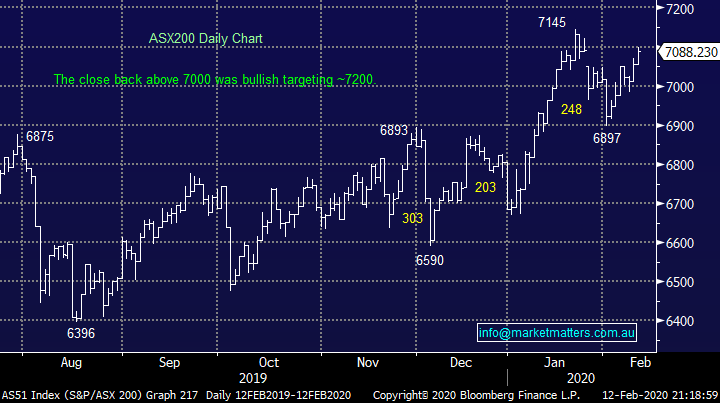
No change to the MM viewpoint: we believe that 2020 will continue to be a choppy year as waves of optimism and pessimism wash through stocks, our view is still that the ASX200 will make fresh all-time highs up towards 7200 before enduring another ~5% correction i.e. only another 1.5% upside if we re correct before the market will feel like a sell from a risk / reward basis.
At MM we attempt to add value (alpha) to portfolios through both stock / sector selection and overall market weighting, remember when global equities panicked on Monday 3rd February because of the coronavirus MM went limit long stocks, reducing our cash levels down to only 1%. Our target has always been to sell into strength up towards 7200 and yesterday’s sale was the first step in this plan – as we often quote “plan your trade & trade your plan”.
MM is looking to increase cash levels into current strength putting us in “sell mode”.
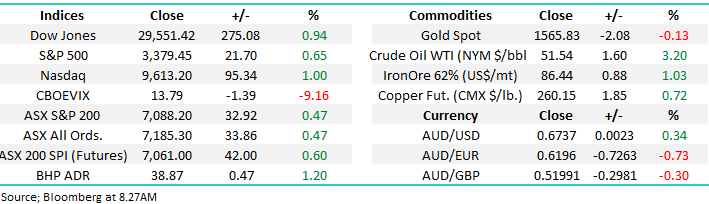
Overnight US stocks rallied to fresh all-time highs with the Dow up 275-points, sentiment was buoyed by the reduced rate of growth in the coronavirus and China making noises about getting many regions back to work, plus saying they’ll meet their economic targets (implies decent stimulus on the way). The SPI futures are pointing an open up around +0.5%, within a few points of last month’s all-time high.
Today we’ve again looked at the IT Sector which has been a major outperformer since Q4 of 2018 but whose momentum feels like it might be waning.
ASX200 Chart
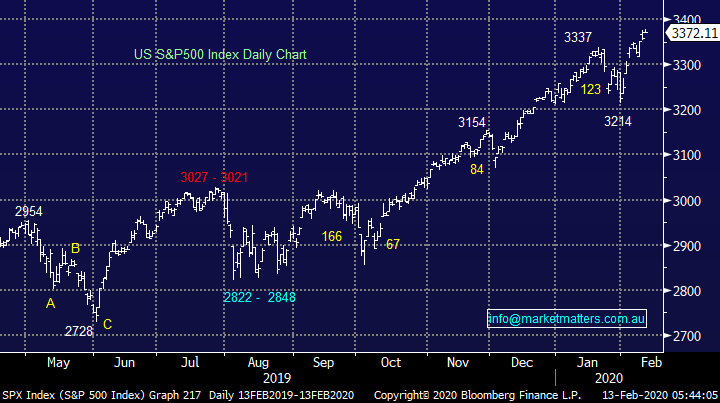
US equities continue to trade around their all-time highs with the S&P500 closing up by 0.65%, our preferred scenario is the S&P500 will now rotate between 3200 and 3400, or in simple terms it’s time for a rest following great gains since mid-2019 – in terms of adding alpha / value we feel investors should continue to focus on selling strength and buying weakness when they tweak portfolios, a classic saying but not always an easy one to execute.
MM is now neutral US stocks while they make fresh all-time highs.
US S&P500 Index Chart
Yesterday MM did the unthinkable to many Australian investors and took profit on our CBA position, my guess is one of our less popular MM alerts although I would remind subscribers that our purchase back in August received a reasonable amount of derision at the time. Our thought process is as below:
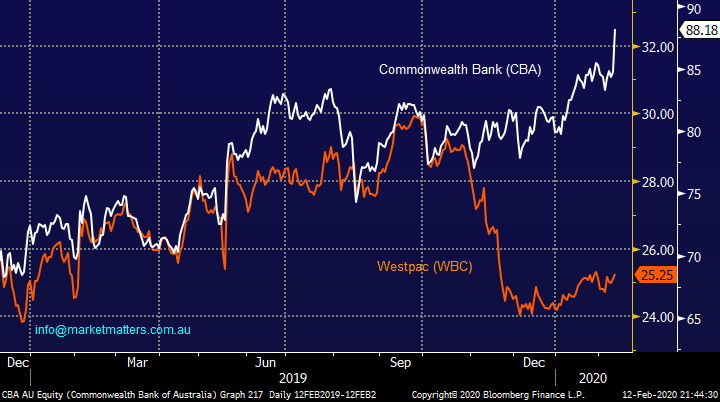
1 – While we firmly believe CBA is the best bank, a fact that was further shown at 8am this morning when we had the CFO Alan Docherty in to discuss yesterday’s results, our view in the shorter term is that CBA has now rallied too hard compared to the likes of Westpac and NAB e.g. over the last 3-months CBA is up over +10% while Westpac (WBC) has fallen almost -10%. CBA is now trading on an Est P/E for 2020 of 18.1x while it yields 4.9% conversely WBC is trading on a P/E of 14.6x and its yield is a whopping 6.3% i.e. there’s now a huge amount of outperformance already baked into the CBA cake.
2 – MM is looking for a decent swing high by stocks in the next 1-2% hence an ideal time to take our $$ from CBA with a view to increasing our exposure to the Banking Sector probably via other members of the “Big 4” into a pullback.
MM feels the CBA – Westpac elastic band has stretched too far.
Commonwealth Bank (CBA) v Westpac (WBC) Chart
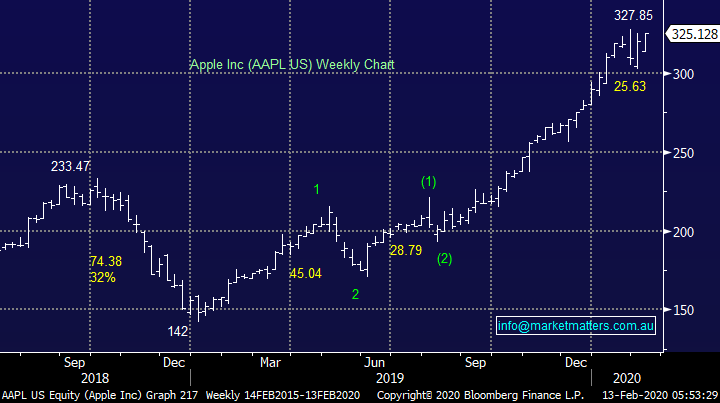
At MM we’ve been using Apple Inc. to fine tune our target for US stocks, our forecasted area where we feel Apple will become in danger of another correction from a risk / reward basis is now only 2% away, interestingly is very similar to how much fuel we see left in the ASX’s tank. We are a fan of the company and hold it in our Overseas Portfolio, a position we have no intention of selling, but over the last 18-months APPL’s corrected 32%, 21%, 13% and 7.8% respectively illustrating perfectly that optimum entry can add significant value to a portfolio – MM believes on balance investors will get a better opportunity to enter / increase exposure to this quality company.
MM’s will become short-term neutral Apple ~2% higher.
Apple Inc. is now the world’s largest listed company with a market cap. of over $US1.4 trillion making it an obvious candidate to use as a roadmap indicator for indexes.
Apple Inc (AAPL US) Chart
Is the IT sector raising a red warning flag?
On Tuesday’s report in the opening paragraph I wrote: “Elsewhere we saw gold stocks rally strongly while the IT sector was the worst on ground, I cannot remember many days like that over recent years”. Admittedly on Wednesday we saw the IT stocks again return to the outperformance corner but yesterday, on a strong day for the index, we saw these previous market leaders again one of the weakest on ground when noticeably more sectors were actually down than up.
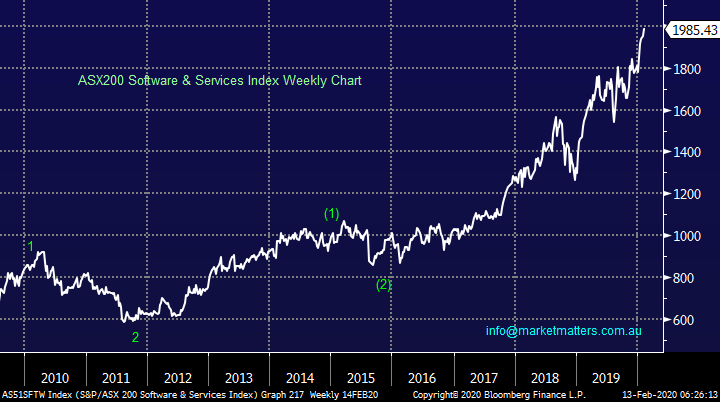
As subscribers know MM is looking for a potential “swing high” in the coming days / weeks and a sector which has previously led the advance over recent months stalling / underperforming would support this view. However it’s also important that we don’t find ourselves guilty of forcing or curve fitting our opinion onto markets and the underlying Australian IT Sector has generated zero sell signals.
The ASX200 Software & Services Index is giving away no clues, it remains in a clear bullish uptrend.
Today we will look at 3 influential stocks in the sector for further clues and ideas while also considering a global perspective on the same theme.
ASX200 Software & Services Index Chart
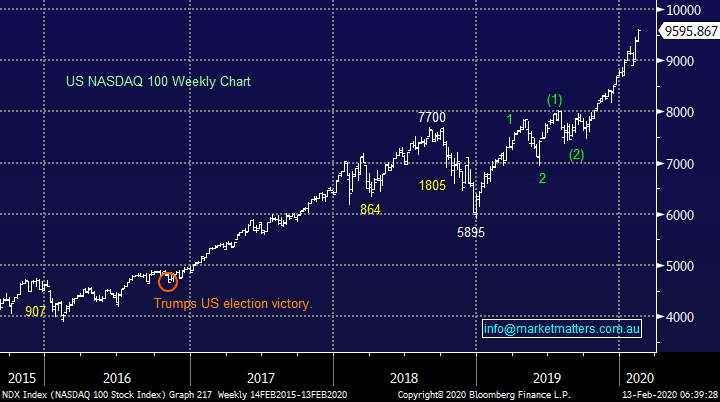
The chart below illustrates the explosive US Tech Sector which like our own has outperformed admirably since its panic sell-off in late 2018 on valuation concerns. While bond yields remain low the factors which worried investors just over a year ago have become dormant for now and we believe they will remain so until interest rates start to nudge higher – something we see in 2020 / 2021 but it’s not happening yet i.e. investors can justify ever increasing valuations for risk assets when $$ in the bank basically generates zero return but when the safe alternative becomes more attractive the dynamic changes very fast.
In line with our “choppy 2020” outlook and technical picture for Apple we see the NASDAQ rotating between 9000 and 9750 over coming weeks making the risk / reward fairly unattractive at current levels.
US NASDAQ Index Chart
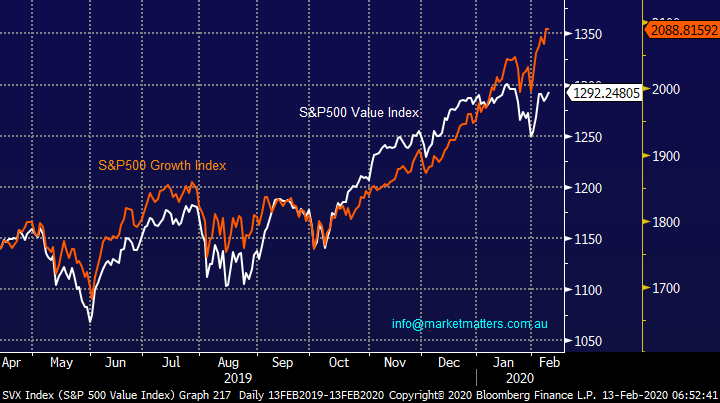
It’s been a while since we considered if the Value Sector was poised to take over the mantle from Growth as best performer in the US and global market – it’s fairly clear whose been winning in 2020. Below are our updated thoughts around these indices and their relationship:
1 – We remain bullish growth stocks but like our view on the underlying market we feel it’s also an index to sell strength and buy weakness in 2020, current target is ~3% higher.
2 – We feel the value Index will catch up on the relative performance through 2020 and especially when / if bond yields edge higher.
US S&P500 Value and Growth Indices Chart
Lastly I have looked at 3 prominent players in the sector for potential clues and opportunities moving forward.
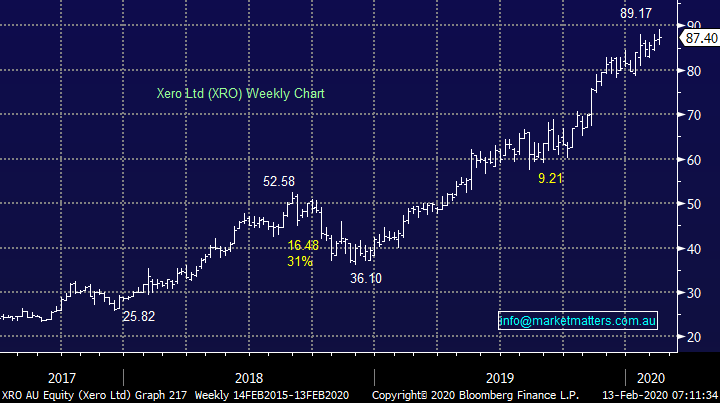
1 Xero (XRO) $87.40
Markets have a habit of reminding us that all great companies have a fair value and if / when they run too far quality will be forgotten for at least a while. On-line accounting business XRO has more than doubled since late 2018 and although it’s a great company we aren’t keen around $90 especially from a risk / reward perspective, at least a 10% correction is needed before we would consider it.
MM would be keen on XRO around $80.
Xero (XRO) Chart
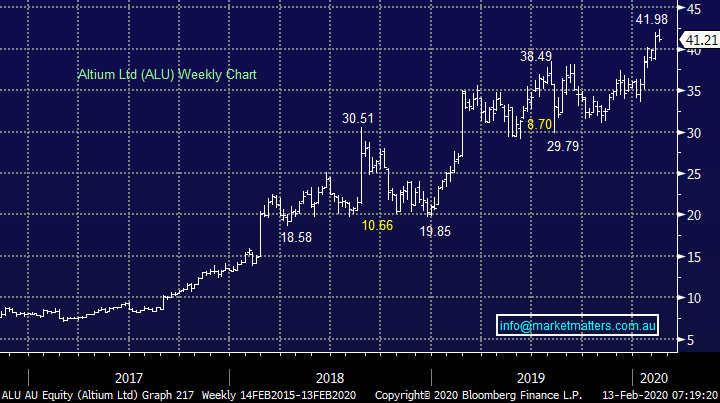
2 Altium (ALU) $41.21
The ALU picture is very similar to MM, the picture is clearly bullish but a little stretched. This is another business we like which has run harder than we anticipated but again from a risk / reward perspective we cannot be buyers – a 5% correction is our initial preferred scenario.
MM is neutral ALU at current levels.
Altium (ALU) Chart
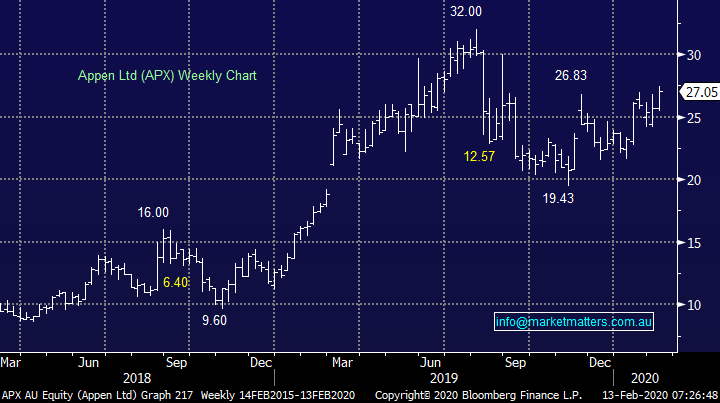
3 Appen Ltd (APX) $27.05
This machine learning and artificial intelligence (AI) business is our favourite out of todays 3 at current prices. We like this company on a number of levels including they have cash on hand to fund anticipated 30% pa growth, its exposure to China where it generates ~5% of revenue is probably surpressing its share price but as worries around the coronavirus dissipate this is becoming one stock in our buy headlights.
MM is neutral / bullish APX.
Appen Ltd (APX) Chart
Conclusion (s)
On balance MM feels the Australian IT stocks are positioned for a likely pullback after recent strong gains i.e. buy weakness not strength! However of the 3 stocks looked at today Appen (AX) is our favourite at current prices.
Overnight Market Matters Wrap
- The US equity markets reached fresh record highs as investors concerns of the coronavirus dissipated further and focus turned back on strong US earnings season.
- 70% of US companies have reported, with over 71% beating expectations in their latest quarterly earnings results, according to FactSet.
- BHP is expected to join the fun today after ending its US session up an equivalent of 1.20% from Australia’s previous close.
- The March SPI Futures is indicating the ASX 200 will open 42 points higher, towards the 7130 level this morning.
Have a great day!
James & the Market Matters Team
Disclosure
Market Matters may hold stocks mentioned in this report. Subscribers can view a full list of holdings on the website by clicking here. Positions are updated each Friday, or after the session when positions are traded.
Disclaimer
All figures contained from sources believed to be accurate. All prices stated are based on the last close price at the time of writing unless otherwise noted. Market Matters does not make any representation of warranty as to the accuracy of the figures or prices and disclaims any liability resulting from any inaccuracy.
Reports and other documents published on this website and email (‘Reports’) are authored by Market Matters and the reports represent the views of Market Matters. The Market Matters Report is based on technical analysis of companies, commodities and the market in general. Technical analysis focuses on interpreting charts and other data to determine what the market sentiment about a particular financial product is, or will be. Unlike fundamental analysis, it does not involve a detailed review of the company’s financial position.
The Reports contain general, as opposed to personal, advice. That means they are prepared for multiple distributions without consideration of your investment objectives, financial situation and needs (‘Personal Circumstances’). Accordingly, any advice given is not a recommendation that a particular course of action is suitable for you and the advice is therefore not to be acted on as investment advice. You must assess whether or not any advice is appropriate for your Personal Circumstances before making any investment decisions. You can either make this assessment yourself, or if you require a personal recommendation, you can seek the assistance of a financial advisor. Market Matters or its author(s) accepts no responsibility for any losses or damages resulting from decisions made from or because of information within this publication. Investing and trading in financial products are always risky, so you should do your own research before buying or selling a financial product.
The Reports are published by Market Matters in good faith based on the facts known to it at the time of their preparation and do not purport to contain all relevant information with respect to the financial products to which they relate. Although the Reports are based on information obtained from sources believed to be reliable, Market Matters does not make any representation or warranty that they are accurate, complete or up to date and Market Matters accepts no obligation to correct or update the information or opinions in the Reports. Market Matters may publish content sourced from external content providers.
If you rely on a Report, you do so at your own risk. Past performance is not an indication of future performance. Any projections are estimates only and may not be realised in the future. Except to the extent that liability under any law cannot be excluded, Market Matters disclaims liability for all loss or damage arising as a result of any opinion, advice, recommendation, representation or information expressly or impliedly published in or in relation to this report notwithstanding any error or omission including negligence.