The Fed has spoken – the $$ taps still on! (NAB, RIO LN)
The ASX200 got the Fed wobbles yesterday closing down -0.2% after enjoying a very promising start to the day, Queensland closing down their border didn’t help matters but overall it did feel like a few players were de-risking ahead of the Fed, MM included. In the morning MM trimmed our holdings in Macquarie Group (MQG) and OZ Minerals (OZL), this was purely a case of portfolio management as we increased our cash level up to 8%, still relatively low. We now simply have a touch more flexibility to be a buyer if stocks ultimately have a negative reaction following the FOMC’s very supportive statement:
“The US fed have left interest rates between 0% & 0.25% while vowing to use its full range of tools to support the US economy through / after COVID-19“- US Fed.
US stocks rallied overnight on the Fed news with the Dow gaining 160-points, the Financials and Energy Sectors were best on ground, the local SPI Futures are pointing to the ASX200 opening up almost 50-points this morning. Overall a solid but not a dramatic reaction considering the Fed’s ongoing free money tailwind but equities have rallied very strongly since March, the NASDAQ is up almost 60% and continuing to look capable of fresh all-time highs in the coming months.
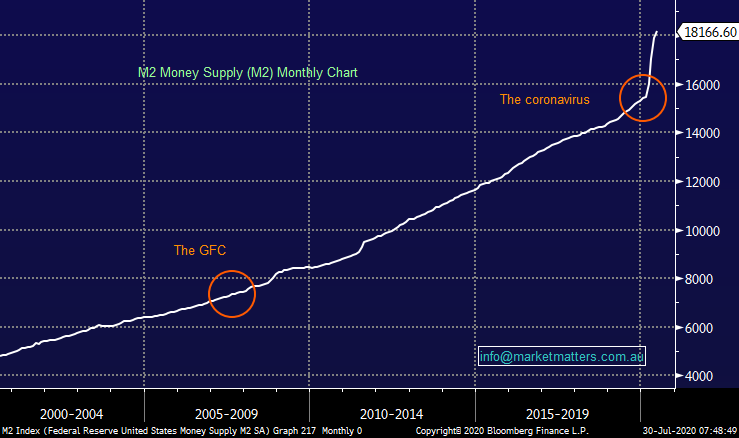
One chart that very clearly shows why stocks have remained supported is the chart of M2 Money Supply which tracks the supply of money sloshing around the system. The commentary overnight from the Fed implies that the trend here is very much our friend, with the cost and availability of capital, two very important inputs when pricing an asset, remaining very supportive of stocks.
M2 Money Supply Chart
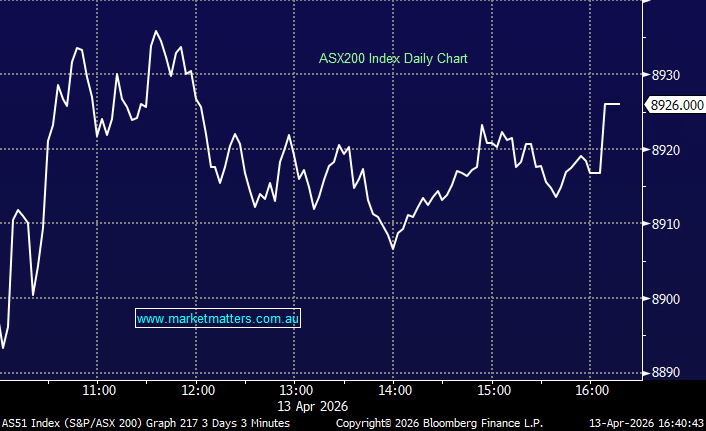
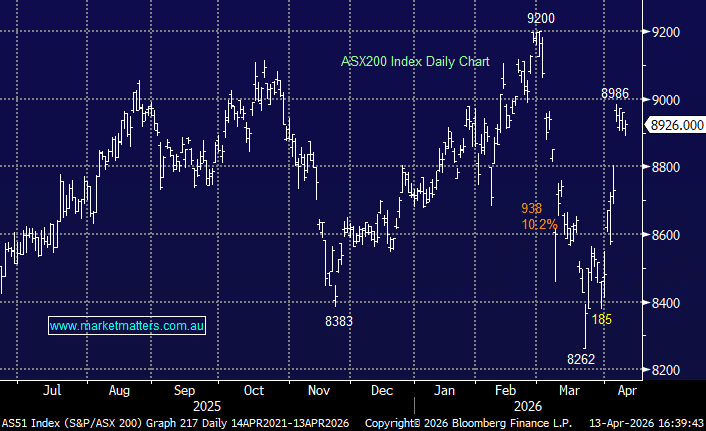
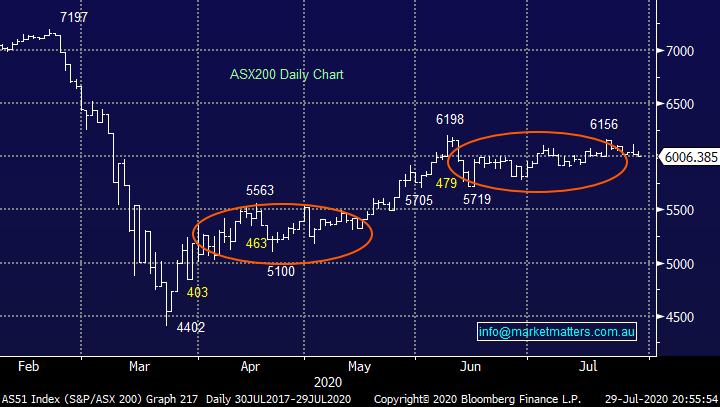
I’m not sure how many times I’ve typed that the local index has migrated back to the 6000 area in the last couple of months but with a likely opening just shy of 6100 this morning it feels like reporting season is now the likely catalyst to drive stocks moving forward however this is likely to be more focused on the stock / sector as opposed to index level. Short-term the market remains a coin toss, but we do still believe an ultimate test of ~6500 is possible in 2020 – the longer we consolidate, the more aggressive the break will ultimately be when it comes.
MM remains bullish the ASX200 medium-term.
ASX200 Index Chart
We covered the banks in yesterday’s Income Report but for those that missed it here’s a quick synopsis:
The banks enjoyed a strong Wednesday with CBA the worst of the “Big 4” still rallying over 1%, APRA have given the Australian Banking Sector a little flexibility with its dividend payments, they are now suggesting banks “cap dividends at 50% of earnings", a major step in the right direction for investors compared to the previous guidance of deferring dividends completely – it’s still big brother stuff but in a very diluted fashion. Also, just to add an additional helping hand banks are now able to use DRP’s to partially offset the impact of the payments. To put these numbers into perspective if all the banks declare dividends at 50% of consensus statutory EPS estimates then the FY20 dividends will come in around the below levels:
ANZ: 65 cps = 3.5% fully franked, CBA: 244 cps = 3.4% fully franked, NAB: 58.5 cps = 3.2% fully franked and WBC: 53.5 cps = 3% fully franked.
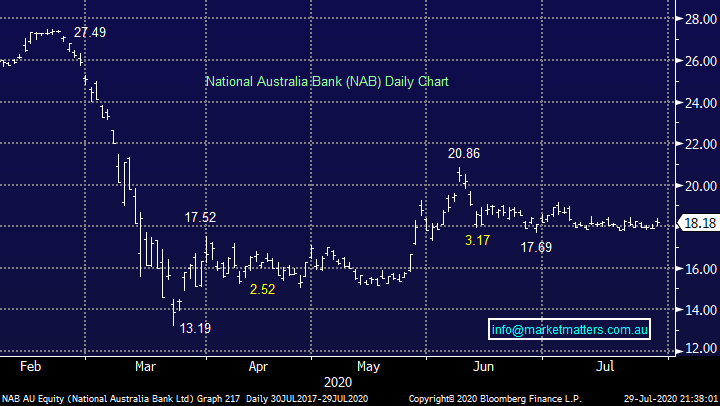
All of the 3-3.5% being more attractive than term deposits, especially for investors who can utilise franking credits however if COVID-19 plunges the economy significantly deeper into a recession bad debt will undoubtedly rise damaging performance. Similar to much of the market we believe they represent good value at current levels, if we find a vaccine in the next year thus enabling the global economy to recover e.g. NAB is still trading 34% below it pre-COVID level illustrating the potential upside if things do turnaround.
MM remains positive the banks medium-term with CBA our preferred option.
NB With US financials rallying almost 2% overnight the Banking Sector looks well positioned to add to yesterday’s gains.
National Australia Bank (NAB) Chart
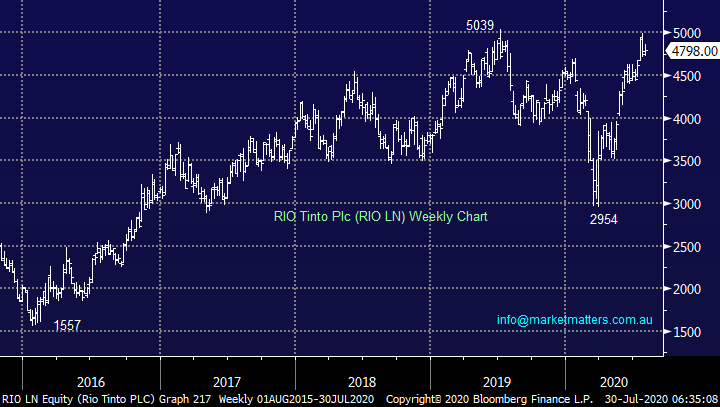
After the market closed yesterday RIO’s reported a solid result and as we touched on in yesterday’s afternoon report a “beat” in our opinion with Iron ore remaining the key, delivering ~80% of EBITDA, a touch lower than the 85% we expected given the strong contributions from copper and aluminium – what a great way to be slightly off the mark! Overnight RIO rallied less than 1% in London, but this was without the benefit of seeing the Fed’s statement. Conversely BHP trading in the US gained +1.2% implying our heavyweight miners are in good shape short-term.
MM remains bullish RIO with an initial target ~10% higher.
RIO Tinto in London (Pounds) Chart
LOCAL REPORTING CALENDAR: CLICK HERE **Please note, data sourced from Bloomberg, not all ASX companies are on this list**
Yesterday we saw results from RIO after market, I cover that here while we have Cimic (CIM) and Genworth (GMA) out today.

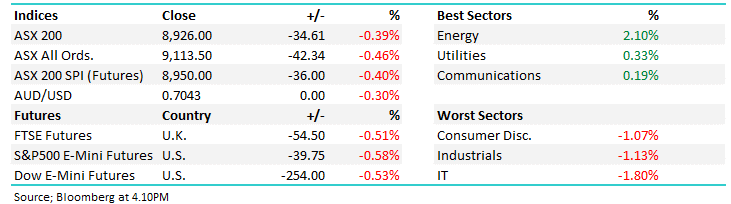
Overseas Indices & markets - their reaction to the Fed
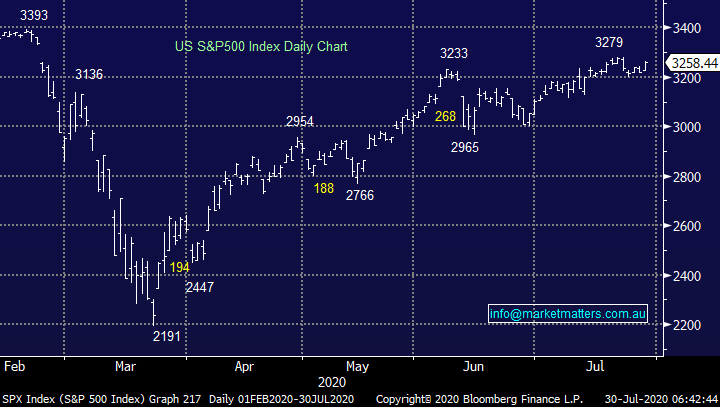
US stocks rallied following the Feds release and press conference with the S&P500 gaining +1.2% putting it in a strong position to make fresh post-March highs, and challenge its all-time high in the process, now only 4% away.
MM remains bullish US stocks medium-term.
US S&P500 Index Chart
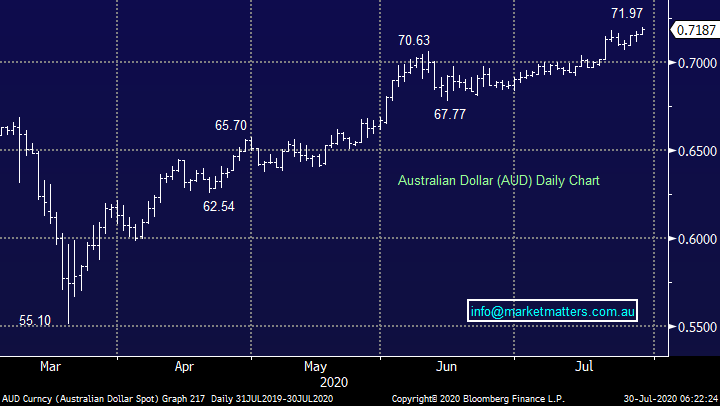
Overnight the $A embraced the Fed’s ongoing supportive stance towards assets rallying to fresh 2020 highs but as is evident from the chart below the upside momentum is waning. We are bullish the $A but around the current 72c area a pullback / period of consolidation would not surprise.
MM remains bullish equities & the $A.
The Australian Dollar ($A) Chart
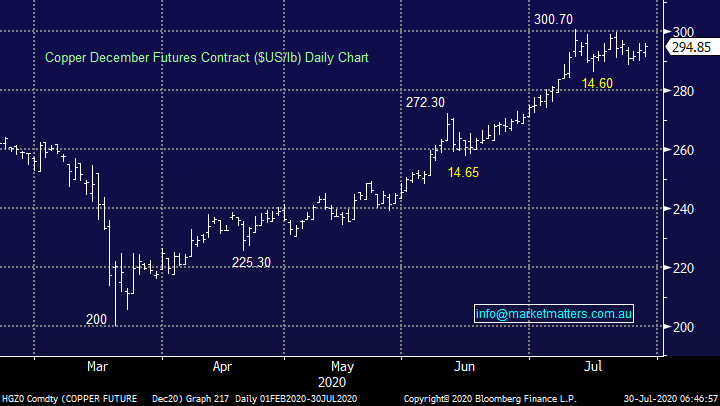
Copper along with the $A is often used to gauge the markets perception of economic strength moving forward, again we remain bullish copper but we feel the initial “easy money” is behind us hence we trimmed our OZ Minerals (OZL) position from 6% to 5%, our best guess short-term is copper will rotate between 285 and 305 for a few weeks – for the traders “buy weakness and sell strength” within that range.
MM remains bullish copper.
Copper ($US/lb) Chart
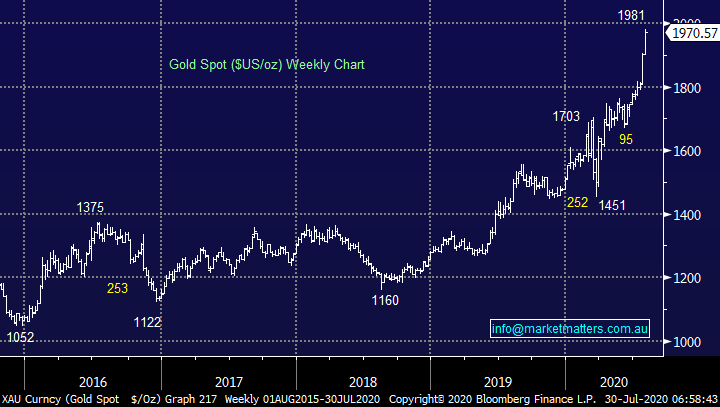
Not surprisingly, gold embraced the Fed’s announcement closing firmly within striking distance of the psychological $US2000/oz area. Similar to copper and the $A we are bullish gold but a period of consolidation would not surprise – we are considering establishing a gold position with the full intention of averaging if we do see a test below $US1900/oz – last night the Van Eck Gold Miners ETF fell 1% implying the markets long and they wanted more from the Fed!
MM remains bullish gold.
Gold ($US/oz) Chart
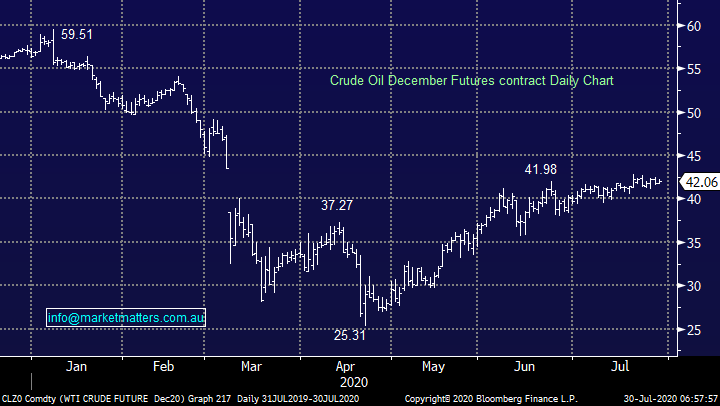
Crude’s been struggling of late compared to gold and even copper but overall, our outlook is similar, we are bullish but a retracement of strong gains from the April low would not surprise.
MM remains mildly bullish crude oil.
Crude oil ($US/barrel) Chart
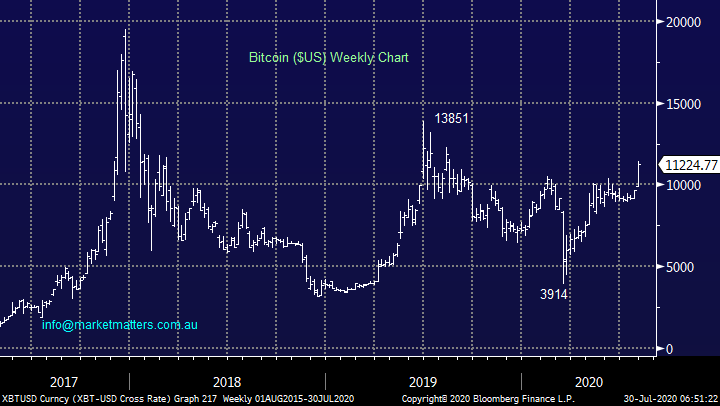
Following the Feds announcement we even saw Bitcoin maintain its recent strength which is a great sign for risk assets, as we said previously “if anybody believes that the liquidity bubble is about to deflate I would argue if there’s enough money slushing around for a high risk questionable asset like Bitcoin to surge why not stocks and precious metals”. MM is bullish Bitcoin while it holds above $US10,000. and technically while it can hold above Mondays low it looks awesome with the potential to explode towards the 14,000 area, excellent risk / reward but more importantly by implication other risk assets like equities could rally significantly higher, a move not being forecast by many but there’s clearly “money in them there hills!”.
MM is bullish Bitcoin & risk assets.
Bitcoin ($US) Chart
Conclusion
MM remains bullish equities but a correction to the strong gains from March still wouldn’t surprise, on the stock level we are looking to utilise proceeds from our sales yesterday to start establishing a position in the gold sector with Newcrest Mining (NCM) our preferred vehicle.
*Watch for alerts.
Have a great day!
James & the Market Matters Team
Disclosure
Market Matters may hold stocks mentioned in this report. Subscribers can view a full list of holdings on the website by clicking here. Positions are updated each Friday, or after the session when positions are traded.
Disclaimer
All figures contained from sources believed to be accurate. All prices stated are based on the last close price at the time of writing unless otherwise noted. Market Matters does not make any representation of warranty as to the accuracy of the figures or prices and disclaims any liability resulting from any inaccuracy.
Reports and other documents published on this website and email (‘Reports’) are authored by Market Matters and the reports represent the views of Market Matters. The Market Matters Report is based on technical analysis of companies, commodities and the market in general. Technical analysis focuses on interpreting charts and other data to determine what the market sentiment about a particular financial product is, or will be. Unlike fundamental analysis, it does not involve a detailed review of the company’s financial position.
The Reports contain general, as opposed to personal, advice. That means they are prepared for multiple distributions without consideration of your investment objectives, financial situation and needs (‘Personal Circumstances’). Accordingly, any advice given is not a recommendation that a particular course of action is suitable for you and the advice is therefore not to be acted on as investment advice. You must assess whether or not any advice is appropriate for your Personal Circumstances before making any investment decisions. You can either make this assessment yourself, or if you require a personal recommendation, you can seek the assistance of a financial advisor. Market Matters or its author(s) accepts no responsibility for any losses or damages resulting from decisions made from or because of information within this publication. Investing and trading in financial products are always risky, so you should do your own research before buying or selling a financial product.
The Reports are published by Market Matters in good faith based on the facts known to it at the time of their preparation and do not purport to contain all relevant information with respect to the financial products to which they relate. Although the Reports are based on information obtained from sources believed to be reliable, Market Matters does not make any representation or warranty that they are accurate, complete or up to date and Market Matters accepts no obligation to correct or update the information or opinions in the Reports. Market Matters may publish content sourced from external content providers.
If you rely on a Report, you do so at your own risk. Past performance is not an indication of future performance. Any projections are estimates only and may not be realised in the future. Except to the extent that liability under any law cannot be excluded, Market Matters disclaims liability for all loss or damage arising as a result of any opinion, advice, recommendation, representation or information expressly or impliedly published in or in relation to this report notwithstanding any error or omission including negligence.