The Fed & now Trump are weighing on stocks (RIO, FMG, NCM)
Reporting season officially kicked off yesterday and there’s already blood on the streets – unfortunately 2 MM stocks have been well and truly caught in the cross-fire. Yesterday the market fell 23-points, a pretty good performance considering the Dow was smacked well over 300-points on Wednesday night but as we know to see the ASX200 get really hit the banks need to fall and they remain firm with 3 of the big 4 managing to close up on the day; as we regularly say at MM “we (Australia) don’t go down without the banks”.
The selling on Thursday was more stock / sector specific with less than 60% of the index closing down while the major selling was felt by the Resources and IT sectors, stocks that have benefited from falling US bond yields.
We are left with a fascinating market quandary - investors are sitting on cash looking for a correction to buy but the market is expensive unless compared to interest rates. At MM we are defensively positioned with our Growth Portfolio holding 26% in cash but as we’ve experienced with both Adelaide Brighton (ABC) and Janus Henderson (JHG) if companies miss on earnings this is an extremely unforgiving market. We remain comfortable with our cash levels looking for opportunities to increase our market exposure if and when opportunities arrive, hopefully we will not receive any further negative surprises, things don’t have to happen in 3’s!
In a very timely fashion yesterday I received a call around lunchtime from an old market player who questioned why the market was holding up so well, obviously because he’s sitting on $$ looking to buy weakness, like ourselves and many other players. Importantly its very unusual that we see markets correct significantly into a cashed up eager market however reporting season, as we have already seen, significantly increases the volatility on the individual stocks level – it’s that time of year to be ready to act as opposed to be like a rabbit frozen in the headlights when stocks fall into pre-identified “buy zones”.
This week has been testament to the benefits of correctly structured portfolios, although our Growth Portfolio has had 2 stocks unceremoniously dumped by the market into the naughty corner our high cash levels and defensive positioning in a declining market has led to cushioned impact on the performance of our portfolio, although it has felt like an extremely tough week in the office.
This morning we’ve seen two more downgrades, a painful 50% miss from Graincorp (GNC) & a 40% miss from Av Jennings (AVJ) which I’ll cover in the audio below, along with the result from Rio Tinto (RIO) overnight.

MM remains comfortable to adopt a more conservative stance than we did for the first half of 2019.
Overnight US stocks were smacked in the last hour of trade as President Trump reignited US - China trade war concerns by putting an additional 10% levy on $300bn worth of US goods, the Dow plunged over 600-points from its intraday high on the news having been strong for most of the session, while oil was hammered over 7% as the phrase “global recession” came back to the fore. The SPI is only calling the ASX200 down 15-points this morning, it feels like more buying must be around in the banks because BHP is set to open down $1.36 / 3.4% and RIO was down more than BHP in London, Resources are coming back towards our buy zones.
Today we are going to look at a few “ad hoc” situations unfolding in today’s market, especially as we are looking to deploy our large cash holding – please excuse the large volume of graphs today but they help explain the points more succinctly.
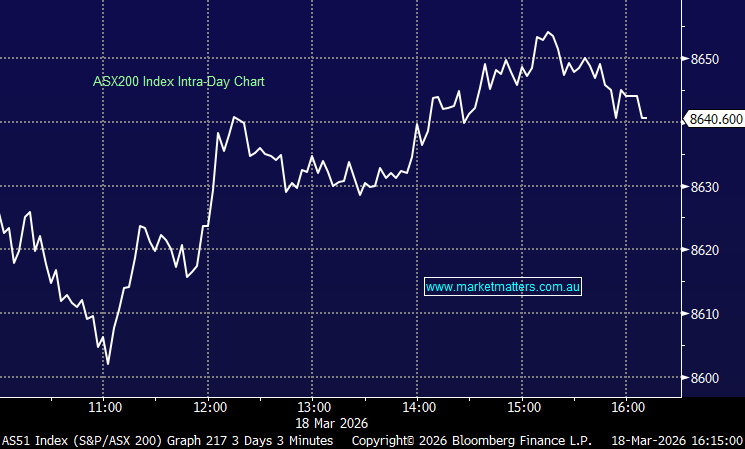
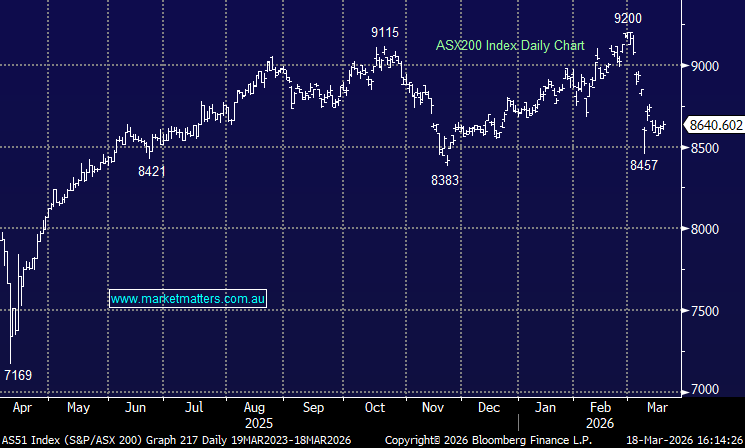
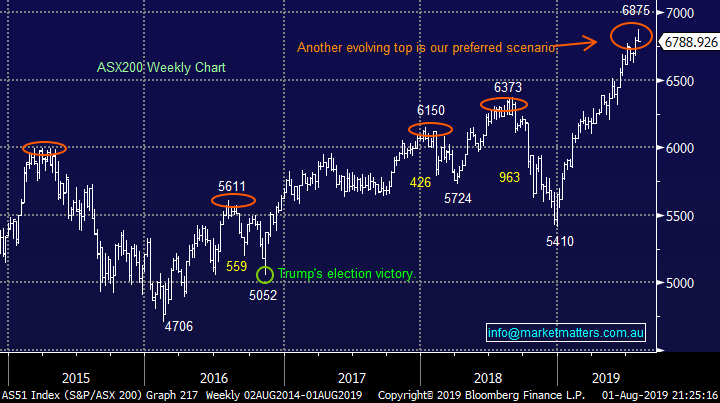
Technically the ASX200 chart below initially targets another 2-3% downside towards the 6600 area.
ASX200 Chart
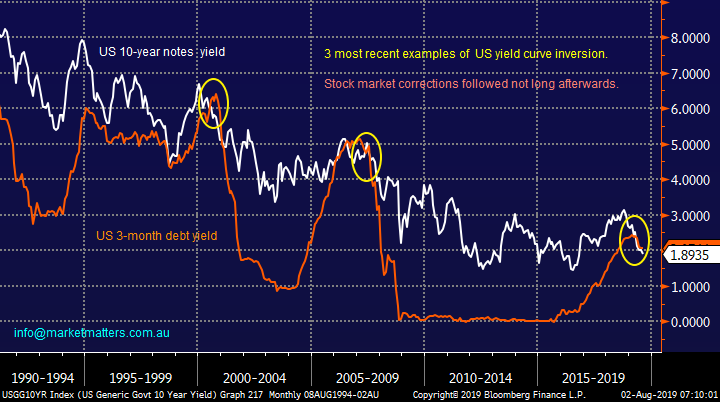
The Fed’s 0.25% rate cut which disappointed many players threatened to push US bond yields higher, a pop towards 2.25% and MM was intending to go short for our ETF Portfolio. However President Trump beat us to the punch with his fresh tariffs on China. US 10-year bond yields plunged below 2% overnight as investors ran for the cover of bonds and in all likelihood increased bets that a recession was looming for the US.
My first reaction was that this is classic Trump “giving the bird” to the Fed and trying to force their hand for further interest rate cuts, this would be like a hippo walking on the beam in the gym, fraught with danger and probably leading to one inevitable and painful conclusion.
However the yield curve was the second thought which crossed my mind and its strongly flashing warning signals for equities and a US recession.
US 10-year bond & 3-month debt yields Chart
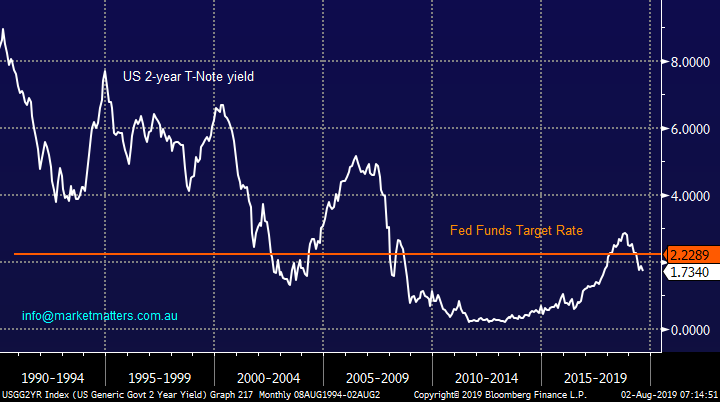
The stock markets health is finely balanced between struggling economic growth and central banks unbridled intention to sustain the post GFC economic expansion by whatever means necessary, although the Fed did deliver a more measured commentary this week. With Australian 10-year bond yields approaching 1% and local equities yielding over 6% including franking we feel any dips in the market will find fairly solid support.
Hence expect MM to start accumulating equities when things look horrible.
US 2 year bonds & Upper band of the Fed Funds Rate Chart
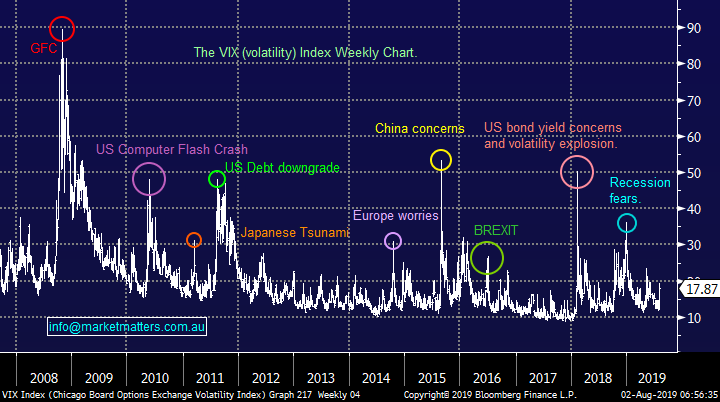
Whatever the Presidents motivation with last night’s action it’s likely to mean months of trade war concerns lie ahead which implies elevated volatility / uncertainty in equities. Overnight the Volatility Index (VIX) rallied by over 10% and moving forward more would not surprise, remember we pointed out earlier in the week that the record short VIX position could easily lead to a sharp correction in equities.
The murmurs coming from the VIX do not put us off buying into weakness but it’s far more likely to be a back foot operation as opposed to an aggressive “all in” approach.
US Volatility Index (VIX) Chart
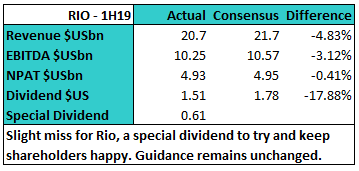
In London RIO trade fell -3.4% and that was when the futures were pointing to a positive session for the US. Its headline “surprise $1.45bn special dividend” obviously hasn’t excited the traders overnight as they saw the slight underlying miss in its earnings and normal dividend again slightly lower than expected.
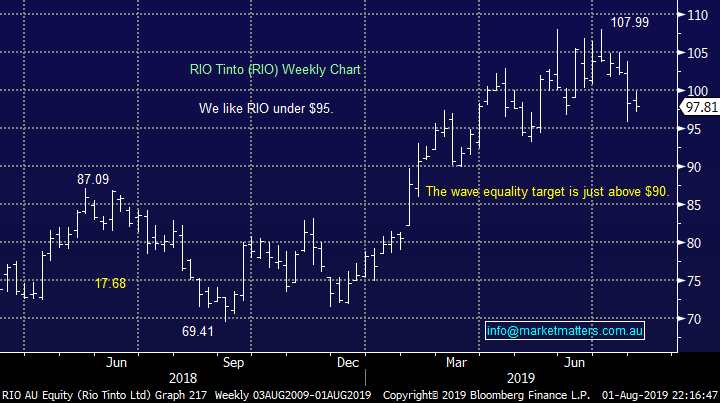
It feels to me that everyone’s long resources (except us) and the pullback we have been targeting to buy is finally unfolding nicely. Our view on RIO has not changed and I think there’s a strong possibility we may be able to start accumulating in the days ahead.
Here’s a quick rundown on the numbers.
MM is looking to buy RIO in the Growth Portfolio around $90-92, or 8% lower.
RIO Tinto Ltd (RIO) Chart
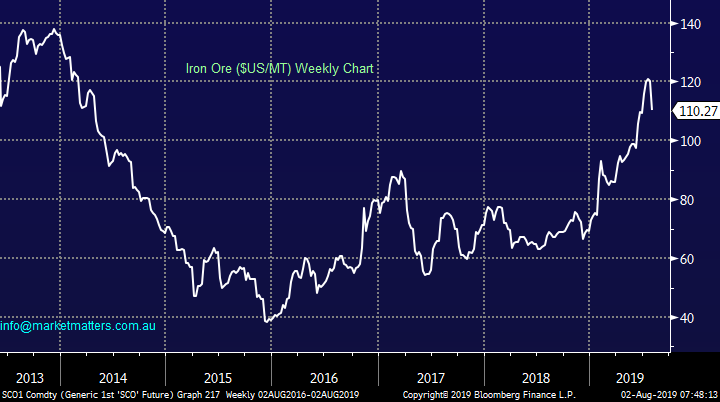
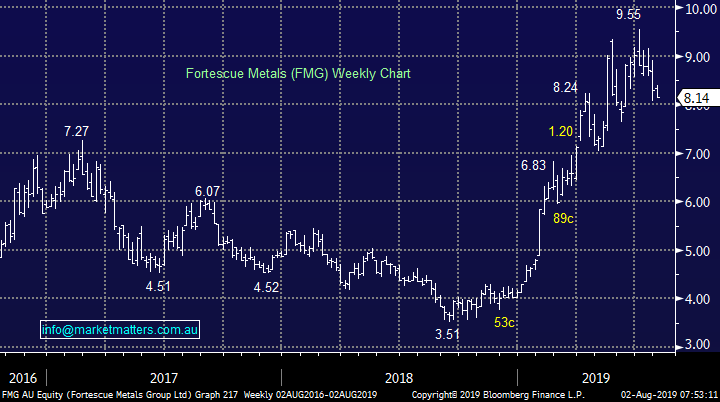
Overnight the reintroduction of tariffs helped push iron ore -2.4% lower, another negative influence for our 3 main producers BHP Group (BHP), RIO Tinto Ltd (RIO) and Fortescue Metals (FMG).
The combination of Trumps tariffs and a slightly less dovish Fed is likely to add significant pressure to the well owned resources sector, our prognosis remains to be patient.
MM is looking to accumulate FMG between $7 and $7.50, or 8-10% lower.
Iron Ore ($US/MT) Chart
Fortescue Metals (FMG) Chart
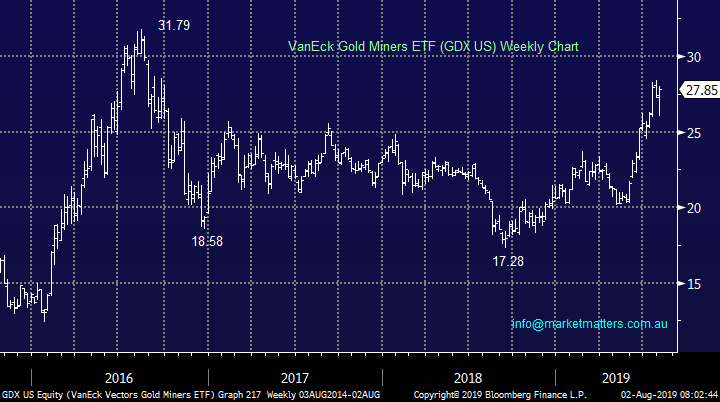
Conversely gold looks excellent having rallied almost $US50/oz on the Trump economic aggression, the GDX ETF which we follow and hold the Australian equivalent gained over 5% on the news. Our 10% exposure to the gold space should enjoy a solid day which fits our long-term outlook for the precious metal.
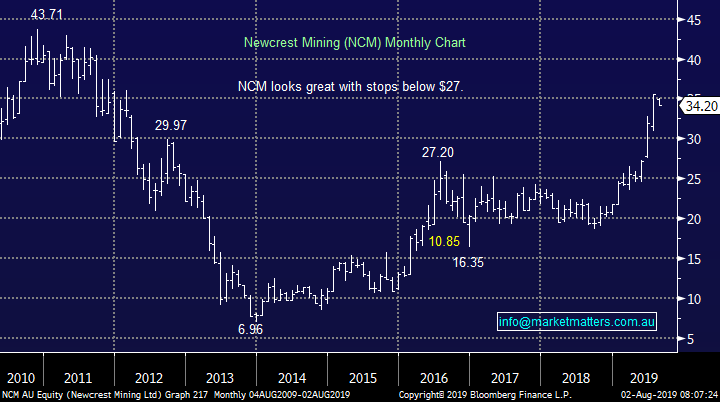
We remain comfortable with our position but are considering the stock specific risk of Newcrest (NCM) into its result, we’ve already seen Northern Star (NST) correct over 16% in the last 2-weeks.
MM is considering switching / legging our NCM position into a gold ETF, potentially simply increasing our existing GDX AXW holding.
NB Legging means sell NCM into a strong day, probably like today and then buying potential weakness a few days later, similar to what was experienced by the gold stocks yesterday.
VanEck Gold Miners ETF (GDX US) Chart
Newcrest Mining (NCM) Chart
Conclusion (s)
We are looking to remain patient into re-entering the resources space but our buy zones are approaching fast.
We are considering switching / legging our NCM position into a gold ETF.
NB While we’ve had a tough few days with ABC and JHG, this does not mean MM will stop following our plans including buying weakness in some areas.
Global Indices
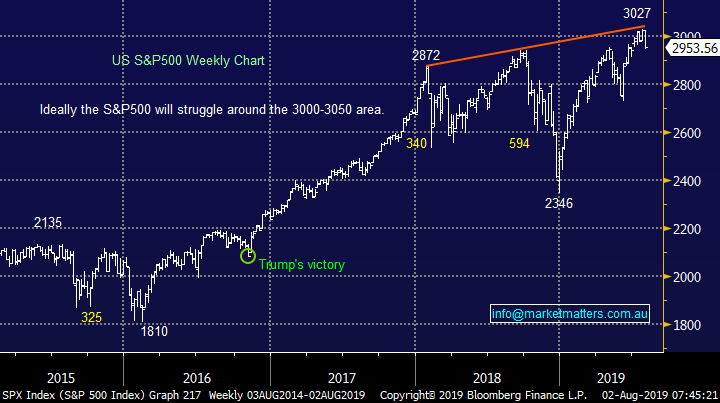
No major change with US stocks still feeling vulnerable to us at this stage, a break back below 2950 by the S&P500, now only a breath away, will be a definite technical concern to MM.
We reiterate that while US stocks have reached our target area they have “not yet” generated any technical sell signals.
US S&P500 Index Chart
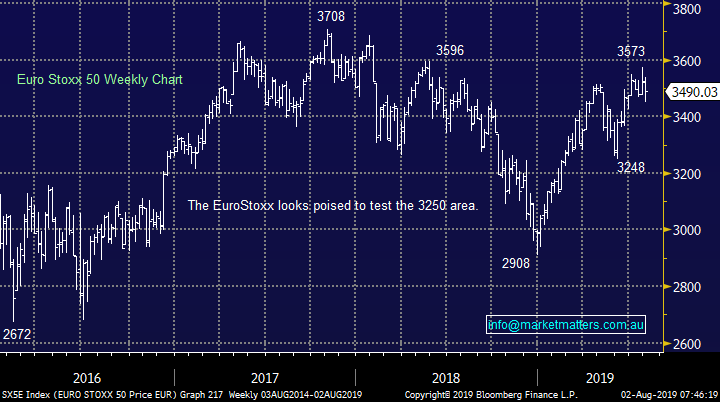
No change again with European indices, we remain very cautious European stocks as their tone has becoming more bearish over the last 2-weeks, we are actually targeting a correction of at least 5% for the broad European indices.
Euro Stoxx 50 Chart
Overnight Market Matters Wrap
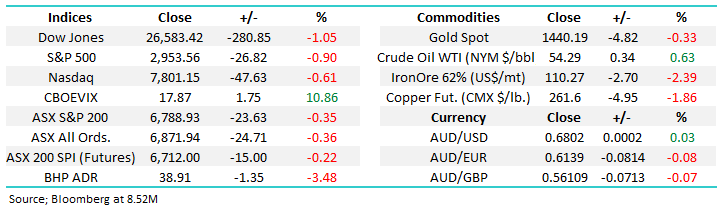
· The SPI is down 15 points as US stocks initially rallied, but then closed down amid more US-China trade drama. The NASDAQ closed down 0.8%, the S&P 500 was 0.9% lower and the Dow was the worst performer, declining more than 1%.
· President Trump tweeted that the US will impose a new 10% tariff on $300B of Chinese imports after recent talks failed, despite officials calling the meeting constructive.
· Investors switched out of equities into bonds and gold. US 10 year government bonds are now yielding just 1.89% and gold rallied 2% to $US1445/oz. US manufacturing activity fell to its weakest level in three years, which sent oil plummeting.
· WTI crude was belted 8%, and Brent fell more than 6%. Nickel rose on the LME, while copper and aluminium fell. Iron ore declined 1% to $US116/t. The Aussie battler is trading at $US0.68.
Have a great day!
James & the Market Matters Team
Disclosure
Market Matters may hold stocks mentioned in this report. Subscribers can view a full list of holdings on the website by clicking here. Positions are updated each Friday, or after the session when positions are traded.
Disclaimer
All figures contained from sources believed to be accurate. Market Matters does not make any representation of warranty as to the accuracy of the figures and disclaims any liability resulting from any inaccuracy. Prices as at 02/08/2019
Reports and other documents published on this website and email (‘Reports’) are authored by Market Matters and the reports represent the views of Market Matters. The MarketMatters Report is based on technical analysis of companies, commodities and the market in general. Technical analysis focuses on interpreting charts and other data to determine what the market sentiment about a particular financial product is, or will be. Unlike fundamental analysis, it does not involve a detailed review of the company’s financial position.
The Reports contain general, as opposed to personal, advice. That means they are prepared for multiple distributions without consideration of your investment objectives, financial situation and needs (‘Personal Circumstances’). Accordingly, any advice given is not a recommendation that a particular course of action is suitable for you and the advice is therefore not to be acted on as investment advice. You must assess whether or not any advice is appropriate for your Personal Circumstances before making any investment decisions. You can either make this assessment yourself, or if you require a personal recommendation, you can seek the assistance of a financial advisor. Market Matters or its author(s) accepts no responsibility for any losses or damages resulting from decisions made from or because of information within this publication. Investing and trading in financial products are always risky, so you should do your own research before buying or selling a financial product.
The Reports are published by Market Matters in good faith based on the facts known to it at the time of their preparation and do not purport to contain all relevant information with respect to the financial products to which they relate. Although the Reports are based on information obtained from sources believed to be reliable, Market Matters does not make any representation or warranty that they are accurate, complete or up to date and Market Matters accepts no obligation to correct or update the information or opinions in the Reports. Market Matters may publish content sourced from external content providers.
If you rely on a Report, you do so at your own risk. Past performance is not an indication of future performance. Any projections are estimates only and may not be realised in the future. Except to the extent that liability under any law cannot be excluded, Market Matters disclaims liability for all loss or damage arising as a result of any opinion, advice, recommendation, representation or information expressly or impliedly published in or in relation to this report notwithstanding any error or omission including negligence.