The Banks Propel the ASX200 to New Decade Highs! (A2M, ORE, JHG, IFL)

The ASX200 has outperformed most global indices over the last week and reason is simple – the Australian banks are back in favour. We felt a squeeze into yesterday’s June futures expiry was strong possibility and this proved correct, the coming days will now allow us to gauge the markets strength into EOFY, now only 7-trading days away.
Donald Trump’s now been in power for around 1 ½ years and we feel equities are slowly becoming too complacent about almost any potentially negative news that flashes across our Bloomberg terminals, the perfect scenario for a stock market top - BUT we feel the current rally is not over just yet. When the market has been in a different mindset the US-China $200bn tit-for-tat tariff posturing may have a easily led to a 5-10% correction but this week its been shrugged off as unlikely to manifest itself further. We believe this comfort in equities will eventually be its undoing moving forward – it was only 4-months ago that stocks plummeted over 10% on bond yield fears but as we expected at the time this has fairly rapidly been forgotten, the next time we may actually follow through.
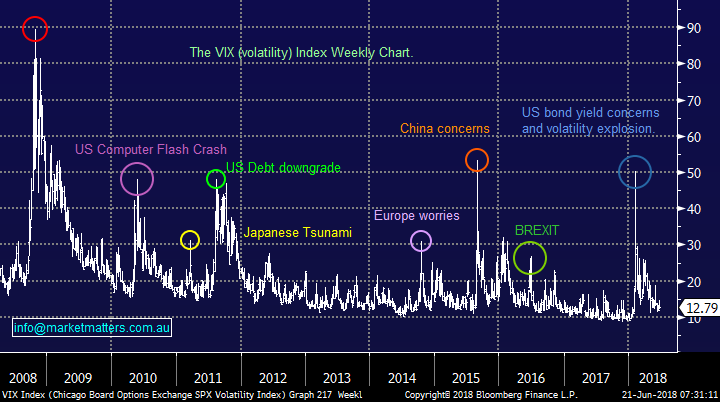
Overnight stocks were pretty quiet with the only thing catching our eye the Volatility Index (VIX), often referred to as the fear gauge, slipping back below 13% closing down over 4% on the night – we believe there’s a very strong possibility this will kick back above 20% at some stage in 2018.
Volatility Index (VIX) Chart
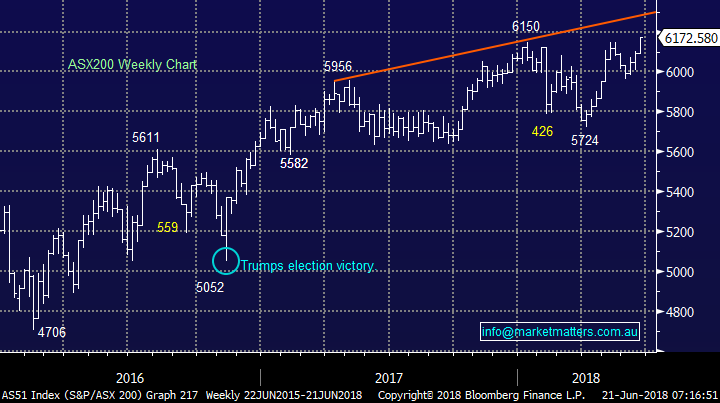
As all of you know by now the ASX200 broke out yesterday closing at levels not seen since January 2008. It’s always hard to gauge how far a market will actually extend when it makes fresh highs but we’ve had the 6250 area earmarked for months and there is no reason to change this target at this point in time.
- Short-term MM remains mildly positive with a close below 6090 now required to negate this view however we remain in “sell mode”.
ASX200 Chart
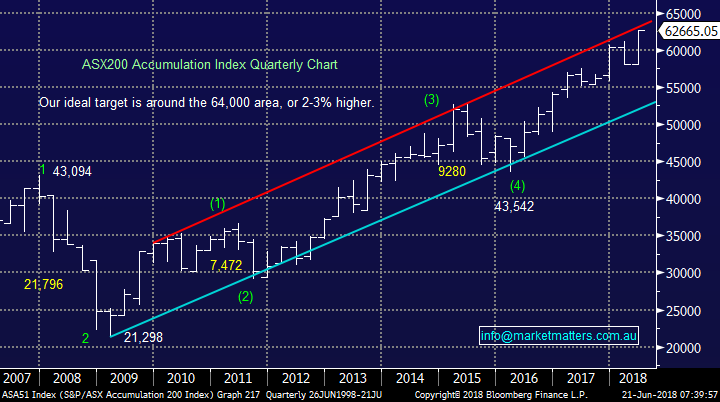
Also, the ASX200 Accumulation Index ( including dividends) made new all-time highs yesterday and now sits only a few percent below our long-term target for the index.
If we are correct this is the time to be slowly adjusting portfolios to a more defensive stance, as opposed to becoming euphoric and chasing stocks into strength.
ASX200 Accumulation Index Chart
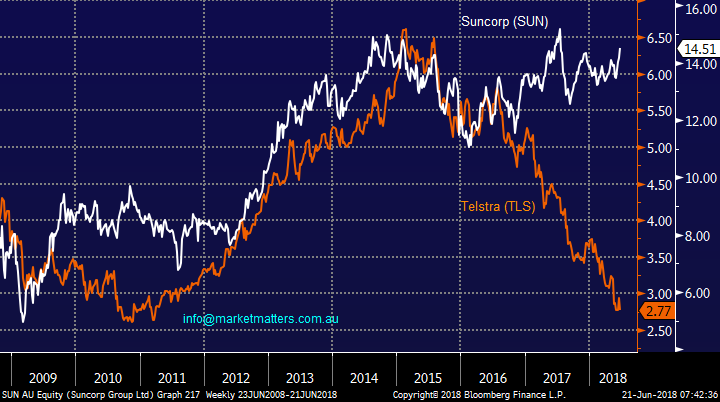
Yesterday we made a relatively bold move and took a healthy ~30% profit on a small portion of our Suncorp (SUN) position, switching the funds into Telstra.
- The AFR was screaming from the rooftops yesterday that the ASX200 had made a fresh decade high while Telstra (TLS) was at a 7-year low – this helped us pull the trigger!
While our switch is clearly aggressive stocks generally do move like an elastic band and we’ve witnessed this with the banks e.g. Commonwealth Bank (CBA) has surged $4.69 / 7% in the last 4-days.
It’s likely to take some time before we are comfortable with our Telstra holding but our current target is ~$3.50, although this may be a big ask after Augusts 11c fully franked dividend.
NB We remain bullish Suncorp (SUN) targeting 7-8% further upside hence we continue to hold 10% of the Growth Portfolio in the stock i.e. still a large overweight holding.
Suncorp (SUN) v Telstra (TLS) Chart
Today’s report is going to focus on 4 positions MM are considering closing, or reducing, over the coming weeks – we believe this is steadily evolving into a time for action.
We understand that our competitors spend most of their time providing “3 stocks to buy now” but MM strongly believes selling is too often forgotten, especially as it’s such a huge part of successful investing - as subscribers know we are in “sell mode” hence this is where our main attention is currently focused.
4 MM stocks on our radar
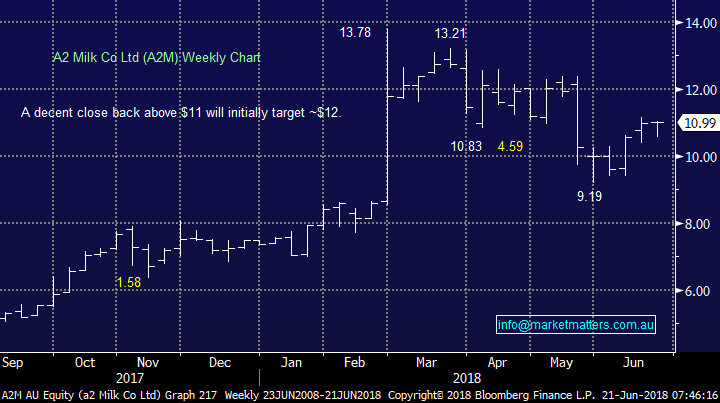
1 A2 Milk (A2M) $10.99
A2M has been a market favourite over the last few years but the recent 30% drop returned the higher flyer to normal status, however a valuation of 45x earnings still carries plenty of risks if future company news is not market friendly.
We averaged our position into the recent plunge which is now showing us a 4% paper profit after being uncomfortably over 10% underwater at the height of the panic.
Goliath investor Blackrock building a stake in the company has definitely helped our cause but we should remember they are also human and get things wrong. A2M has enjoyed a great financial year and is candidate for a push into next Friday, which would make many fund managers look good on paper.
- MM will consider taking all / part profit in A2M moving into EOFY.
A2 Milk (A2M) Chart
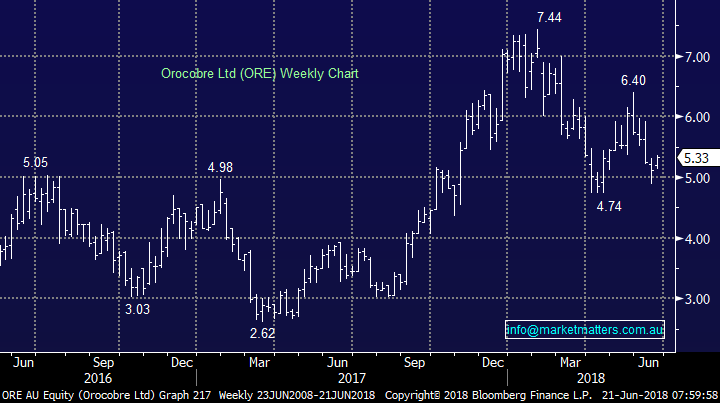
2 Orocobre (ORE) $5.33
We’ve enjoyed some excellent forays into the lithium space during this financial year but our latest purchase of ORE below $5.80 is putting a little pressure on our Growth Portfolio, its currently showing an almost 8% paper loss.
Its now feeling like the car battery market needs to evolve further to justify current lithium prices plus fresh supply is concerning many analysts. In other words the easy money in lithium may be behind us for now.
Similar to A2M Orocobre has enjoyed a great financial year and is candidate for a push into next Friday, which may potentially provide us with a good exit level.
- We are looking to exit ORE into strength as we now feel the sidelines are the best place with lithium stocks for now.
Orocobre (ORE) Chart
3 Janus Henderson (JHG) $43.61
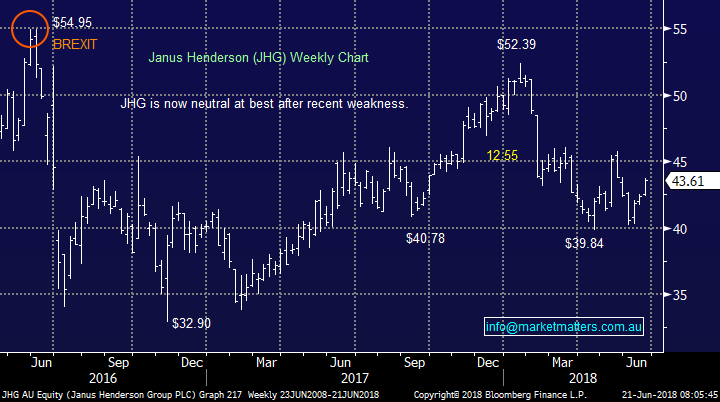
At MM we like JHG’s product mix and $US earning exposure and believe the stock is on the cheap side trading on a valuation of 11x earnings while it yields 4% unfranked but we’ve given it room and its clearly been caught up in the flight from diversified financials which are down over the last month while the index has rallied.
Considering our medium-term view on equities its unlikely MM will hold both of our JHG and IFL positions through most of 2018 so it’s a matter of evaluating what’s the best selling, and where.
We prefer JHG over IFL but price remains an integral part of the decision making process.
- MM will consider selling our JHG position above $45, or 3% higher.
Janus Henderson (JHG) Chart
4 IOOF Holdings (IFL) $9.13
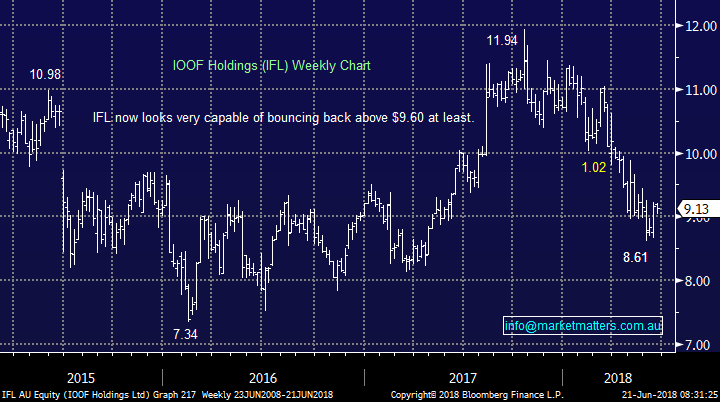
IFL has not rewarded our patience over the last few months as the market has given its business model plus accusation of ANZ’s pensions and investments business the clear thumbs down. – simply another casualty of the Hayne royal commission.
However we’ve seen CBA rally hard over the last few days and on balance IFL looks very capable of bouncing back above $9.50.
- MM is considering taking a loss on IFL above $9.50.
IOOF Holdings (IFL) Chart
Conclusion
We have a “sellers hat” firmly in place with all 4 of today’s stocks a prospect over coming weeks i.e. A2M, ORE, JHG and IFL.
Overseas Indices
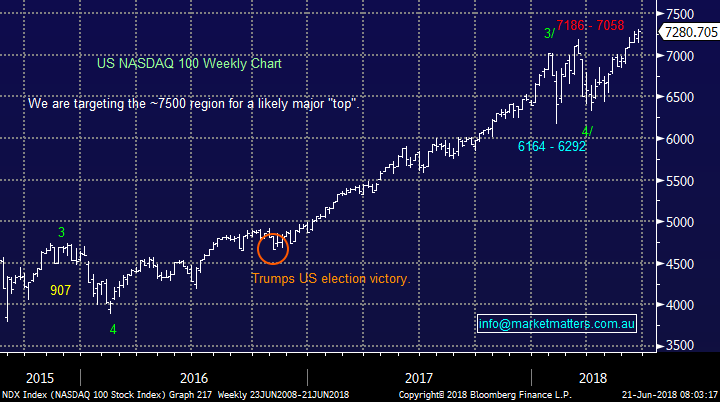
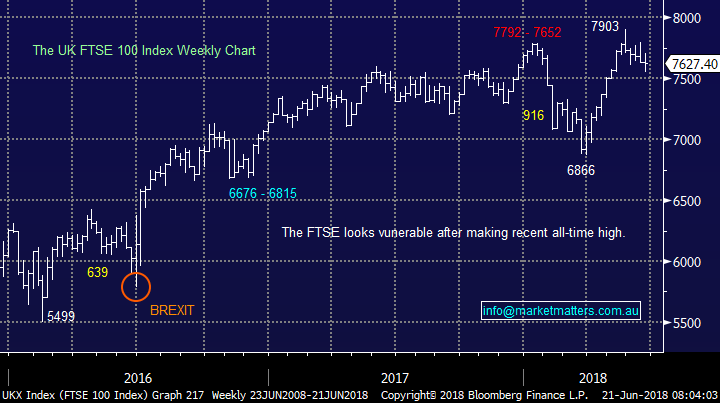
No change, the tech-based NASDAQ remains around its all-time high while the UK FTSE is threatening to fail after achieving its same milestone 2-weeks ago.
Hence, we are on alert for a decent market correction and are still looking to increase our cash position into EOFY.
US NASDAQ Chart
UK FTSE Chart
Overnight Market Matters Wrap
· Strong investor demand for technology shares lifted the Nasdaq into record territory overnight, helped in particular by Netflix and Facebook, which both hit new highs, and a bidding war for the entertainment assets of Rupert Murdoch’s 21st Century Fox.
· The broader market however was less inspiring, with the Dow closing slightly lower - after being 100 pts stronger in earlier trading - and the S&P 500 slightly higher. Starbucks fell 9% after it announced lower than expected sales forecasts and plans to close 150 stores.
· Commodities were mixed with gold continuing its recent selloff closing around US$1270/oz. and iron ore 1.4% weaker.
· The September SPI Futures is indicating the ASX 200 to open 23 points higher towards the 6200 level with volatility expected this morning on June SPI Futures and Index Option Expiry.
Have a great day!
James & the Market Matters Team
Disclosure
Market Matters may hold stocks mentioned in this report. Subscribers can view a full list of holdings on the website by clicking here. Positions are updated each Friday, or after the session when positions are traded.
Disclaimer
All figures contained from sources believed to be accurate. Market Matters does not make any representation of warranty as to the accuracy of the figures and disclaims any liability resulting from any inaccuracy. Prices as at 21/06/2018.
Reports and other documents published on this website and email (‘Reports’) are authored by Market Matters and the reports represent the views of Market Matters. The MarketMatters Report is based on technical analysis of companies, commodities and the market in general. Technical analysis focuses on interpreting charts and other data to determine what the market sentiment about a particular financial product is, or will be. Unlike fundamental analysis, it does not involve a detailed review of the company’s financial position.
The Reports contain general, as opposed to personal, advice. That means they are prepared for multiple distributions without consideration of your investment objectives, financial situation and needs (‘Personal Circumstances’). Accordingly, any advice given is not a recommendation that a particular course of action is suitable for you and the advice is therefore not to be acted on as investment advice. You must assess whether or not any advice is appropriate for your Personal Circumstances before making any investment decisions. You can either make this assessment yourself, or if you require a personal recommendation, you can seek the assistance of a financial advisor. Market Matters or its author(s) accepts no responsibility for any losses or damages resulting from decisions made from or because of information within this publication. Investing and trading in financial products are always risky, so you should do your own research before buying or selling a financial product.
The Reports are published by Market Matters in good faith based on the facts known to it at the time of their preparation and do not purport to contain all relevant information with respect to the financial products to which they relate. Although the Reports are based on information obtained from sources believed to be reliable, Market Matters does not make any representation or warranty that they are accurate, complete or up to date and Market Matters accepts no obligation to correct or update the information or opinions in the Reports.
If you rely on a Report, you do so at your own risk. Any projections are estimates only and may not be realised in the future. Except to the extent that liability under any law cannot be excluded, Market Matters disclaims liability for all loss or damage arising as a result of any opinion, advice, recommendation, representation or information expressly or impliedly published in or in relation to this report notwithstanding any error or omission including negligence.
To unsubscribe. Click Here


