Telstra may have given us a big clue to what comes next (TLS, GOLD)

Yesterday the ASX200 put in a disappointing performance after promising so much earlier in the day. After trading up almost 30-points on the open with the banks finally joining the resources in some early September cheer, unfortunately the day slowly fizzled away to close unchanged, with only the traditional last 30-min ramp avoiding an unexpected decline. The best performing sector was the Telco’s for a change, with the Healthcare stocks carrying the wooden spoon.
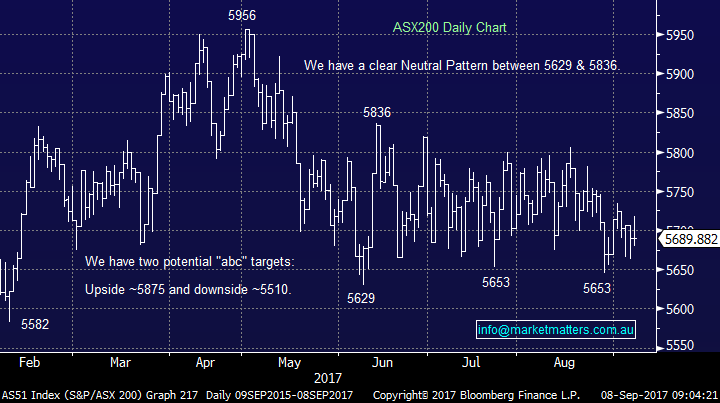
It continues to amaze many of us that the local market can remain between 5629 and 5836 for 16-weeks and counting, although another decent drop from overseas stocks and we will be definitely challenging the bottom of the trading range. Our preferred scenario remains a correction towards 5550 for a short-term buying opportunity, ideally in the next 2-weeks, but there’s no doubt markets remain very unpredictable day to day.
ASX200 Daily Chart
US Stocks
US equities had a very quiet night as all eyes remain on hurricane Irma and of course North Korea. Historically hurricanes only have a short-term detrimental “blip” style impact on the US economy before the reconstruction commences to offset the obvious negatives.
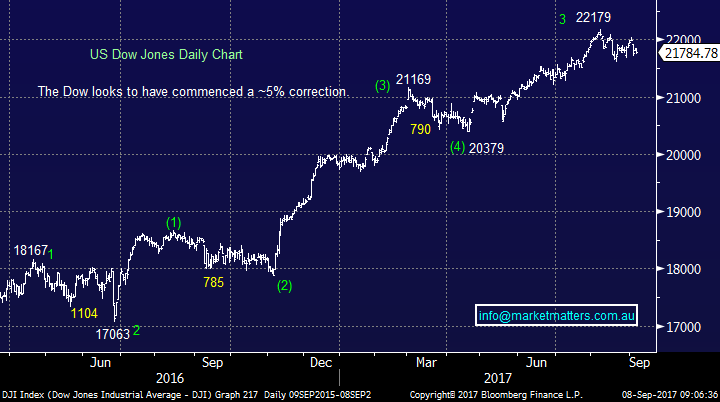
There is no change to our short-term outlook for US stocks where we are targeting a ~5% correction i.e. a further 725-points for the Dow.
US Dow Jones Daily Chart
European Markets
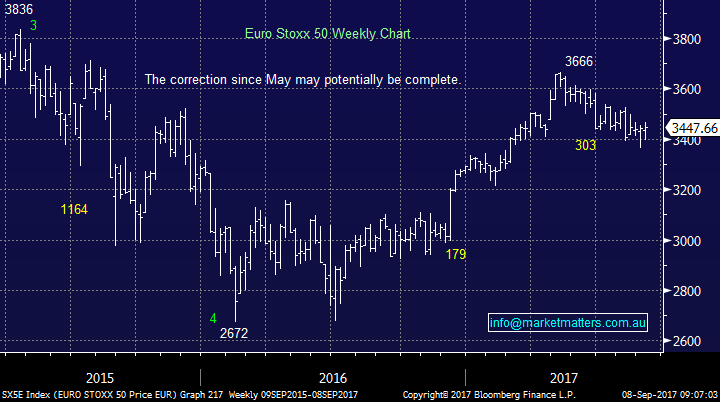
We feel European stocks are looking for / have found a decent low since the significant top back in early May. The Euro Stoxx 50 has slowly ground 8.3% lower over this time but we remain bullish European stocks targeting fresh post GFC highs i.e. around 15% higher.
The ASX200 has been far more correlated to European stocks than the US in 2017 and our view above bodes well for the coming 1 / 2 quarters for the local index.
Euro Stoxx 50 Weekly Chart
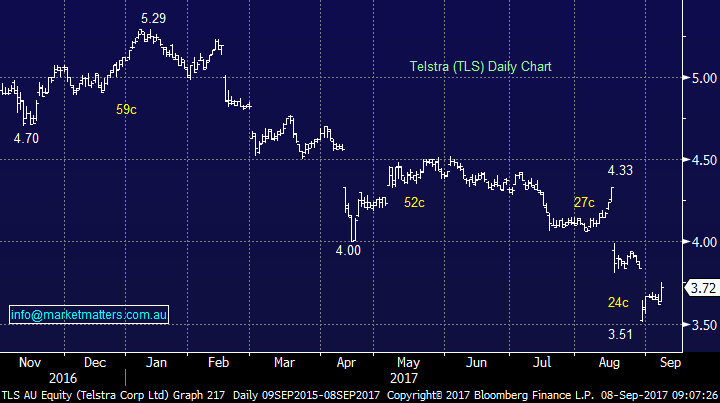
Yesterday Telstra (TLS) rallied 10c / 2.8% after a number of broker upgrades and was actually up by 13c at one stage reaching its highest level since it went ex-dividend 15.5c fully franked at the end of August. In terms of the upgrades, Credit Suisse now has an outperform and $4 price target – hardly super bullish however the market takes note of CS in terms of TLS – they’re ranked No 1 on that stock and have called it exceptionally well over time. They’ve now gone from bearish (S), to reasonably bullish (B/outperform) and this will force other analysts to review their thesis on the stock.
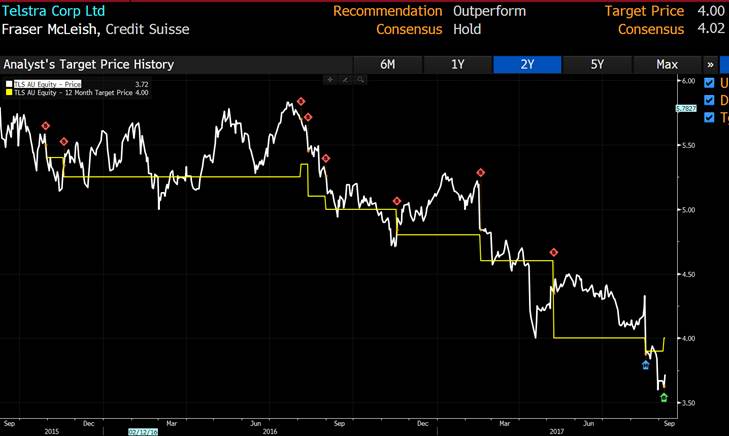
If you want a more bullish assessment, turn to HSBC with a $5.30 target – however they’re ranked lowly (8th) on that stock so their views hold little weight.
The volume on TLS was decent yesterday at almost 55m shares but nothing like the 227m shares that changed hands after their poor result mid-August, or the 80m and 86m shares respectively that traded on the 2 days when the stock recently panicked down towards $3.50.
Markets have an uncanny ability of becoming too bullish at tops and too bearish at bottoms – and clearly the bears have been out in force for TLS. Importantly though, Fund Managers are now underweight the stock, which is 2.72% of the ASX 200 – if the stock starts to run, fundies will chase it!
More broadly, we know that the market is “long cash” and when fund managers push the buy button the lack of sellers may create a significant rally in the market, however we feel this is likely from lower levels.
On the TLS front we are long and making money but remember we regard this is a very active position, our current view:
1 We are definitely sellers close to $4 but this level may be lowered moving forward. A sale at $4 would represent a gain of around ~9%
2. We are buyers of fresh lows around $3.40.
Telstra (TLS) Daily Chart
We continue to look for a short-term pullback by US stocks as mentioned earlier but definitely don’t believe it’s yet time to “get off the train”. Major tops usually unfold in one of two forms:
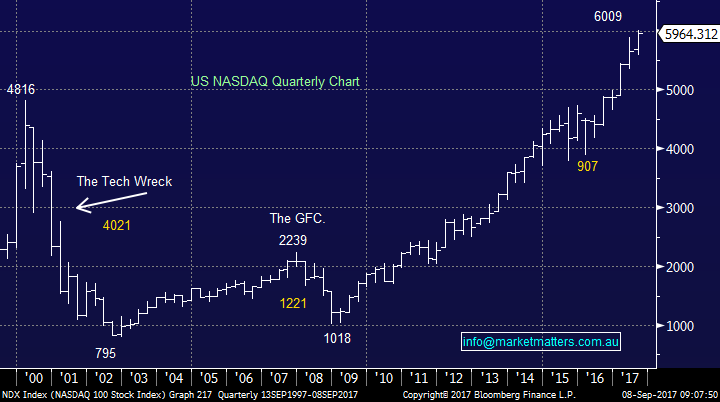
1. A panic blow-off top where “fear of missing out” (FOMO) takes over from common sense, this was clearly evident by the NASDAQ in 1999 / 2000 before the painful “Tech Wreck”.
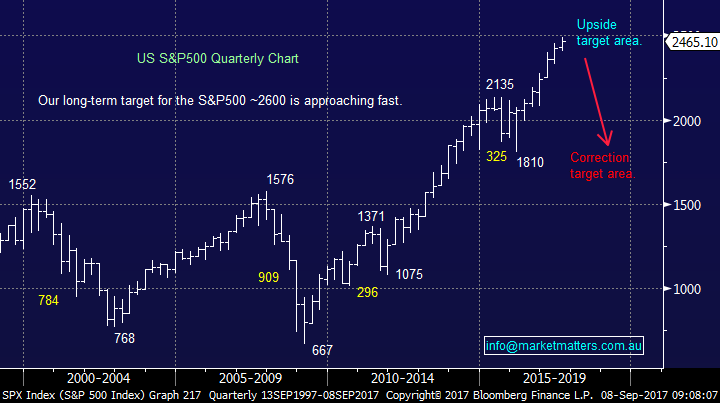
2. The US’s main index the S&P500 has experienced two major (50.5% & 57.7%) and two minor (21.6% & 15.2%) corrections since the year 2000. On all 4 occasions, the market traded around its top for over 6-months before falling i.e. a “rounded top”.
NASDAQ Quarterly Chart
US S&P500 Quarterly Chart
We have no way of knowing at this stage the style of the next top when it does arrive, all we can do is keep our finger on the pulse and constantly evaluate the market. Interestingly there are a few catalysts looming that could propel US stocks to a panic blow off top, but time will tell:
1. Fund managers are negative the market and holding elevated cash levels.
2. Donald Trump is looking to drop the US corporate tax rate from 35% to 20%, investors have lost confidence in this outcome but we believe it remains a very strong possibility.
3. Trump is also trying to force corporate America to repatriate around 4 trillion dollars sitting overseas basically avoiding tax. If he’s just partly successful this could create a tsunami of buying of US assets including stocks, especially via buybacks.
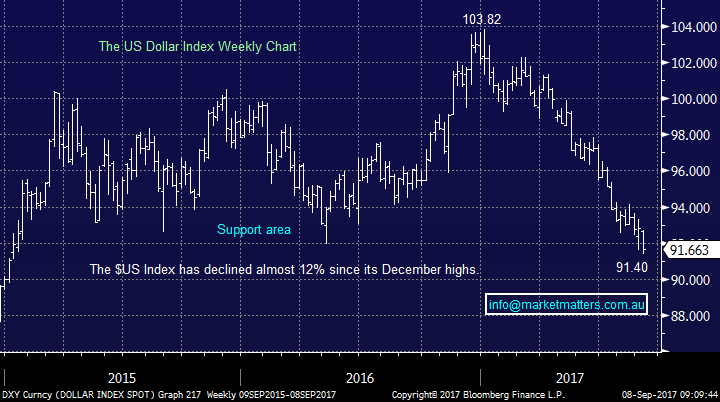
As we witness the savage decline of the $US in 2017 it’s clear that global investors do not believe the US President will get his way but it should not be ruled out as he looks to get some wins on the board after his Obamacare failure.
US Dollar Index Weekly Chart
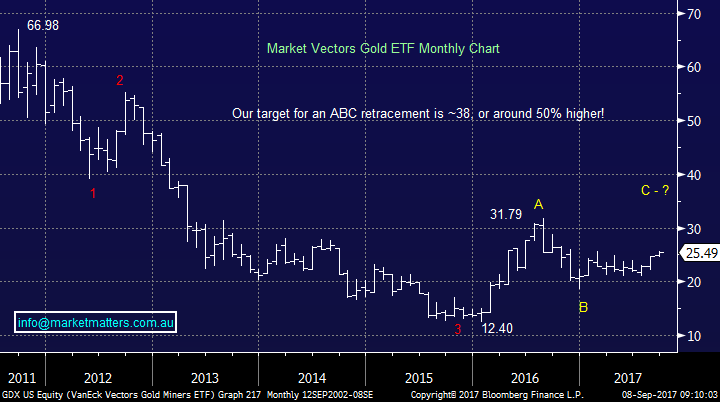
Lastly, we could finish today’s report without touching again on gold which is benefiting from the weak $US. Gold ETF’s rallied another ~2% last night and are very close to breaking out to fresh 2017 highs, for gold to continue towards our $US1,450 target (+7.5% higher) the likelihood is the $US will remain weak for now at least, unless trouble flares up in a big way on the geo-political front.
VanEck Vectors Gold ETF (GDX) Monthly Chart
Conclusion (s)
Remain open-minded and continue to look for buying opportunities into weakness for both individual stocks and the overall market.
Overnight Market Matters Wrap
· The US markets closed mixed with little change overnight, with the volume traded below average.
· Across to Europe, shares rallied following comments from the European Central Bank leaving rates at current ultra-low levels and have no intention to end the current stimulus any time soon.
· The September SPI Futures is indicating the ASX 200 to test the 5700 level yet again this morning.
Disclosure
Market Matters may hold stocks mentioned in this report. Subscribers can view a full list of holdings on the website by clicking here. Positions are updated each Friday.
Disclaimer
All figures contained from sources believed to be accurate. Market Matters does not make any representation of warranty as to the accuracy of the figures and disclaims any liability resulting from any inaccuracy. Prices as at 08/09/2017. 8.00AM.
Reports and other documents published on this website and email (‘Reports’) are authored by Market Matters and the reports represent the views of Market Matters. The MarketMatters Report is based on technical analysis of companies, commodities and the market in general. Technical analysis focuses on interpreting charts and other data to determine what the market sentiment about a particular financial product is, or will be. Unlike fundamental analysis, it does not involve a detailed review of the company’s financial position.
The Reports contain general, as opposed to personal, advice. That means they are prepared for multiple distributions without consideration of your investment objectives, financial situation and needs (‘Personal Circumstances’). Accordingly, any advice given is not a recommendation that a particular course of action is suitable for you and the advice is therefore not to be acted on as investment advice. You must assess whether or not any advice is appropriate for your Personal Circumstances before making any investment decisions. You can either make this assessment yourself, or if you require a personal recommendation, you can seek the assistance of a financial advisor. Market Matters or its author(s) accepts no responsibility for any losses or damages resulting from decisions made from or because of information within this publication. Investing and trading in financial products are always risky, so you should do your own research before buying or selling a financial product.
The Reports are published by Market Matters in good faith based on the facts known to it at the time of their preparation and do not purport to contain all relevant information with respect to the financial products to which they relate. Although the Reports are based on information obtained from sources believed to be reliable, Market Matters does not make any representation or warranty that they are accurate, complete or up to date and Market Matters accepts no obligation to correct or update the information or opinions in the Reports.
If you rely on a Report, you do so at your own risk. Any projections are estimates only and may not be realised in the future. Except to the extent that liability under any law cannot be excluded, Market Matters disclaims liability for all loss or damage arising as a result of any opinion, advice, recommendation, representation or information expressly or impliedly published in or in relation to this report notwithstanding any error or omission including negligence.
To unsubscribe. Click Here


