Tax cuts & Moody’s help the ASX200 rally (SUN, CYB, PPT, CBA)
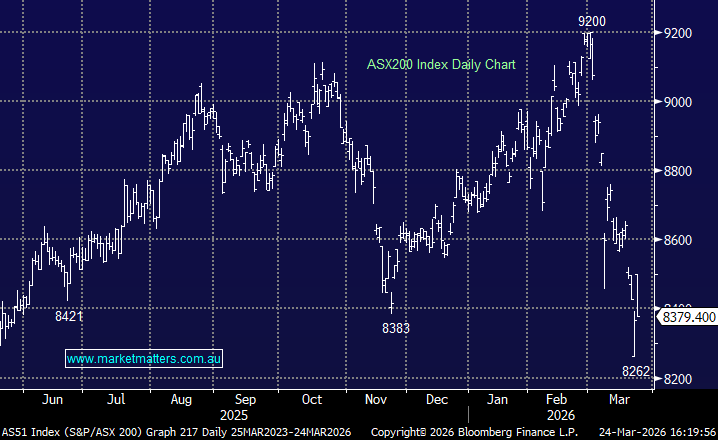
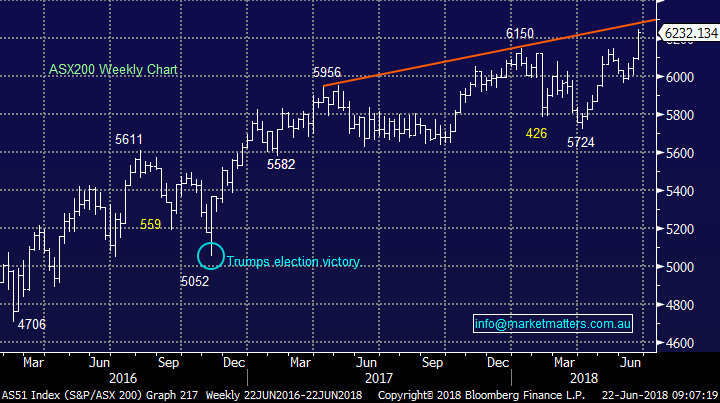
The ASX200 roared out of the blocks and remained strong all day with only a few blemishes on the scorecard, the market again closed at a fresh decade high up another 1% achieving our 6250-target in the process. The banks were again the driving force for the index with Commonwealth Bank (CBA) now up almost 8% over the last 5 days – another great example of stocks / indices simply falling / rallying too far i.e. our elastic band analogy.
We have been regularly challenged by subscribers around our bullish 6250-target area for the ASX200, understandable in the face of continual disturbing macro-economic news flow but at MM we actually believe the far tougher job will be identifying when the risk / reward dictates a far more defensive, or even “short” stance for the MM Portfolio’s – it may be sooner rather than later.
The 2 below pieces of news theoretically should be supportive of local stocks at least into EOFY:
1. Moody’s and CoreLogic have come out saying the worst is over for Australian housing, a shot in the arm for equities and especially the banks if they prove correct.
2. Courtesy of Pauline Hanson the Liberal government have passed their personal tax cut package with corporate cuts flagged to be next, potentially very bullish.
At this stage the momentum is solid but things can change quickly, we continue to monitor catalysts that may challenge the positive market sentiment. The last week has clearly illustrated how the local market can run its own race for at least a few weeks unfortunately it was also evident by our lack of strength when global indices rallied hard – we must not get too caught up in external influences and focus on our own positions / market.
· MM is now neutral the ASX200 with a close below 6140 required to concern us, however we remain in “sell mode”.
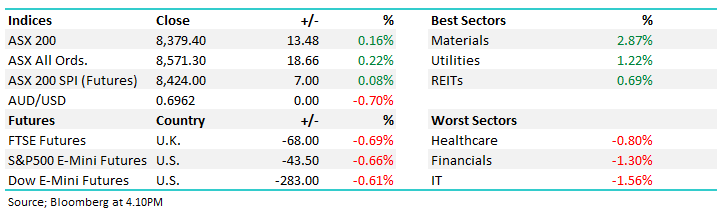
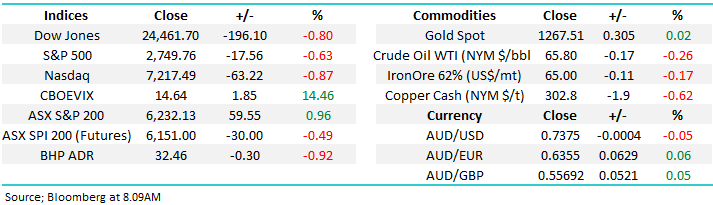
Overnight stocks and risk assets were weak with the Dow falling almost 200-points and the SPI futures are pointing to a -0.5% drop in early trade, BHP is set to underperform closing down ~1% in the US as the resources sector remains heavy.
Today’s report is going to look at another 4 stocks in the MM portfolio’s as we look to de-risk and increase cash levels.
ASX200 Chart
This week we have implemented 2 switches within the MM Growth Portfolio both in our opinion slightly increasing the defensive stance of our portfolio.
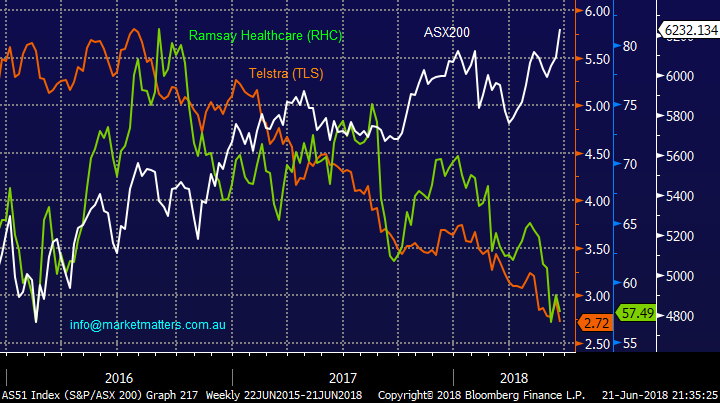
The current correlation between the ASX200 and our 2 purchases Telstra (TLS) and Ramsay Healthcare (RHC) is almost perfectly inverted:
· Over the last year the ASX200 is up +10.1% while RHC is -19.8% and TLS -35.8%.
However, we stress this is most definitely not the reason to execute a switch / position. Our reasoning has been outlined along the way for months, hopefully it will now play out:
· RHC- at MM we’ve been bearish Ramsay Healthcare (RHC) during virtually all of its 35% decline, targeting the $55 area to go long. Today our target was achieved and we dipped our toe in the water buying 3%, unfortunately it was almost impossible to get on board around todays lows but we still bought following our plan. We believe longer-term the ageing population and governments desire / need to pass on some of the health burden to private operators is a great tailwind for RHC and the near term earnings ‘flat spot’ has now been more than priced in.
· TLS – we’ve been waiting to average our position for months initially targeting ~$3.20 but it simply felt wrong at the time and this week’s ~15% superior entry shows “gut feel” has its place at times. Moving forward we like that TLS is looking to evolve and although it will undoubtedly be a bumpy ride we like the position for now. Importantly however, and I discussed this with a client yesterday, we’re not married to the position and will continue to asses it on its merits.
NB “Insiders” were selling RHC shares back in March, how often do we see this, the shares are now ~12% lower following the downgrade – this insider selling made it easy to avoid RHC in the mid $60 region.
ASX200 v Telstra (TLS) & Ramsay Healthcare (RHC) Chart
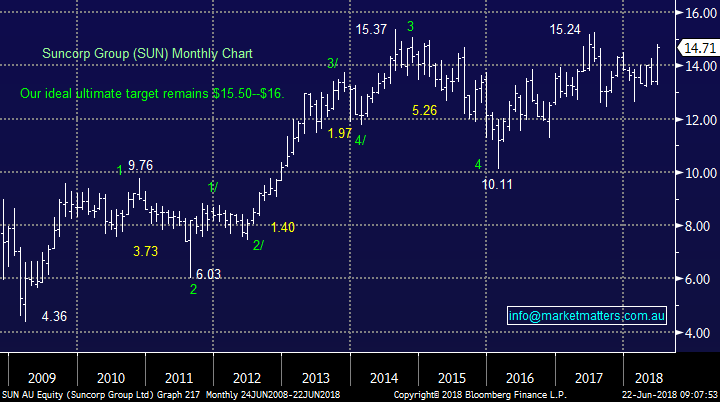
1 Suncorp (SUN) $14.71
We continue to hold a decent position in Suncorp (SUN) in both our Platinum and Income portfolio’s, the stock has been in the hot sector of late with SUN up over 6% in the last 5-days. The banking / insurance stock is not cheap at current prices but a healthy 5% fully franked yield clearly is attractive to ourselves and many investors – its next dividend is due in August.
· We maintain our $15.50-$16 target but may consider trimming our large holding into any further EOFY strength.
Suncorp (SUN) Chart
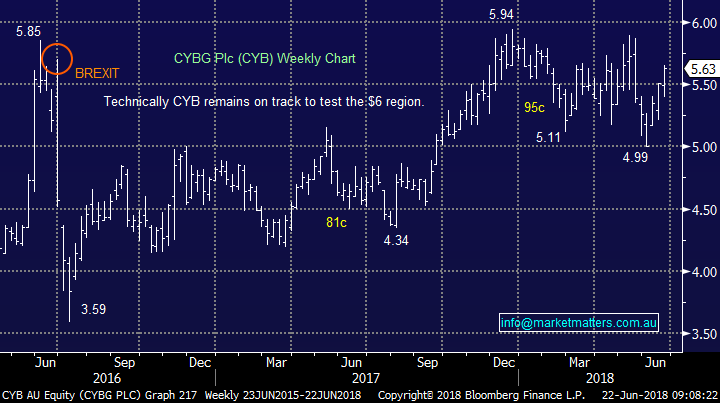
2 Clydesdale Bank (CYB) $5.63
CYB has been a very rocky journey for MM since we went long in November with the stock oscillating in large ~16% range.
We like it’s recent merger with Virgin Money which creates a financial group looking after about 6 million business and personal customers. This is another stock with a relatively low correlation to the ASX200 which as subscribers know we like at this stage in the stock market cycle.
· We remain bullish CYB and still believe our $6 target area can / will be achieved i.e. ~7% higher.
Clydesdale Bank (CYB) Chart
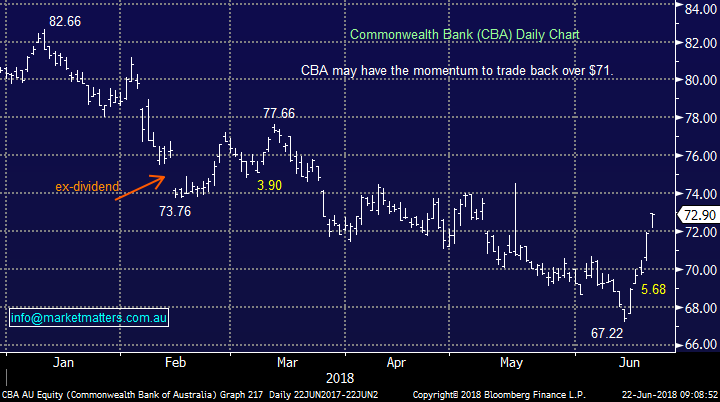
3 The “big 4 banks”
We hold 27% of the Growth Portfolio in the “big 4” Australian banks compared to their actual index weighting of around 21% i.e. we are mildly overweight having topped up a little too early.
We like the banks into fresh 2018 lows e.g. CBA below $65. Hence while we may consider trimming our holdings into further EOFY strength we are buyers, not sellers, of weakness. As we have discussed a number of times recently we believe the banks dividends are sustainable hence CBA yielding 5.9% fully franked looks attractive if the market fails to rally, or falls, from current levels.
· MM believes the banks will outperform in 2018 /9, especially from lower levels hence we like the concept of long banks v short an index ETF- watch this space.
Commonwealth Bank (CBA) Chart
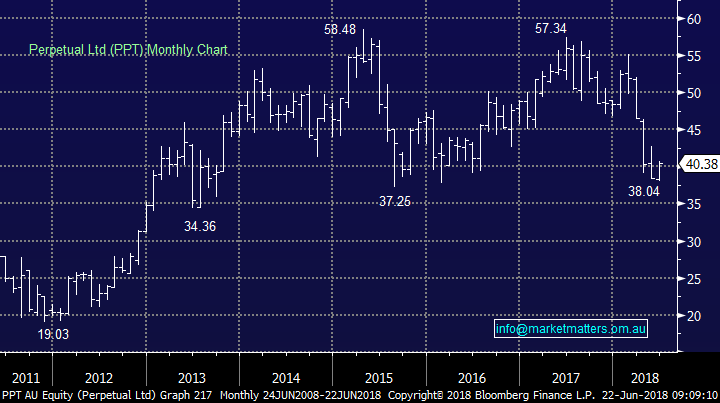
4 Perpetual (PPT) $40.38
Just in case readers think MM are only considering selling our winners we now turning our attention the worst performing stock in the MM Income Portfolio, Perpetual (PPT) which is showing us a ~9% paper loss since our purchase back in November.
The stock has suffered due to the departure of its former CEO and falling funds under management (FUM) while the concept of vertical integration (advice & asset management) is on the nose, the stock is cheap when compared to say Magellan (MFG) whose trading on a valuation of 17.6x - surely a push into international offerings is on the agenda for the new CEO for PPT which could rerate the stock very quickly to the upside.
PPT is currently trading on a valuation of 13.4x Est 2018 earnings while yielding 6.7% fully franked – obviously attractive if it’s not cut.
Short-term we are actually bullish PPT targeting a 7-10% bounce back towards $43-$45.
· We will consider cutting our PPT position into anticipated strength for a relatively small loss.
Perpetual (PPT) Chart
Conclusion (s)
No major changes / surprises as the ASX200 has tested our 6250-target area.
MM plans to continue to slowly de-risk our portfolios and increase cash levels and / or take on negative positions via ETF’s.
We will follow the outlines above on the 4 stocks / sectors until further notice.
Global markets
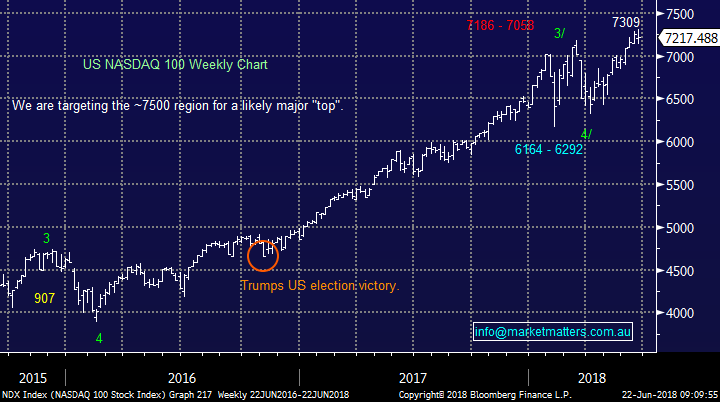
The tech-based NASDAQ failed to hold onto early gains last night as it losses momentum as it approaches our 7500-target area – less than 3% away last night.
There are no sell signals yet but the markets feeling tired and our often accurate “gut feel” is telling us to be careful.
NB We only need a 2.5-3% decline to turn bearish technically.
US NASDAQ Chart
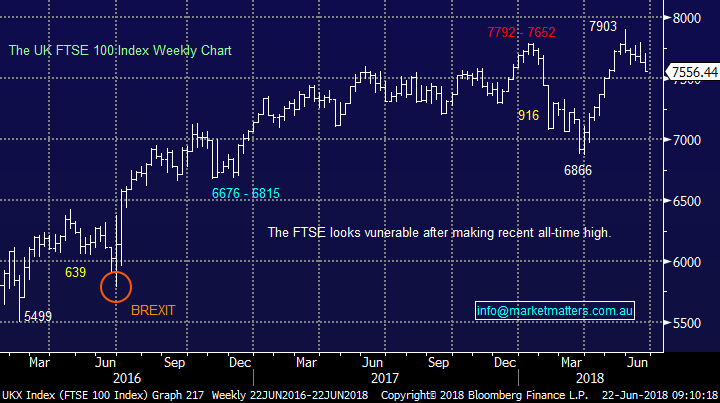
European stocks are looking very shaky and the UK FTSE is triggering technical sell signals with only 1%, a good one for the traders out there.
UK FTSE Chart
Overnight Market Matters Wrap
· Trade tensions between China and the US continued to plague the global markets overnight, with the Dow off 0.8% and the broader S&P 500 down 0.63%.
· Over in the European front, the Bank of England held its rates, but the probability of a rate rise in August grew, helping the GBP to rally.
· BHP in the US is expected to underperform the broader market, after ending its US session down an equivalent of -0.92% from Australia’s previous close.
· The September SPI Futures is indicating the ASX 200 to open 21 points lower towards the 6210 level this morning.
Have a great day!
James & the Market Matters Team
Disclosure
Market Matters may hold stocks mentioned in this report. Subscribers can view a full list of holdings on the website by clicking here. Positions are updated each Friday, or after the session when positions are traded.
Disclaimer
All figures contained from sources believed to be accurate. Market Matters does not make any representation of warranty as to the accuracy of the figures and disclaims any liability resulting from any inaccuracy. Prices as at 22/06/2018.
Reports and other documents published on this website and email (‘Reports’) are authored by Market Matters and the reports represent the views of Market Matters. The MarketMatters Report is based on technical analysis of companies, commodities and the market in general. Technical analysis focuses on interpreting charts and other data to determine what the market sentiment about a particular financial product is, or will be. Unlike fundamental analysis, it does not involve a detailed review of the company’s financial position.
The Reports contain general, as opposed to personal, advice. That means they are prepared for multiple distributions without consideration of your investment objectives, financial situation and needs (‘Personal Circumstances’). Accordingly, any advice given is not a recommendation that a particular course of action is suitable for you and the advice is therefore not to be acted on as investment advice. You must assess whether or not any advice is appropriate for your Personal Circumstances before making any investment decisions. You can either make this assessment yourself, or if you require a personal recommendation, you can seek the assistance of a financial advisor. Market Matters or its author(s) accepts no responsibility for any losses or damages resulting from decisions made from or because of information within this publication. Investing and trading in financial products are always risky, so you should do your own research before buying or selling a financial product.
The Reports are published by Market Matters in good faith based on the facts known to it at the time of their preparation and do not purport to contain all relevant information with respect to the financial products to which they relate. Although the Reports are based on information obtained from sources believed to be reliable, Market Matters does not make any representation or warranty that they are accurate, complete or up to date and Market Matters accepts no obligation to correct or update the information or opinions in the Reports.
If you rely on a Report, you do so at your own risk. Any projections are estimates only and may not be realised in the future. Except to the extent that liability under any law cannot be excluded, Market Matters disclaims liability for all loss or damage arising as a result of any opinion, advice, recommendation, representation or information expressly or impliedly published in or in relation to this report notwithstanding any error or omission including negligence.
To unsubscribe. Click Here