Subscribers questions (BHP, OZL, IIND, MSB, MGG, NCM, ASL, AWC, WSA, HLS)
The local market ticked a few points higher last week courtesy of the banks and heavyweight resources but under the hood we saw significant volatility as investors flocked away from the high value & interest rate sensitive stocks which have boomed throughout 2019 e.g. a2 Milk (A2M) -9.2%, ResMed (RMD) -5.2%, Charter Hall Group (CHC) -8.5%, Appen Ltd (APX) -16.4% and Wisetech Global (WTC) -8.74%. Bond yields are often the tail that wags the stock market dog and it certainly was last week as a relatively small bounce in bond yields appeared to have fund managers rejigging their portfolios on mass. At MM we are not convinced we have seen the low in bond yields but this another warning to the momentum traders and investors who buy without thought to value that when trends change its often a sharp aggressive move e.g. remember just 9-10 months ago.
Over the weekend we saw a few pieces of news that should on balance be market supportive:
1 – Drone attacks on Saudi Arabia’s Aramco is likely to cut a whopping 5-6% of global supply – we expect to see oil & its respective stocks rally strongly, oil has gapped substantially higher this morning, up over 10%. MM may take this opportunity to take profits on our BHP position if it appears to “blow-off” but there’s no hurry.
2 – Housing auction clearance rates remain strong but the real test comes as Spring inventory picks up – the sentiment has definitely improved, another rate cut and we might have prices back around their peaks which should be excellent for Australian consumer sentiment.
3 – Major unrest continues on the streets of Hong Kong but it feels almost expected as China attempts to successfully integrate the previous UK colony into both its political and social system..
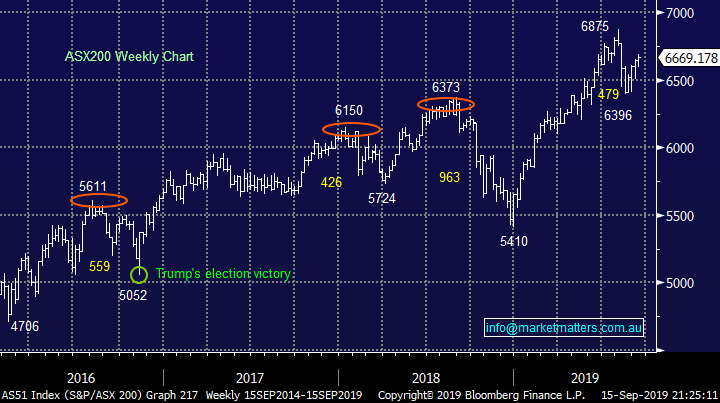
No change, with the ASX200 trading above the 6600 area, MM is comfortable being more defensive, at least for a few weeks / months.
This morning SPI futures are pointing to a slightly lower opening although BHP closed up 60c in the US implying more strength is likely from the resources to kick off the week with oils destined to lead the way following this mornings 10% rally.
Thanks as always for the questions, some real pearlers in there today, please keep them coming we feel it’s a great way to start the week.
ASX200 Index Chart
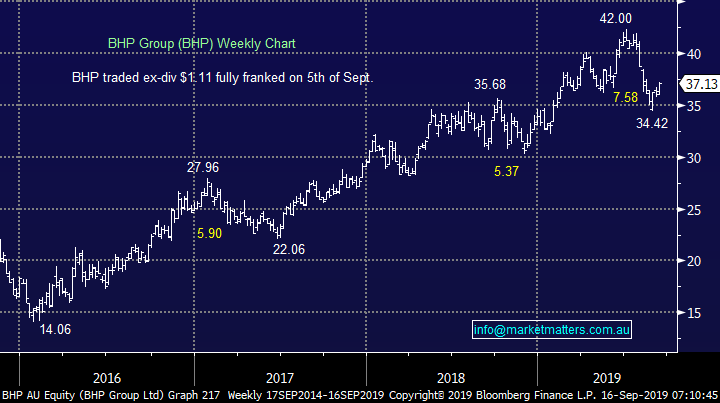
BHP looks set to challenge the $38 area early this week, still almost 10% under its 2019 high, ignoring dividends. The looming oil production restraints following the drone attack on Aramco is likely to be very supportive of the sector which should see BHP outperform in the weeks ahead. However as we have seen with the likes of Alumina (AWC) and Western Areas (WSA) when stocks rally strongly on supply constraints it can ultimately provide an excellent profit taking opportunity.
MM is considering taking profit into strength for BHP.
BHP Group (BHP) Chart
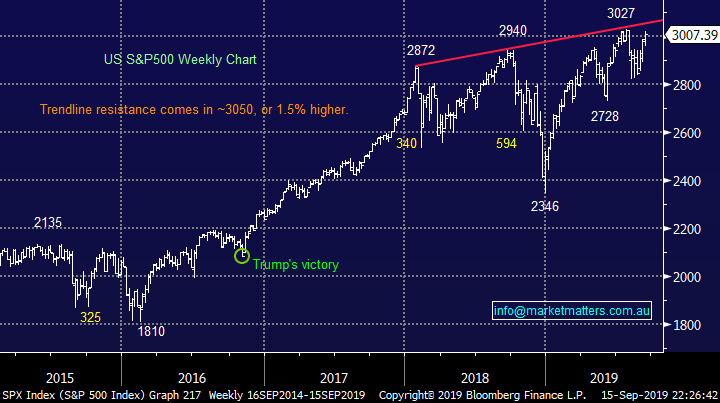
Similar to our own market US stocks have recovered solidly over recent weeks with President Trumps more conciliatory tone towards China providing a definite helping hand, we have now tweaked our technical picture:
1 – The post Trump bull market remains clearly intact albeit with slowing upside momentum, the next resistance comes in for the S&P500 around 1.5% higher.
2 – A pullback of ~2.5% by the S&P500 will trigger technical sell signals targeting the 2750 support area – our preferred scenario.
US S&P500 Index Chart
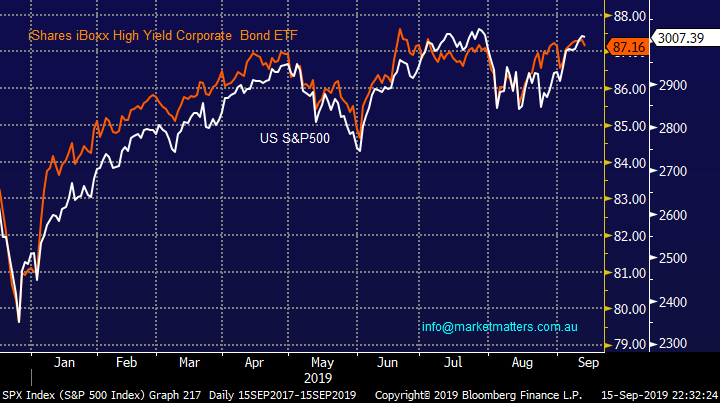
Bonds have ticked lower (yields higher) as can be seen on the chart below which includes the iShares “Junk Bond” ETF and S&P500. So far there has been no major decoupling between the ETF and stocks but if we see continued weakness by the ETF, which is ignored by stocks, MM will regard its as a negative indicator for equities in general, and especially for those which experienced aggressive selling last week.
MM is neutral “junk Bonds” at current levels but they are starting to feel “heavy”.
NB Junk bonds are the name given to non investment grade bonds of varying quality – those that yield more but carry more risk.
US S&P500 v “Junk Bond” ETF Chart
Question 1
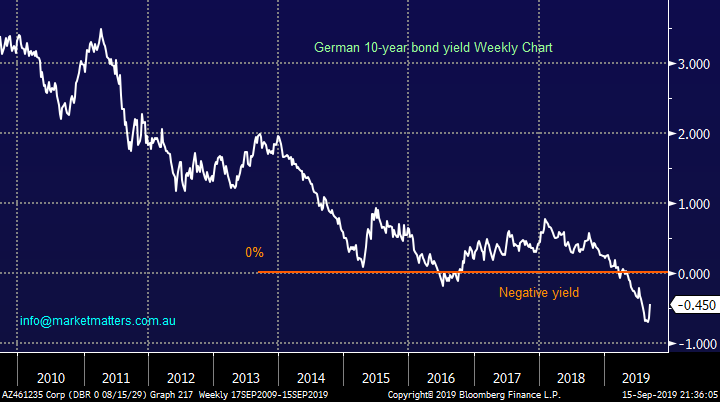
“Hi Guys, great report, I read it religiously every day. I just wondered when another subscriber asked why do fundies buys negative yielding bonds? Why not just hold cash? Do they expect bond yields to fall further and then gain and then sell before the stampede out of bonds? Besides inflation returning, what would cause bonds yields to start rising? A chance of viewpoint by market participants? Leading to rerating of bonds? Seems unlikely.” - Thanks Peter B.
Morning Peter,
You have part answered your question but like yourself its extremely hard for me to understand somebody buying an asset that is guaranteed to lose money at its maturity. However investment funds simply have to follow their mandates, let’s say 40-50% equities, 30-40% bonds and 5-10% cash mandates are clearly defined so investors know how their hard earned dollars will be deployed thus allowing them to pick the product which best fits their needs, often around the perceived degree of risk.
A fund manager uses his knowledge and expertise to decide how to balance the mix both within say the 3 asset classes used in the example above and then within those assets themselves e.g. do they buy German bunds or US bonds, where’s their respective currencies going etc….the mosaic gets more complicated the deeper you delve.
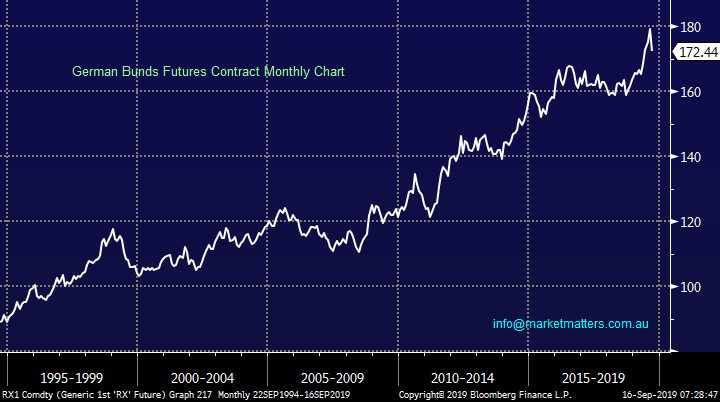
However in nutshell bonds do offer a degree of safety and they have enjoyed an amazing bull market for decades, investors who thought that German Bunds would not go below say 1% have missed out on some excellent returns……who’s to say they’re not destined for -2%, the investment landscape has clearly been turned on its head post the GFC.
We had the CEO of EFG in a few weeks ago and they are ‘reluctantly’ about to start charging clients to deposit cash with them – never forget that investing is a relative game.
German 10-year Bunds Chart
German 10-year Bond Yield Chart
Question 2
“Hi, just checking again your thoughts on long on copper” – Tim W.
Hi Tim,
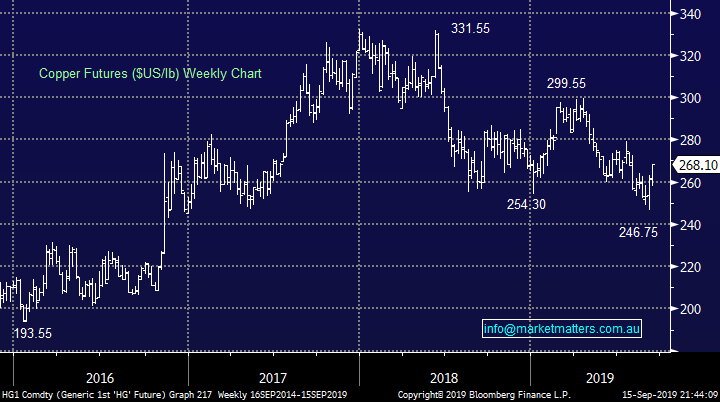
No major change, we continue to feel there’s a strong possibility of another leg lower in stocks which is likely to mean a short-term pullback for copper stocks, assuming we are correct of course. However technically copper looks good short-term as US-China trade talks loom in October making it tricky at present, thus leaving us happily sitting on our hands.
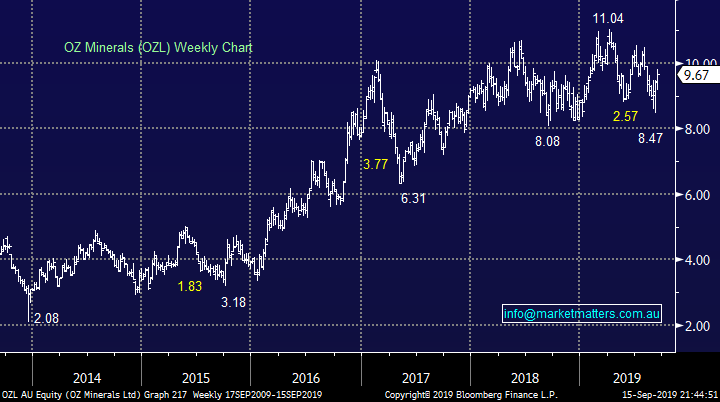
If / when we see the ASX200 correct back towards 6200, or when we decide this scenario has become unlikely and the market again looks net bullish copper stocks will be on our buy radar. Assuming no unusual news on the corporate front in the weeks ahead we particularly like OZ Minerals (OZL) for copper exposure, an excellent business which we believe the market is undervaluing medium-term.
MM’s favourite vehicle to buy for copper exposure is OZ Minerals (OZL).
Copper ($US/lb) Chart
OZ Minerals (OZL) Chart
Question 3
“Dear James, could you please advise on taking exposure in ETFs IIND and NDIA?” - Best regards, Sachin S
Morning Sachin,
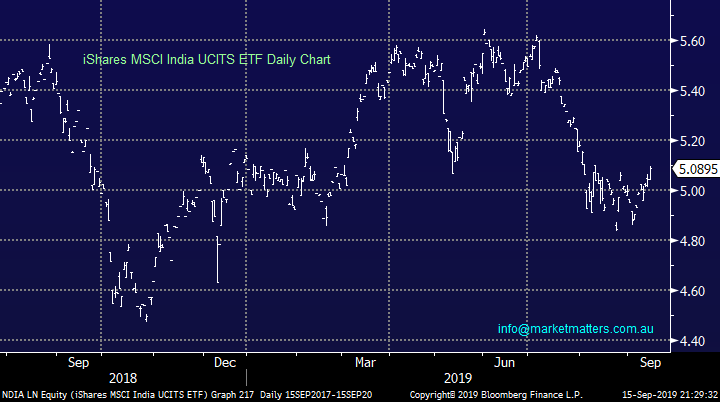
Two relatively new ETF’s to allow investors to gain exposure to the exciting Indian market, and economy.
1 – iShares MSCI India UCITS ETF (NDIA LN) is incorporated in Ireland, the fund tracks the MSCI India Index net $US. The market cap is $US240m but will require investors to have access to an overseas trading platform / broker to invest / trade.
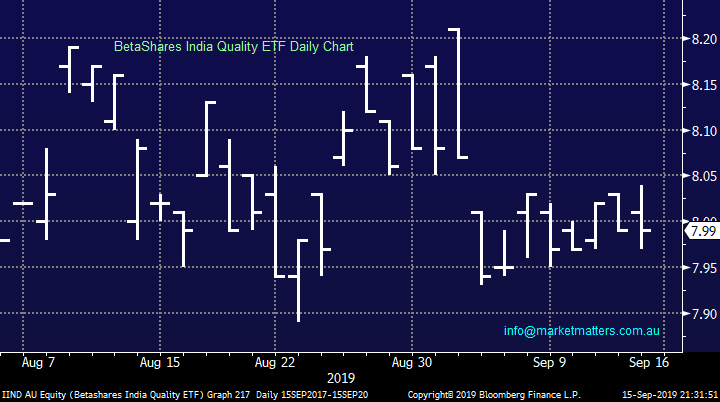
2 - BetaShares India Quality ETF (IIND AU), a relatively small ETF with a market cap below $8m however it should be relatively easy for local investors to use - the fund is priced / traded in $A.
I have not watched the 2 products closely so unfortunately I cannot comment on their spreads, or average net cost to buy / sell.
On face value both look to be good vehicles to gain exposure to India with investors needing to decide where they want exposure i.e. locally in $A, or overseas in $US.
iShares MSCI India UCITS ETF Chart
BetaShares India Quality ETF Chart
Question 4
“Hi team, can I ask a question on Mesoblast (MSB). I have been a long suffering shareholder, recent good news has rallied the stock, would appreciate your thoughts re: exiting stock here or holding for further gains.” – Regards Jeff S.
Hi Jeff,
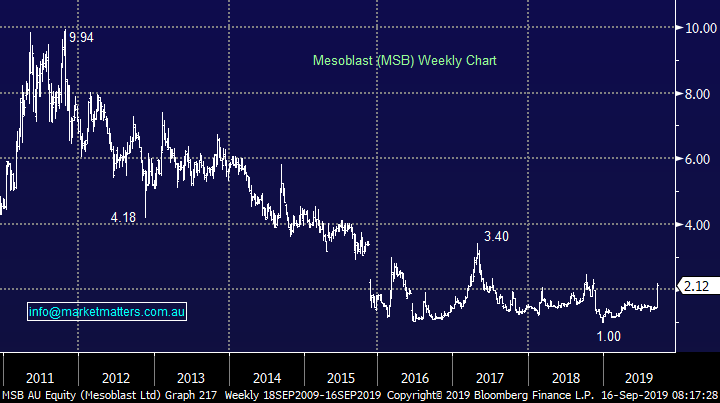
Biomedical business MSB has endured an awful 8-years although last week was clearly a nice counter-trend bounce. The trading update this month was clearly bullish as they announced a strategic partnership with Grunenthal which includes a $US150m upfront payment to MSB in what reads like an extremely good deal for MSB.
Technically I could be long with stops below $1.60, targeting over $3, not bad risk / reward, especially following an excellent announcement.
MM is neutral / bullish MSB at present.
Mesoblast (MSB) Chart
Question 5
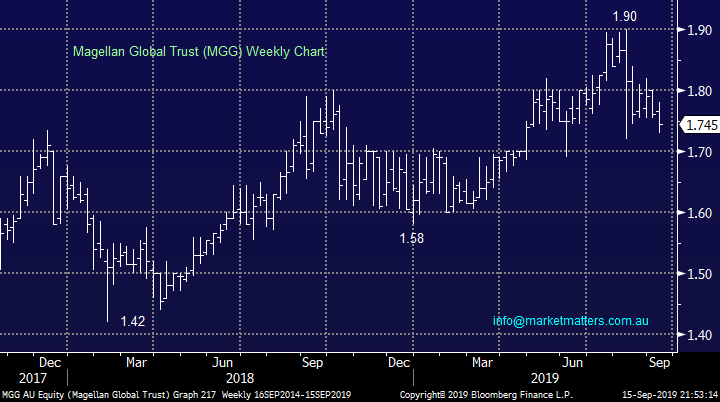
“Subject: Magellan High Conviction Fund: Hi Guys, been away for four weeks and remembered you commented on the above new issue but can't find your comment. I am a holder of MGG and have been offered stock in the new issue. Can you repeat your original comment please.” - Regards Keith
Hi Don,
We indeed answered this question in our Monday morning report on the 26th of August:
“Magellan Financial Group (MFG) have launched is High Conviction Trust which will invest in a concentrated portfolio of high quality companies, weighted towards the companies best ideas – their words not mine. However the track record of MFG over the years is clearly one to be admired as Hamish Douglass steers a top quality ship.
We had the Magellan team in last week running through the deal. While we can make general rather than personal comments only, the 7.5% loyalty bonus for current holders of any Magellan listed fund or the headstock (MFG) is a good deal. For those that do not currently own stock in MFG or any of their listed funds there is a priority offer available through brokers, including Shaw and Partners that will entitle those participating to a 2.5% loyalty bonus of shares. Through Shaw & Partners we can assist in applying through the priority offer. If interested, please email me on [email protected]
In terms of the loyalty offer, to receive either 7.5% or 2.5% worth of additional units in the trust, unit holders need to be on the register on the 31st December 2019. This means that unit holder can actually sell after listing at any stage, however they need to be back on the register by the 31st December to receive the bonus. While the bonus issue of units is clearly a positive and it provides a buffer from a performance perspective, I wouldn’t be surprised if there were some unintended consequences of it. For example, subscribe for units through the loyalty offer, sell after allotment - before buying back in December to be on the register by the 31st to receive bonus shares. This could potentially put some pressure on the unit price of the trust on open.“
Magellan Global Trust (MGG) Chart
Question 6
“Hi Harry / James , Evolution (EVN) has shed over 4% on MM ‘s recommended buy price earlier this week. Any update / comment on this move down.” - Regards Errol K.
Hi Errol,
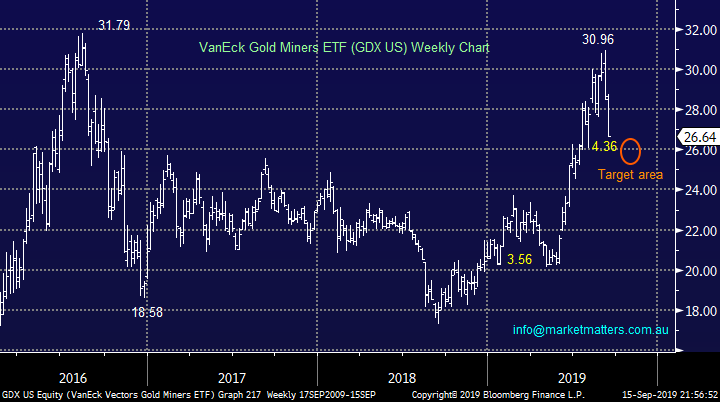
Our plan has always been to accumulate gold stocks into weakness after selling out of the sector into strength over a moth ago. Accumulation is just that, buying on the back foot as picking the actual bottom is luck, not a science. Remember one of my favourite quotes of a legendary investor from a bygone era:
“I will tell you my secret if you wish. It is this: I never buy at the bottom and I always sell too soon.” – Baron Rothschild.
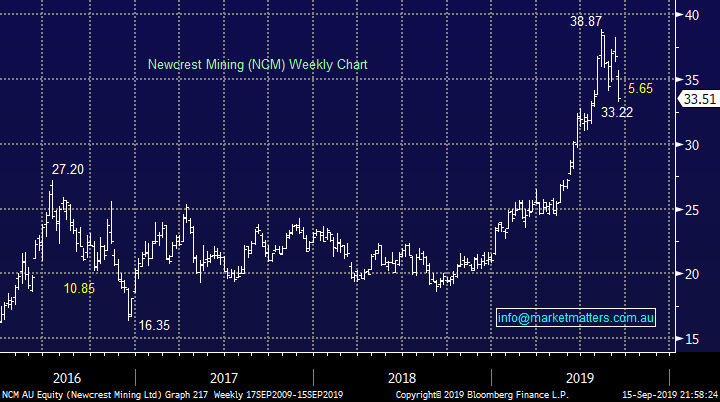
We are looking at adding to our gold exposure this morning even though gold has popped +0.7% on the open today.
MM is going to buy Newcrest (NCM) around todays levels.
VanEck Gold Miners ETF Chart
Newcrest Mining (NCM) Chart
Question 7
“Hi just joined the service on 6 weeks trail basis, re the current call column on the portfolio ‘s where it’s a buy does that mean at the current price they are still considered a buy irrespective if it’s gone up or down since it was first recommended. /?" Kind Regards Rob V.
Hi Rob,
A great question and one part of the service we are considering carefully as we look to improve the MM offering in 2020. Yes, your interpretation is correct, the buy or hold calls relate to the current price of the stock.
Question 8
“Hi MM I have held on to ASL, AWC, WSA and HLS. They have all had a run up in price this week. What is your current view on these stocks i.e. exit price. Should I be selling these into strength now or hold for further upside?" regards Debbie G.
Hi Debbie,
I have provided a brief current opinion on the 4 stocks below:
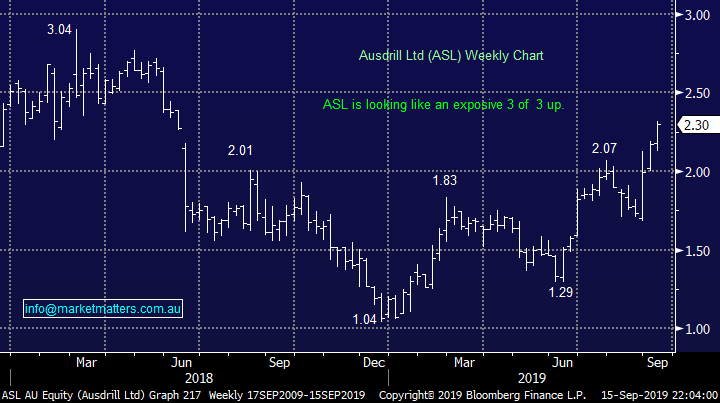
1 Ausdrill (ASL) $2.30 – we said it looked great in the Weekend Chart Pack and how right that will look this morning with oil up over +10%. Its common that stocks lead events due to that human characteristic of “Fear & Greed”. We are bullish.: https://www.marketmatters.com.au/chart-pack/
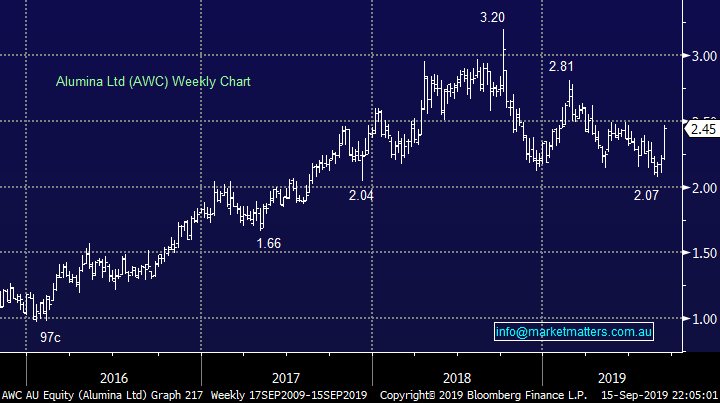
2 Alumina (AWC) $2.45 – now finally looks bullish with another +10-15% feeling likely.
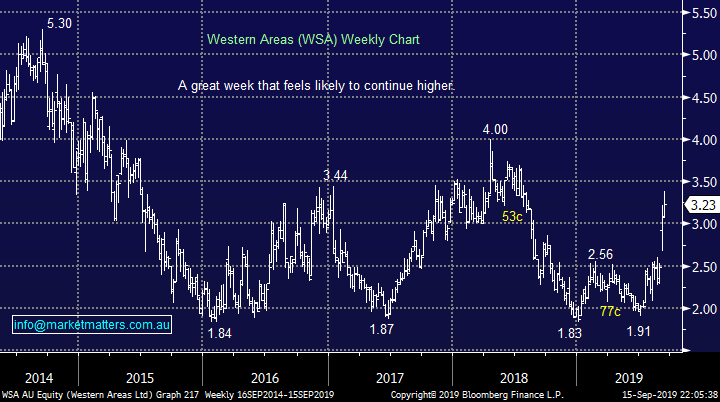
3 Western Areas $3.23 – remains bullish and we will consider buying the nickel producer on any pullback towards $3.
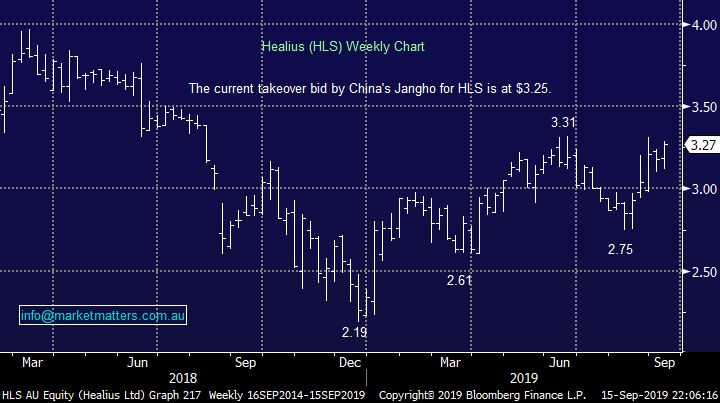
4 Healius (HLS) $3.27 – we are not keen on the business but the takeover prospect remains leaving us neutral HLS.
Ausdrill Ltd (ASL) Chart
Alumina (Ltd (AWC) Chart
Western Areas (WSA) Chart
Healius (HLS) Chart
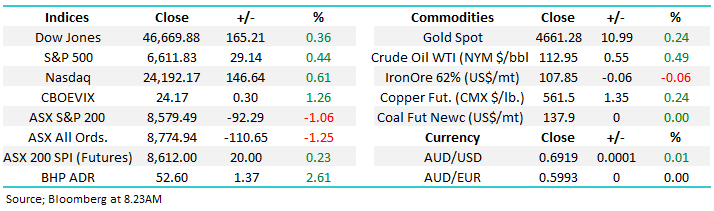
Overnight Market Matters Wrap
· Oil prices are set to rise sharply when trading resumes today, following the weekend drone attack on Saudi Arabian oil and gas production facilities which has taken out over 5m b/d of production, approximately half the Kingdom’s and 5% of global supply.
· On Friday night markets were otherwise calm before the weekend drone strikes, with the US market closing little changed and the European markets slightly firmer in the wake of the ECB stimulus moves announced late last week.
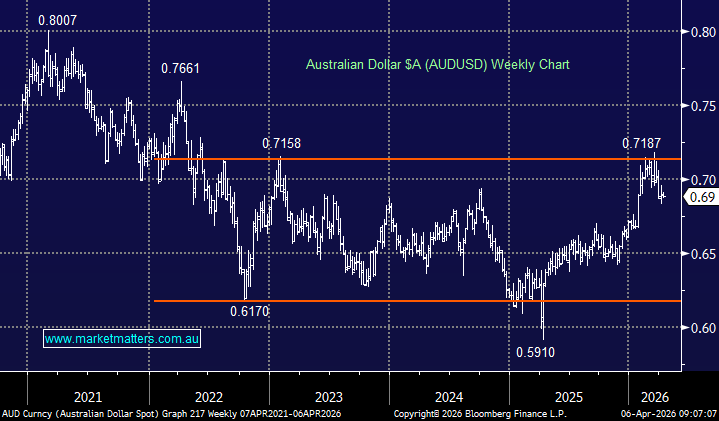
· US ten year bond yields jumped another 12bp to 1.9%, while commodities were mixed, with gold slightly weaker, copper 0.5% firmer and the oil price a little weaker before the news of the attack. The A$ is trading around US68.7c.
· The September SPI Futures is indicating the ASX 200 to open with little change.
Have a great day!
James & the Market Matters Team
Disclosure
Market Matters may hold stocks mentioned in this report. Subscribers can view a full list of holdings on the website by clicking here. Positions are updated each Friday, or after the session when positions are traded.
Disclaimer
All figures contained from sources believed to be accurate. All prices stated are based on the last close price at the time of writing unless otherwise noted. Market Matters does not make any representation of warranty as to the accuracy of the figures or prices and disclaims any liability resulting from any inaccuracy.
Reports and other documents published on this website and email (‘Reports’) are authored by Market Matters and the reports represent the views of Market Matters. The Market Matters Report is based on technical analysis of companies, commodities and the market in general. Technical analysis focuses on interpreting charts and other data to determine what the market sentiment about a particular financial product is, or will be. Unlike fundamental analysis, it does not involve a detailed review of the company’s financial position.
The Reports contain general, as opposed to personal, advice. That means they are prepared for multiple distributions without consideration of your investment objectives, financial situation and needs (‘Personal Circumstances’). Accordingly, any advice given is not a recommendation that a particular course of action is suitable for you and the advice is therefore not to be acted on as investment advice. You must assess whether or not any advice is appropriate for your Personal Circumstances before making any investment decisions. You can either make this assessment yourself, or if you require a personal recommendation, you can seek the assistance of a financial advisor. Market Matters or its author(s) accepts no responsibility for any losses or damages resulting from decisions made from or because of information within this publication. Investing and trading in financial products are always risky, so you should do your own research before buying or selling a financial product.
The Reports are published by Market Matters in good faith based on the facts known to it at the time of their preparation and do not purport to contain all relevant information with respect to the financial products to which they relate. Although the Reports are based on information obtained from sources believed to be reliable, Market Matters does not make any representation or warranty that they are accurate, complete or up to date and Market Matters accepts no obligation to correct or update the information or opinions in the Reports. Market Matters may publish content sourced from external content providers.
If you rely on a Report, you do so at your own risk. Past performance is not an indication of future performance. Any projections are estimates only and may not be realised in the future. Except to the extent that liability under any law cannot be excluded, Market Matters disclaims liability for all loss or damage arising as a result of any opinion, advice, recommendation, representation or information expressly or impliedly published in or in relation to this report notwithstanding any error or omission including negligence.