Subscribers questions (AWC, WSA, WPL, BPT, TLS, NUF, COL, WES, US:BABA, HK:700, TME, MIN, EHLDA, NWL, CBA)
On Friday afternoon the ASX200 was looking strong bound for an exciting Christmas rally but already this morning it’s going to receive a major test of the market’s backbone, all the news after we went home on Friday is supportive of the bears, not the bulls:
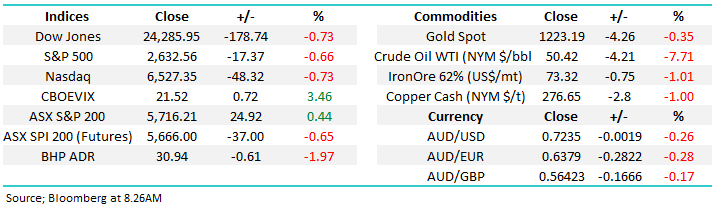
1 – US stocks fell ~0.75% during Fridays shortened session as the Thanksgiving hangover remained, leading to the S&P500 experiencing its worst Thanksgiving week since 1939.
2 – The SPI futures closed down 37-points and BHP finished almost 2% weaker in the US, following crude oil’s 7.7% plunge.
3 – Labor won a landslide victory in Victoria reminding investors of the looming threat to franking credits in 2019, the result was no surprise but the degree of the Liberal-Coalition pummelling was at the extreme end of expectations.
The UK does appear to be making some progress with BREXIT but the above points are likely to have far more of an impact on local stocks than Theresa May’s potential success.
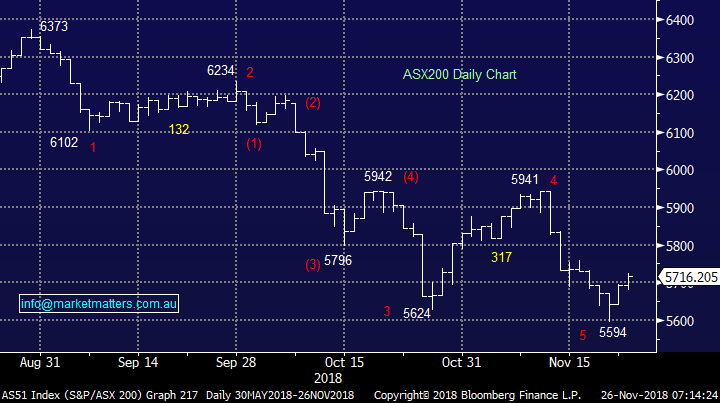
This time we don’t anticipate the market to open near its lows and power ahead, to close up on the day, as it did on both Thursday and Friday, but a day or 2 of consolidation between 5650 and 5700 will suit our bullish picture just fine.
We are bullish the ASX200 short-term initially targeting the 5950-6000 area.
Thanks as always for some more great questions and appreciation of our reports and efforts. If we are correct the next 6-months will be exciting but scary time for the unprepared hence if in doubt ask the question.
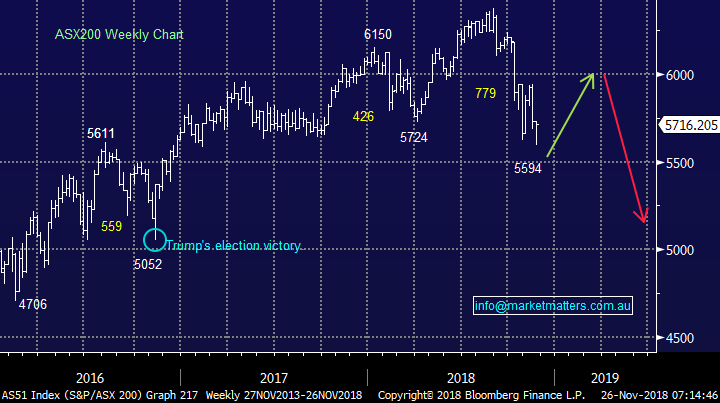
ASX200 Chart
As we said last week our preferred scenario moving into 2019 warrants plenty of caution but for the nimble opportunities will abound, just remember to be open-minded and flexible, just consider the below bullish & bearish moves in the decade following the GFC, I don’t believe many subscribers would have thought these swings possible at the time:
Bullish – CSL Ltd (ASX: CSL) would rally over 750%, Aristocrat (ASX: ALL) 1600% and REA Group (ASX: REA) 3100%.
Bearish – CBA would correct 32%, BHP 70% and Telstra (ASX: TLS) over 60%.
ASX200 Index Chart
Question 1
“Hi James, maybe a question you can use for MM. I know Shaw’s like AWC and WSA but price keeps heading south. AWC has an attractive yield but is being treated like a dividend trap. Are we getting near a buying opportunity?” – Regards Lindsay C.
“Hi, recently in one of your emails AWC at $2.50 was considered a good buy. I got some at $2.38. They are now $2.22. Are they an even better buy now?” - Keith M.
Hi Guys,
As you know we have remained underweight resources sector since we sold our BHP holding ~$34 about 6-months ago but in hindsight zero exposure would be better so we could start picking the eyes out of the bargains on offer today. Global markets have positioned themselves for a US recession over the last few months which has recently put the resources sector under significant pressure. With regard to the 2 stocks mentioned above:
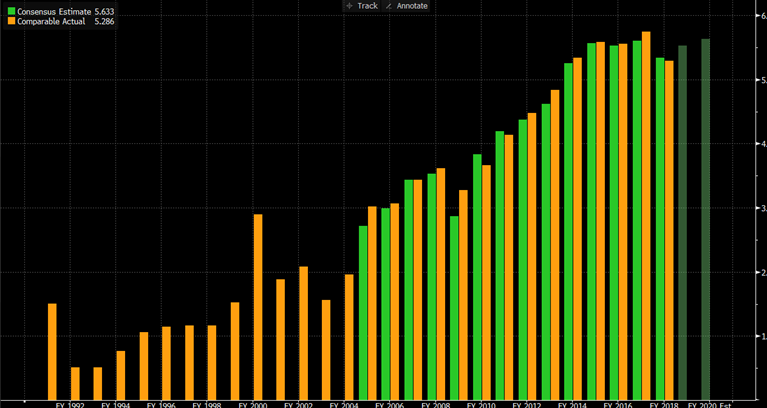
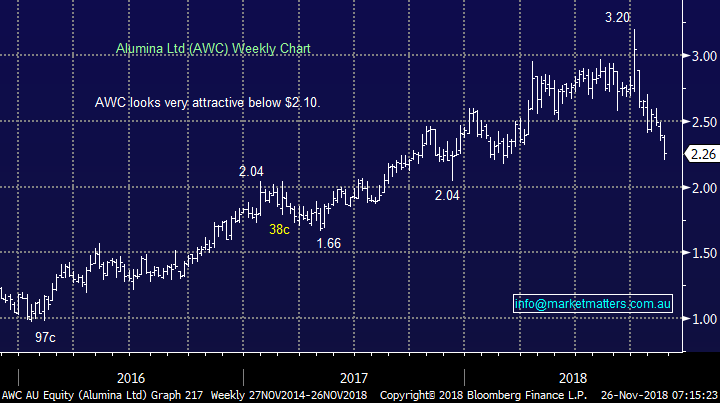
Alumina (ASX: AWC) $2.26 – MM went long AWC last month at $2.53 for our Income Portfolio, this certainly now looks a touch premature with the stock below $2.30. We remain comfortable with this holding as the stock has simply followed the aluminium price lower, nothing more sinister. The current yield of over 10% fully franked is likely to fall in line with the metal price but we still feel it has a position for our Income Portfolio. If we had no position we would be looking to accumulate between $2.10 and $2.20. To your point Lindsay about dividend traps, its very important to understand that the earnings in resource stocks are significantly more volatile than earnings in say banks and as dividends are a pass through of earnings, by definition there will be more dividend traps in the resource sector.
Looking at earnings expectations (green) and actual earnings (yellow) below for Alumina shows the volatility of earnings and at times the difficulty in forecasting them.
Alumina (AWC) consensus earnings expectations (Green) v actual earnings (yellow) over 30 years
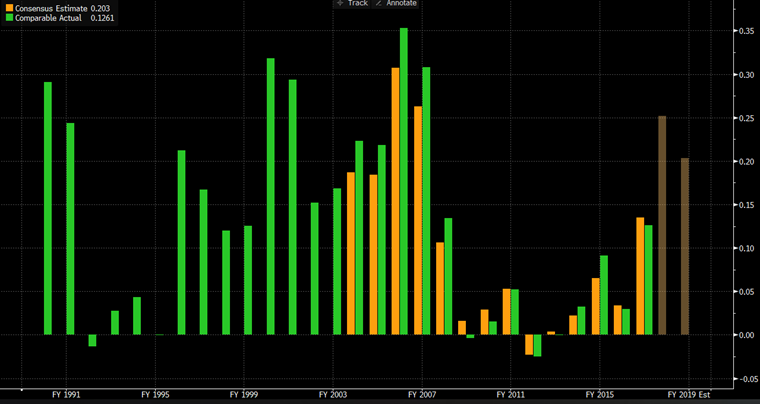
Compared to a company like CBA where earnings are fairly stable meaning dividends are as well – again, over 30 years – shows why people like the banks for income.
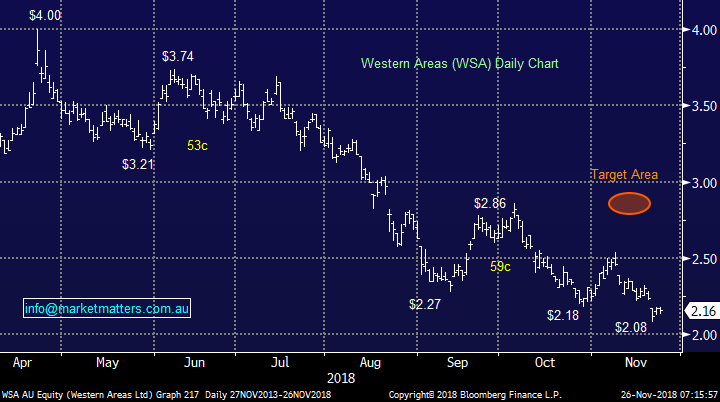
Western Areas (ASX: WSA) $2.16 – MM went long WSA last month at $2.22 for our Growth Portfolio, after “stalking” the position for a number of weeks. We remain comfortable with this holding even though we are down a few cents. The stock has simply followed the nickel price lower, nothing more sinister, hence we would still be buyers into weakness if we had no position.
NB As we mentioned in the Weekend Report we may increase our resources sector exposure into further weakness e.g. BHP Billiton (ASX: BHP) below $30.
Alumina (ASX: AWC) Chart
Western Areas (ASX: WSA) Chart
Question 2
“Hi, I currently hold WPL for a small profit. Do you think it has hit a significant low, and would you consider adding more? If not, where would you be placing your stop-loss?” - Thanks Peter T.
Hi Peter,
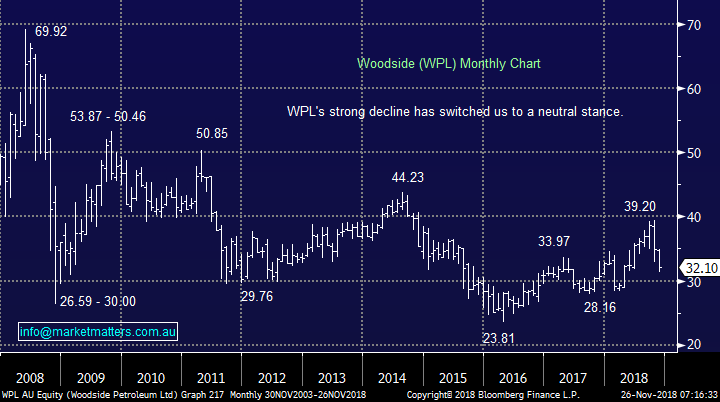
Firstly I believe that investors should never consider the price paid for a stock when considering whether to sell (or not) – look at it on its merits today. In general terms, the technical picture for WPL in the medium term is neutral although an eventual pullback towards $30 looks a strong possibility - following oils plunge on Friday night I can see WPL testing $31 this morning.
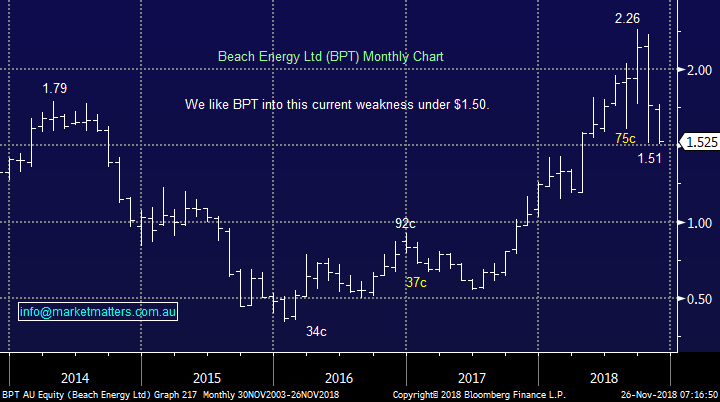
Our favourite stock for trading a bounce in the sector is Beach Petroleum (ASX: BPT) which looks compelling under $1.45 although we would leave some “ammunition” to average below $1.30 as the downtrend is clear.
Note MM are leaving this sector alone for now.
Woodside Petroleum (ASX: WPL) Chart
Beach Petroleum (ASX: BPT) Chart
Question 3
“I would like to ask a question to be answered in the daily report regarding Telstra (TASX: TLS) please! Soon in November I am not sure exactly when the new 5G AUCTION is apparently due to take place which Telstra is expected to be heavily involved in buying 5G future capacity which in the past it has been reported the 5G should favour and benefit Telstra as compared to their competitors once it is available! Is this still generally considered to be correct and when is the 5G Auction to take place?” – requested to be anonymous.
Hi There,
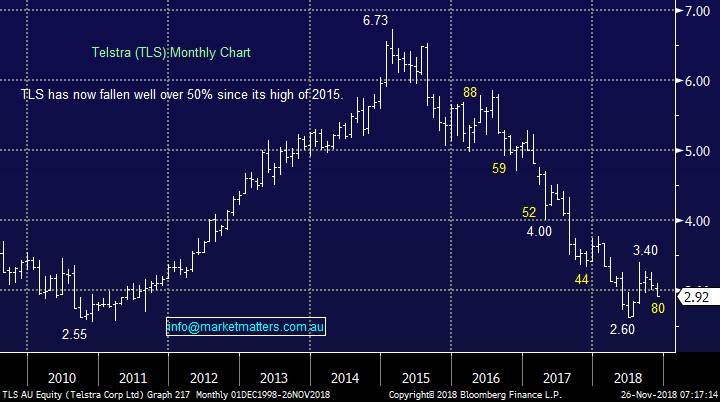
Next year is set to be the year of 5G with many smartphones manufacturers rumoured to be bringing out supporting devices in anticipation of the new capability. Telstra is planning to deploy its 5G network in three tranches with “full commercial deployment” expected by FY20. For the user tests are showing 5G will be 30x faster than the NBN and 60x faster than 4G – that’s progress which is likely to fuel demand. At a recent strategy day CEO Andy Penn said that the telco intended to “lead” 5G, as it had with prior generations of mobile technology - “We intend to lead and win in 5G”.
TLS is actually already leading the pack in the early stages with 5G available in the Gold Coast and Toowoomba.
The intention has been to start the auction process this month but there’s lots of water to go under the bridge with this moving forward.
MM is long TLS and likes it into current weakness.
Telstra (ASX: TLS) Chart
Question 4
“Good Afternoon MM, thank you for you reports and well explained commentary on the ever-changing market. I found Question 7 interesting to hear from a customer’s perspective regarding Nufarm. I'm a contractor that works on their manufacturing sites in Melbourne and I can say that production has slowed. I'm guessing that its due to the current environmental issues experienced from various parts of the globe. I have thought that this stock would bounce should the environmental issues subdue, but it sounds like they have more challenges ahead. Just a thought and comment on NUF.” - Thanks, and Regards.
Hi,
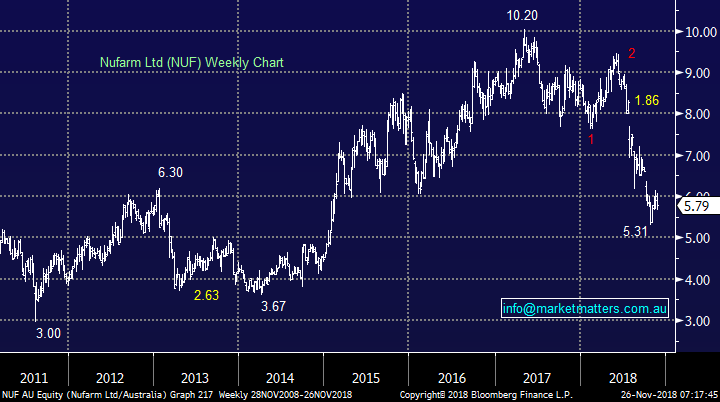
I really appreciate and encourage these informative comments from subscribers. Technically NUF is now actually looking pretty weak with a potential $4 target.
At this stage we have not changed our NUF view i.e. we are neutral until further notice.
Nufarm (ASX: NUF) Chart
Question 5
“Hi guys, what are your thoughts on the Coles group, would you consider buying or watch and wait? Thanks Sharon B.
Hi Sharon,
Last Wednesdays income report answered this very question, please excuse the “cut and paste”:
Wesfarmers & Coles Demerger – why we don’t like either one
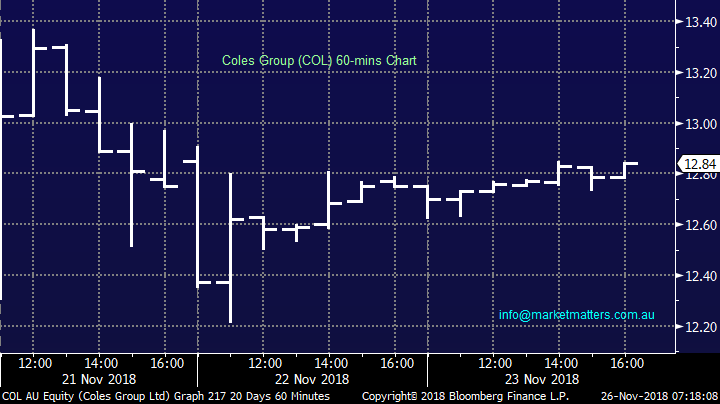
Today is the first day of trade for the separated Wesfarmers / Coles businesses however they still are linked to a degree with WES retaining 15% of Coles and they both hold 50% each of Flybuys. Wesfarmers (ASX: WES) is trading down $12.50 at $31.79 and Coles (ASX: COL) is trading at $13.05 which means shareholders are up on day 1 in a weak market.
WES shareholders (we’re not) will get 1 share in the new Coles entity for every WES share they hold – they then need to make a decision – to hold or sell those shares. WES will go from the diversified conglomerate that benefited from the stability of Coles earnings but suffered because they dragged on growth, to a more growth orientated vehicle looking for acquisitions. Coles on the other hand will now be a vehicle that generates earnings that are stable but with very little growth, particularly given the large capital expenditure program they are likely to roll out.
Both WES and Coles are good businesses with good assets, however they both have near term headwinds which make us negative on both;
Coles (ASX: COL); Earnings here will be 90% Coles while the remaining will be Flybuys, Hotels, Liquor and a few other bits and pieces . The issue for Coles is the requirement to build two new distribution centres to help with their logistics network. WOW has a better distribution network than Coles and as the onslaught of international players (AMZN, Kaufland, Costco, ALDI, Lidl) and intense domestic landscape (WOW, MTS IGA, 7-11s) all modernise their supply chain metrics to maintain/enhance competiveness, things will get tougher. Given this outlook for capex, it seems very likely that Coles will need to draw on debt to fund dividends over the next few years. We have no interest.
Wesfarmers (ASX: WES); Housing related stocks have been under significant pressure in recent times. Fletcher Building (ASX: FBU) the latest to downgrade earnings, Boral (ASX: BLD) is down ~33% over the past 12 months while property stocks exposed specifically to the residential sector have been hit hard – just look at Stockland (ASX: SGP) which has fallen by around 22%. Last week Morgan Stanley wrote a good note on WES (Bunnings) following the Dulux (ASX: DLX) result. We covered it at the time however in essence they suggested that after Wesfarmers recently ceased disclosing quarterly sales figures, looking at Dulux results gave a good read through for Bunnings, in so far as paint is a big driver of foot traffic and sales of other associated products tend to follow.
In short, DLX's core ANZ business delivered 3.9% revenue growth in the 2H (ended Sept) a slowdown from the 5.7% in the 1H. DLX indicated that market growth slowed from 4% during the 1H to 2.5% for the FY18 which implies just 1% growth in the 2H.
A call on WES is to a large degree a call on Bunnings. The market continues to look backwards in terms of their phenomenal track record of growth however we simply think that the trends playing out across housing and retail generally is too big of a red flag for WES.
We have no interest in WES or COL at this stage.
Coles Group (ASX: COL) Chart
Question 6
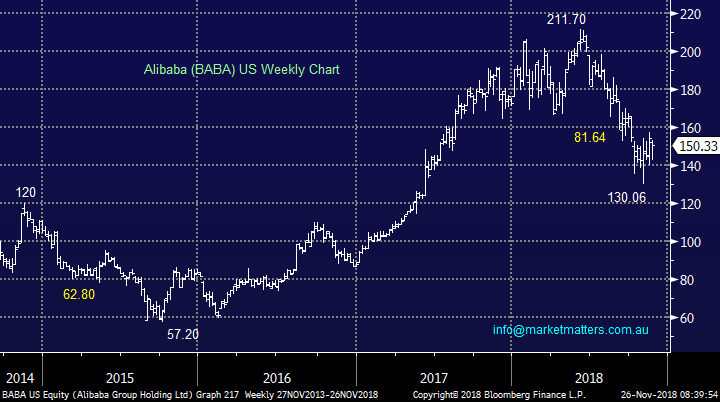
“Continue to love your work. The report today looks at the FANGs And mentions the Chinese tech stocks. I dipped in to a BABA, Tencent, JD and others a 6 weeks ago - clearly too early - Can you cover in weekend report or provide any additional comments to these specifically.” - Thanks Mark K.
Hi Mark,
Undoubtedly there has been a significant sell off in the high growth / valuation end of town but we believe short-term opportunities are now surfacing, although over the coming years the migration out of these stocks looks to have much further to go on a relative basis:
Alibaba (US: BABA) $150.33 – We like BABA both as a business and technically for a short-term bounce towards $165, or 10% higher. However in line with our overall market view / stance we are sellers of strength and only buyers of decent weakness.
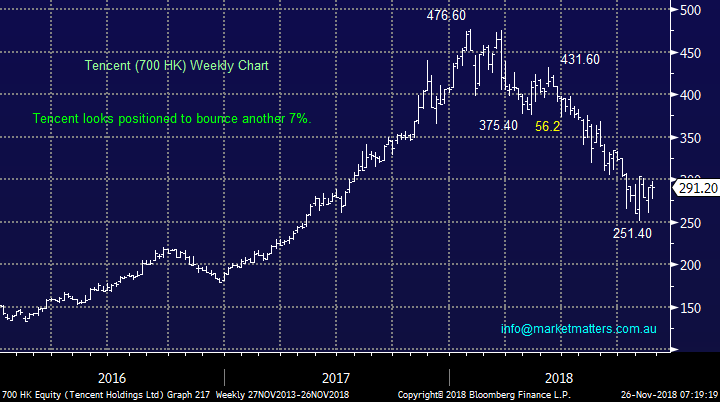
Tencent Alibaba (700 HK) HK291.20 – We like Tencent at current levels, especially after its recent excellent result, but our initial target is only 5-7% higher which is not compelling risk / reward. The stock may open down today in line with the US on Friday which would be more attractive for the trader / very active investor.
NB We often cover these stocks in our Chart Pack which can be found on our website and is usually updated at least twice a week. (click here)
Alibaba (US: BABA) Chart
Tencent Alibaba (700 HK) Chart
Question 7
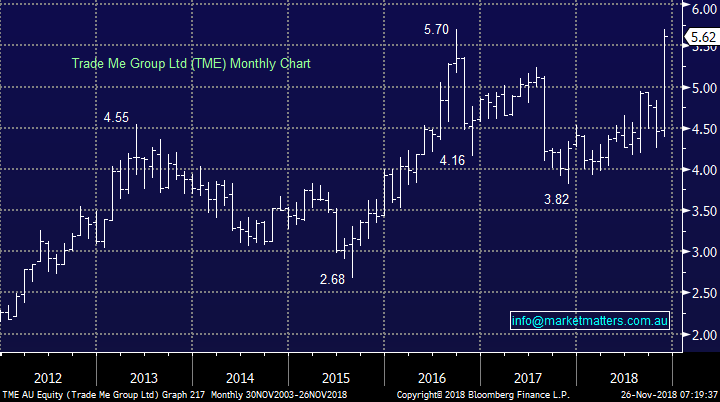
“Hi James, thanks for the note on TME’s offer from Apax. These notes are always greatly appreciated. Is TME a sell at this point, or should I wait in case there’s an alternative (and perhaps slightly higher) offer. I note TME is trading at a slight discount to the Apax offer price, which may indicate some shareholder doubt that this offer will be accepted. I also note Morningstar rates TME as ‘overvalued’ but my own assessment is that TME’s potential makes the Apax offer on the low side.” - Regards, Gil.
Hi Gil,
TME is trading on an Est P/E for 2019 of 22.8x following the takeover offer, which is about 20% expensive for this stock but not particularly expensive for a growth business under takeover.
Last week we took our $$ off the table with Healthscope (ASX: HSO) at a discount to the bid for a couple of reasons but simply put, not all takeovers come to fruition for varying reasons.
With the ASX200 likely to be trading sub 5700 today we would be looking at relative value in the market which is what we did with HSO – however you’re absolutely right, a stock trading above the bid implies that there is more to play out here.
MM is neutral TME at Fridays close.
Trade Me Group (ASX: TME) Chart
Question 8
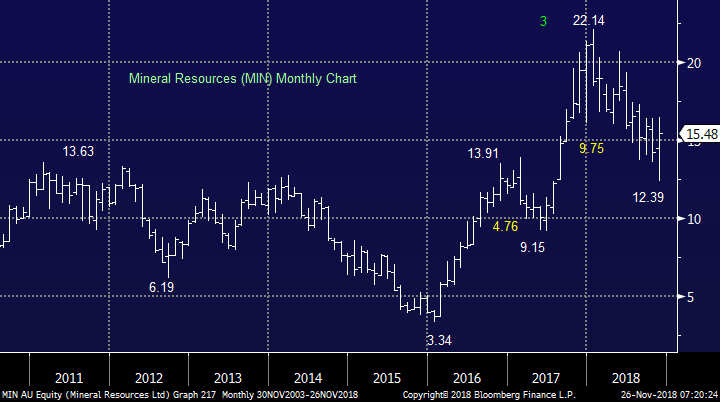
“Hi James and M&M team, could you advise those of us who haven't sold off MIN what to do, the share price went from $12.45 to $15.60 from the FY18 results, look impressive, could you give us an expected sell level to consider.” - Love your work Tony.
Hi Tony,
Well done, you out played us! As touched on last week If we still held MIN we would take the latest news and subsequent kick higher in the stock as an opportunity to exit. The 40% earnings downgrade seems to have gone unnoticed.
We are neutral MIN at current levels.
Mineral Resources (ASX: MIN) Chart
Question 9
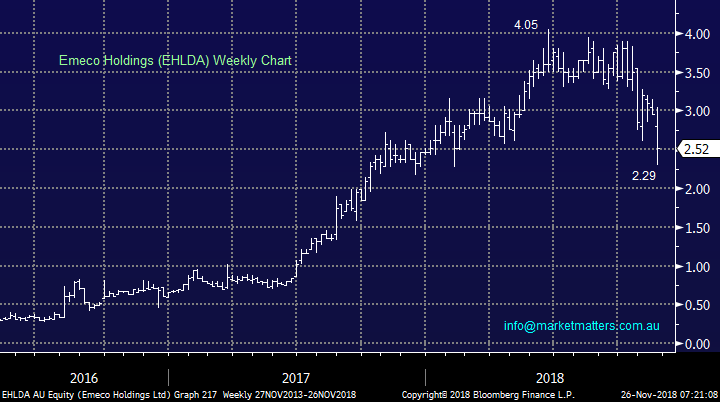
“Can you please give me some insight as to the dramatic slump in Emeco shares when the change to 1 for 10 shares was instigated at the AGM recently? I really appreciated your valuable insight into the market and look forward to receiving emails.” - Thank you, Ted M.,
Hi Ted,
I believe you may be looking at the wrong code, Emeco (ASX: EHLDA) which EHL trades on right now given the reconstruction of the shares (consolidation) is only correcting pretty much in line with the ASX200. The old EHL code will come back shortly after the deferred settlement arrangement completes.
Emeco Holdings (ASX: EHLDA) Chart
Question 10
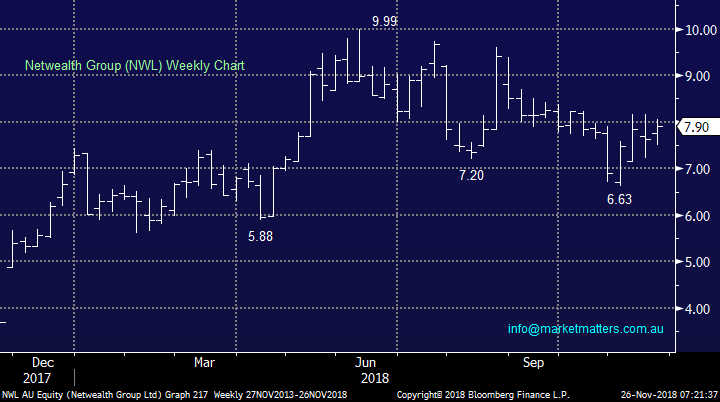
“MM Team, firstly, I like your call on BTP Beach Energy - stock has gone from strength to strength since oil's recovery from early 2016. Oil prices can't stay at US$50 a barrel - half of shale is not profitable at this level, and the Saudis need US$80 for fiscal balance (although that might be a stretch, especially given Trump's bleating). Current weakness is definitely a buying opportunity - expect production cuts in December when OPEC meet. Keen to get your thoughts on Netwealth - looks like a great company with excellent growth prospects, but at what price? What's the technical picture look like for this growth stock?” – Regards Scott T.
Hi Scott,
Net Wealth Group (NWL) looks great technically, however I have my concerns around margin pressure in the investment platform space as competition and regulatory pressure collide. Technically though it looks bullish targeting $10.
Netwealth Group (ASX: NWL) Chart
Question 11
“A question for James on Monday if I may! James - have been following your commentary on the banks with interest and you have been pretty much on the money so far. Is it possible to sharpen the analysis for the big four banks a little? If your thesis for the big 4 works out as it appears that it may well do - a Nov/Dec Santa Rally followed by a pullback in Q1 2019, what is the likely to be the best course for those currently invested to be thinking about? I am thinking that clear technical signals of a Q1 pullback eventuating might be the time to divest, with a review of the washup of the Hayne RC report's effects after they publish (Feb 19 I believe?), and possibly buying back into the banks if they take a knock from the publicity of the commission’s report. Put another way - how do you feel the banks will go longer term through 2019.” – Karl B.
Hi Karl,
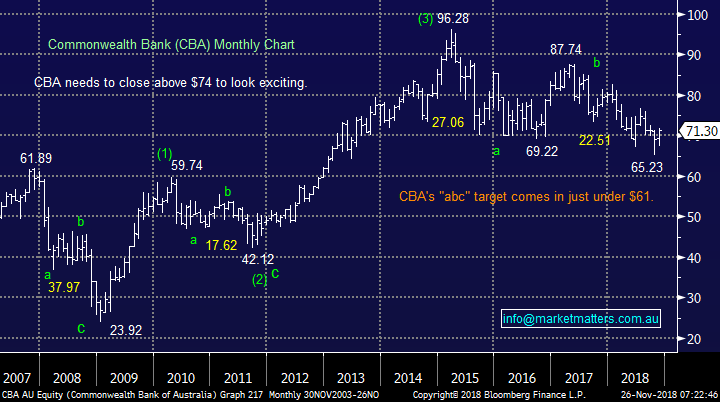
If the ASX200 is eventually going to test the 5000 area in 2019 / 2020 as we believe the banks almost certainly decline to some degree. However, we believe they will outperform and continue to pay healthy dividends along the way, while the benefit of franking (for some) will likely be decided by Bill Shorten in 2019.
The best course of action for investors will often depend on personal tax circumstances which we cannot discuss i.e. many Australians hold the “big 4” from significantly lower levels.
The options are numerous and include from selling looking to rebuy lower, hedging a portfolio via an ETF or hedging using other mediums – happy to discuss with you – James
Commonwealth Bank (ASX: CBA) Chart
Overnight Market Matters Wrap
· The US maintained its downtrend last Friday, with all 3 major indices closing in the red on a shortened trading session.
· Crude oil slid further, down 7.71% and on its 7th consecutive weekly loss and its lowest since September 2017 following concerns of global oversupply.
· BHP is expected to underperform the broader market after ending its US session down an equivalent of -1.97% from Australia’s previous close.
· The December SPI Futures is indicating the ASX 200 to open 57 points lower towards the 5660 level this morning.
Have a great day!
James & the Market Matters Team
Disclosure
Market Matters may hold stocks mentioned in this report. Subscribers can view a full list of holdings on the website by clicking here. Positions are updated each Friday, or after the session when positions are traded.
Disclaimer
All figures contained from sources believed to be accurate. Market Matters does not make any representation of warranty as to the accuracy of the figures and disclaims any liability resulting from any inaccuracy. Prices as at 26/11/2018
Reports and other documents published on this website and email (‘Reports’) are authored by Market Matters and the reports represent the views of Market Matters. The MarketMatters Report is based on technical analysis of companies, commodities and the market in general. Technical analysis focuses on interpreting charts and other data to determine what the market sentiment about a particular financial product is, or will be. Unlike fundamental analysis, it does not involve a detailed review of the company’s financial position.
The Reports contain general, as opposed to personal, advice. That means they are prepared for multiple distributions without consideration of your investment objectives, financial situation and needs (‘Personal Circumstances’). Accordingly, any advice given is not a recommendation that a particular course of action is suitable for you and the advice is therefore not to be acted on as investment advice. You must assess whether or not any advice is appropriate for your Personal Circumstances before making any investment decisions. You can either make this assessment yourself, or if you require a personal recommendation, you can seek the assistance of a financial advisor. Market Matters or its author(s) accepts no responsibility for any losses or damages resulting from decisions made from or because of information within this publication. Investing and trading in financial products are always risky, so you should do your own research before buying or selling a financial product.
The Reports are published by Market Matters in good faith based on the facts known to it at the time of their preparation and do not purport to contain all relevant information with respect to the financial products to which they relate. Although the Reports are based on information obtained from sources believed to be reliable, Market Matters does not make any representation or warranty that they are accurate, complete or up to date and Market Matters accepts no obligation to correct or update the information or opinions in the Reports. Market Matters may publish content sourced from external content providers.
If you rely on a Report, you do so at your own risk. Past performance is not an indication of future performance. Any projections are estimates only and may not be realised in the future. Except to the extent that liability under any law cannot be excluded, Market Matters disclaims liability for all loss or damage arising as a result of any opinion, advice, recommendation, representation or information expressly or impliedly published in or in relation to this report notwithstanding any error or omission including negligence.


