Subscribers questions (ELD, RHL, SPT, MFG, VRT, MND, CDM, AYS)
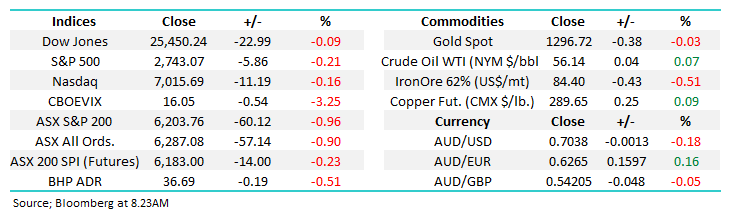
Major market news was not dramatic but very interesting over the weekend and should give us a useful gauge to the markets strength at this potentially elevated 6200 area i.e. the index is currently trading above its average historical valuation while earnings growth is declining:
1 – The US and China continue to have some issues on the currency front as China pushes back against the US by signalling that their exchange rate fixing mechanism will remain in place thus suggesting limited upside in the Yuan from its current 6.65-6.90 range. Not great market news but I do think most market players anticipate a short-term resolution of the US-China trade concerns.
2 – Sydney and Melbourne property enjoyed better, although not great, auction results over the weekend. Also, the lenders which are primarily the banks appear to be competing hard for the “blue ribbon” customers i.e. safe! A few stocks / sectors may take some solace from this but its going take a lot more than one week to call a bottom to the Australian property market, at MM we feel the worst damage is probably now behind us.
A combination of the above is likely to be neutral the local market for today’s open, when the US closed at the end of last week the SPI futures were calling a decline of around 15-points.
MM remains in “ buy mode” primarily due to our elevated cash levels but we are currently not planning to chase strength – we continue to slowly adopt a more neutral stance.
Thanks again for some great questions this week where the reoccurring theme of Mays looming Federal Election and Labors plans around franking credits is clearly at the front of many subscribers minds.
ASX200 Index Chart
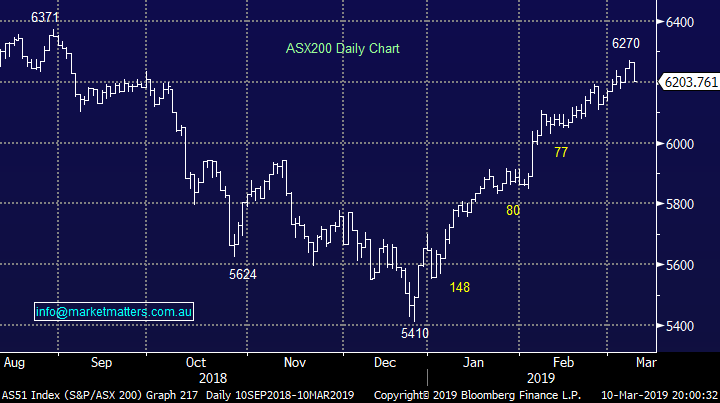
One story that did catch my eye over the weekend was in the Financial Review (AFR) where the Bank of America’s Foreign Exchange (FX) strategist is now calling the $A up towards 81c by the end of 2020 – our view since January.
Their opinion is based on expectations China will stimulate the economy further to maintain growth but at MM we believe this will only be half of the picture with our bullish $A call also founded on a belief that markets are too optimistic on US growth over the next few years.
Australian Dollar ($A) Chart
Question 1
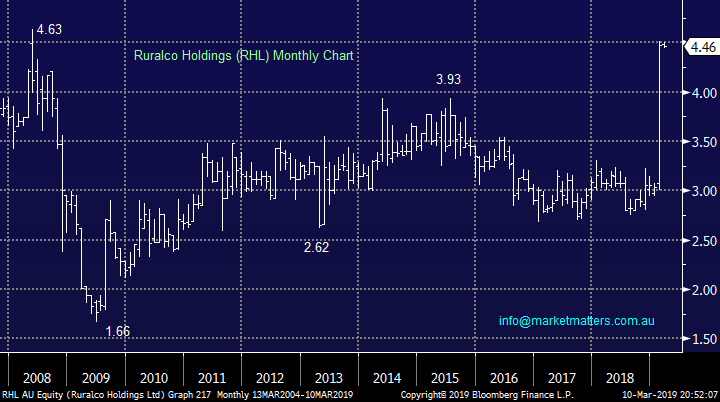
“Hi James, very interested in Elders at the moment. It looks at the moment that Nutrian who own Landmark are trying to buy Ruralco. This is effectively Elders 2 biggest competitors joining forces. There will be some serious consolidation as the business tries to reduce costs. There will no doubt be many CRT stores (owned by Ruralco) closing and trying to get the business to move over to Landmark. There are also CRT agent stores- stores that are independently owned but buy through the CRT network that will be put out by this and may align themselves with either independent networks or Elders. The single biggest winner out of all this will be elders.” – Cheers
As always, we certainly appreciate your insights here. Those on the ground dealing / interacting in various sectors have a better grasp of what’s actually going on at the coal face than we do.
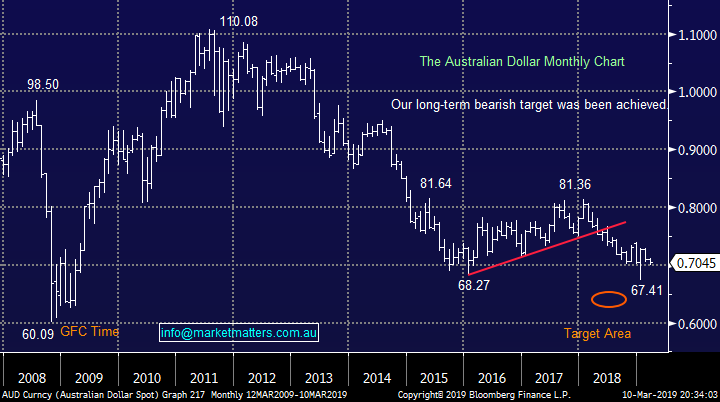
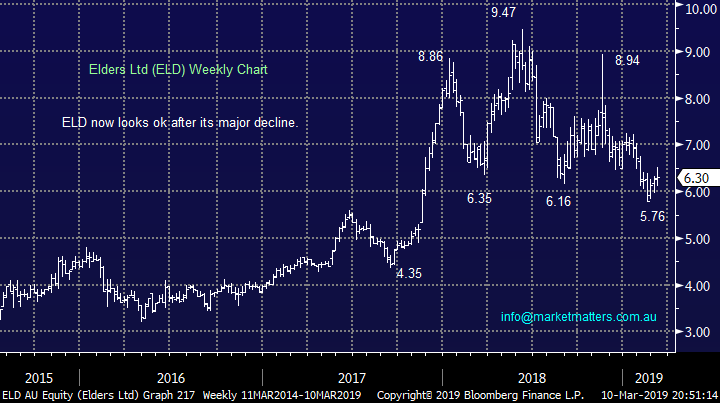
We’ve been looking at Elders (ELD) during most of 2019 as the Australian rural sector endures some really tough times, a combination of both drought and floods is a hard one for our tough local farmers. The company is almost a household name in Australia operating rural services businesses that encompass most of the farming community. However their shares remain well over 30% below their 2018 high with the stock actually falling over 10% in January alone illustrating the risks with “picking bottoms” too early, particularly in this sector.
Recently ELD has been struggling since they released their full year results in November casting doubts over the boards revenue growth target of 5-10%. However the business is cheap trading on Est P/E for 2019 of 10.8x however, multiples high or low need to be tied directly to earnings. As an investor, we will pay a high multiple for businesses have consistently growing earnings, the more consistent (visible) the better. You can clearly see from the below earnings graph that elders earnings per share have traded between 70cps and 45cps, huge volatility, no growth and not a lot of visibility / certainty given the impact of external factors.
Elders (ELD) Earnings Per Share (EPS)
At its last AGM they did suggest some parts of the of the drought stricken communities were improving slowly.
MM likes ELD closer to the $5.50 area from both a technical and fundamental basis.
Elders Ltd (ELD) Chart
Ruralco Holdings (RHL) Chart
Question 2
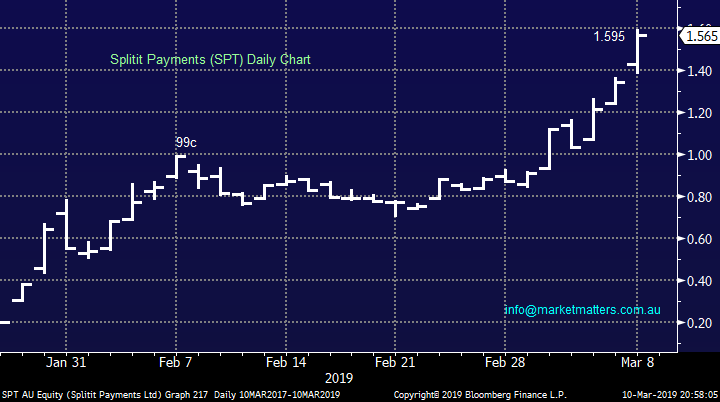
“Hi guys, A quick question for your QnA report. To my knowledge you have mentioned Splitit just once (and it was in passing) since its recent IPO. It's had a phenomenal run, and keeps on going! Appreciate your thoughts.” - Cheers, Jeff M.
Hi Jeff,
You are correct on both fronts, this Israeli-based instalment payment solution business is almost putting Afterpay (APT) to shame from a performance perspective so far this year. This is clearly a hot sector, similar to lithium last year before they all came crashing down in a heap. SPT now has a market capitalisation of over $410m making it feel very rich and very much in the speculative bucket in our opinion but we acknowledge the euphoria and upside momentum remains strong.
Importantly their offering is different to Afterpay (APT) and Zip Money (Z1P) allowing customers to pay for a products using their existing credit cards but divide the total cost across as many interest-free monthly payments as they feel is necessary, up to a limit of 3-years, this can even be applied across multiple cards. The service platform also offers merchants the option for shoppers to try out items for up to 90-days before any payment is charged to their credit card, the cost is put on hold on the credit card to protect the merchant, ensuring that payment is made in the event the item is not returned and the shopper does not actively finalise the purchase. However If the shopper returns the item, the hold is released, and the shopper is not charged any interest / fees. I like the variance of offering to the bigger competitors but they can follow suit very quickly if SPT continues to get traction.
While we don’t cover Splitit from a research perspective (at Shaw) we have looked at the business
· SPT is currently valued at a 3,360% premium on a mkt cap to sales measure to Z1P and 1,370% to APT;
· SPT grew quarterly revenues 22% quarter on quarter in December versus, APT at likely 60-70% (APT rough estimate of 4th December quarter sales) and Z1P at 60%;
· Z1P is currently at an ~55% discount to APT on quarterly rev/sales basis; and
· Z1P market cap~ $525m, APT at $4.4b and SPT at ~$400m.
While we couldn’t buy SPT on the above metrics, momentum is clearly there.
We believe SPT is an aggressive buy with stops below $1.10 – high risk stuff.
Splitit Payments (SPT) Chart
Question 3
“Hi Guys, a question regarding the 45 Day rule - if it still exists. If I buy 100 shares in ABC Company the day before it goes Ex Dividend, do I need to wait 45 days (not including buy and sell days) before I can sell the shares to be eligible for the dividend? Keep up the good work.” - Cheers, Michael H.
Hi Michael,
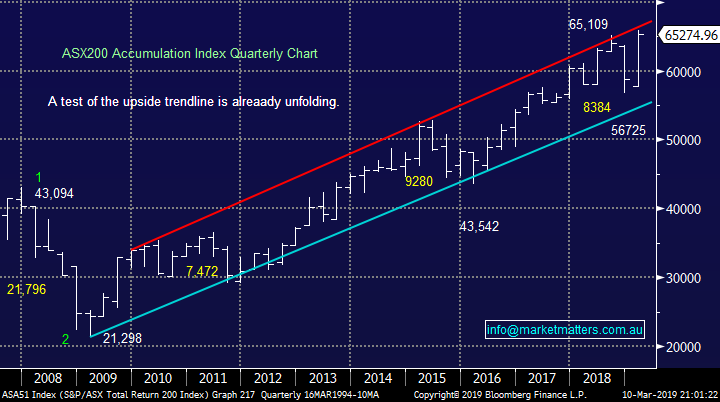
Dividends are a very important component of stock market investing, especially with the high yielding Australian market which is best illustrated by the chart below which shows us trading around all-time highs when dividends are taken into account.
The 45-day trading rule you mentioned appertains to the franking credits component of dividends as opposed to the underlying dividends themselves, obviously the benefits of such franking credits varies from investor to investor depending on their individual financial position. Importantly, the 45 day rule as you rightly suggest, does not include day of purchase or day of sale.
ASX200 Accumulation Index Chart
Question 4
“QUESTION for Monday MQG ANZ NAB & WBC pay their dividends in early July. Due to Labor's threatened franking credit changes, what are the chances of these four banks doing us a favour and bringing the payment of these dividends forward into June” – John C.
“Hi James, I think it would be worthwhile clarifying the issue of Franking Credit refunds for those in receipt of Centrelink Pensions. Under the Labor proposal, those in receipt of a Government Pension needed to be in receipt of that pension by the 28th March 2018. They are Grandfathered – all others miss out. The misconception is that many people think they can reduce their assets after the above date in order to qualify for the franking refunds. They will be disappointed. The devil is in the detail and the proposed change is far more punitive than is being exposed. When people find out, it will be too late! As an aside, but on the same issue, I was approached by Labor promoters this morning at the train station (pending elections). I said, “Oh. You’re the guys who are going to take our Franking Credits away”. He response, “Don’t believe what you read in the press”! Really, why would they promote the issue if they weren’t going to follow through.” - Cheers, Peter M.
“Hi James, I saw a report on 'The Business' which mentioned the large franking account balances that the big banks have and their potential motivation to utilise them for the final dividend payouts. What do you think of this as an investing opportunity between now and the implementation of any new legislation later this year? Are there other companies which may be motivated to declare handsome dividends to utilise franking accounts? It would appear that tax paying entities (companies and superannuants in accumulation) would not be affected by the removal of refundable franking credits.” - regards, Robert J.
Hi All,
This is clearly a pertinent topic at the moment, and we’ll do a piece this week in the income portfolio about it. We covered it specific to hybrids last week which the second question / comment relates to. To view that article – CLICK HERE
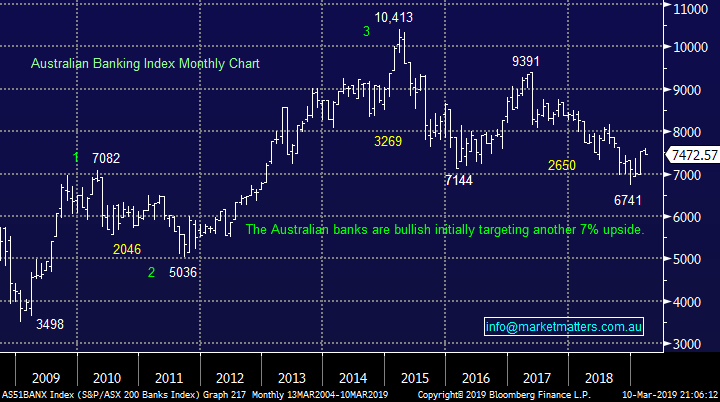
ASX200 Banking Index Chart
Question 5
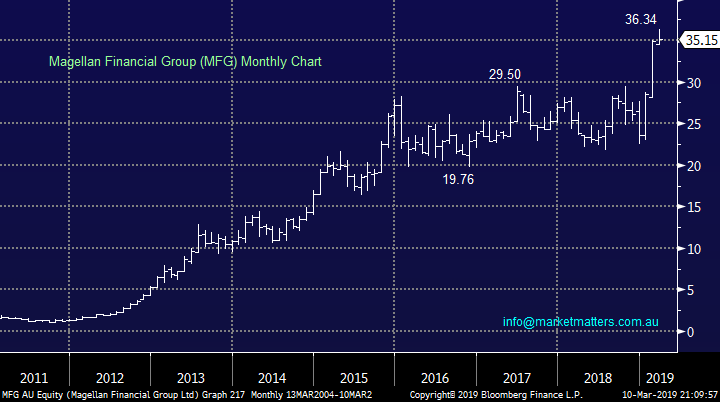
“Hi James, just wondering you views on the stellar performance of MFG since the beginning of January – up over 50%. Given the threat to Franking Credits and the Australian economy, would you think investors are moving funds offshore?” - Cheers, Peter M.
Hi Peter,
The attraction of overseas investments is likely to increase if the benefit locally from franking credits is reduced as Labor are planning – it would be ironic if we see such a stampede just as the ASX200 starts outperforming its global peers for the first time since the GFC, history shows us such events often create inflection points.
From a valuation perspective, while MFG has run hard its only trading on a forward P/E of 18.7x which is close to its 5 years average of 18.6x. As we’ve written about in the past, fund managers are leveraged plays to the market. In a weak market MFG traded down to a P/E of 14x while its peaked at 24.1 times during bullish markets. MFG is clearly a quality operator and justifies a premium to their peers, however looking globally, the average P/E of the sector sits around 12x implying MFG is expensive.
If the market continues to perform MFG will generate higher earnings and those earnings will be put on a higher multiple. If market struggle, expect MFG to we worse off than the market given that earnings leverage.
We remain bullish the market overall for the first half of the year, so bullish MFG, however from a risk /reward perspective, its too hot to buy now.
Magellan Financial Group (MFG) Chart
Question 6
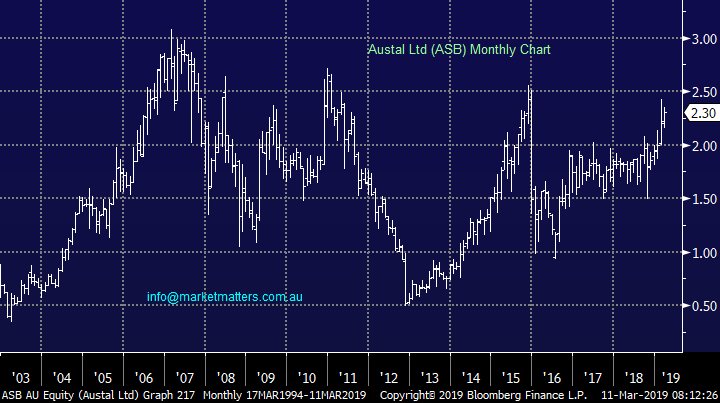
“Any reason you haven't been following Austal - one of the true success stories in the ASX in my opinion” – Michael B.
Hi Michael,
As I am sure you are aware ship builder Austal Limited (ASB) increased its revenue guidance in February showing revenue by ~25% to $1.9bn which has clearly helped the share price close in on its 2015 highs. The are 2 main reasons we have not been following ASB over recent years:
1 - The most important being the average daily turnover, around $1m a day makes it very hard for MM to buy / sell the stock without a material impact on the share price.
2 – The stock still remains well below its 2015 high as opposed to the ASX200 which is nicely higher.
Hence we agree this is a solid company doing good things but it’s tough for us to follow all stock’s, especially ones where it’s very hard for MM to invest.
Austal Ltd (ASB) Chart
Question 7
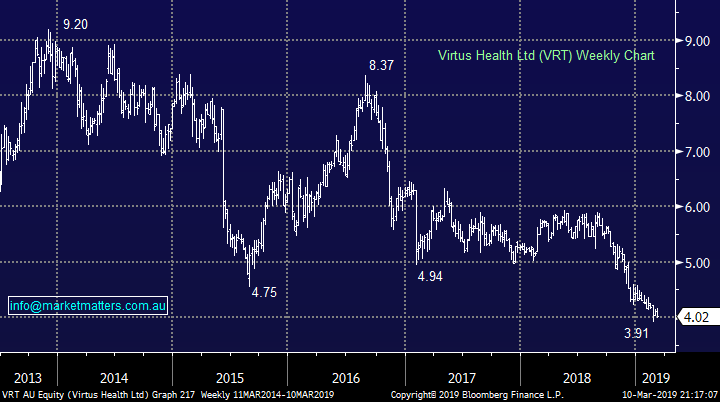
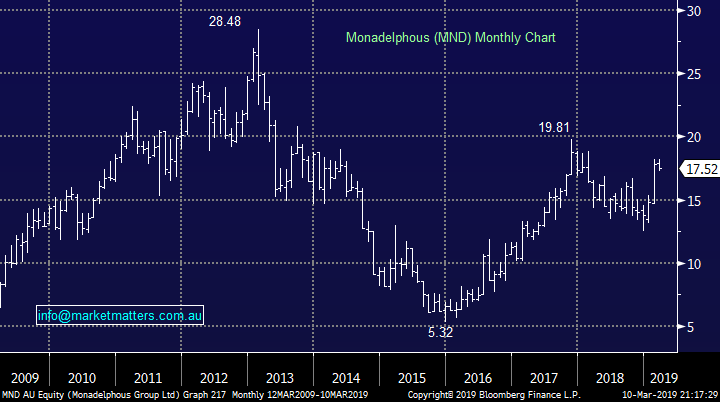
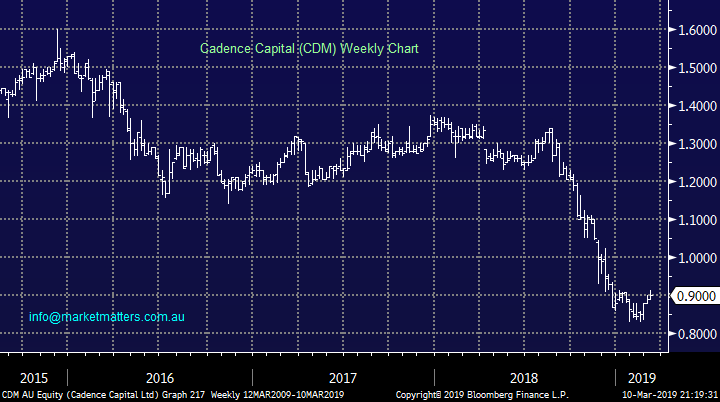
“Is this where I ask subscriber's questions? Hope so...glad of your advice on these three shares. We have held VRT in our super fund for years after a recommendation from an on-line subscription advisor. Since then, cheaper players have come into the market and the share price is quite a long way under our purchase price, although the company does pay a dividend. Should we cut our considerable loss or wait to see better days? MND in a similar position, but happy to hold while price continues to rise. Lastly, any idea why CDM's price is so far under NTA? In general, surely the rise in the market since last year can't be the start of another bull run, given all the unknowns out there. Hope not, sitting on too much cash and can't find value!” Ross & David W.
Hi Guys,
A large question so I will cover each part briefly and in general terms:
1 – The IVF company VRT is trading at all time lows failing to live up to the hype when its was floated back in 2013. The sector has struggled not helped by increased regulatory requirements and technology innovations – not one for MM unfortunately.
2 – Engineering business MND is enjoying a strong 2019 helped by strong results last month where NPAT came in just over $30m plus management were upbeat around the future outlook. The stock looks good technically while it can hold above $16.50.
3 – Investment company CDM is like a number of investment businesses trading well below their NTA. At 90c its cheap, however its performance stinks – they lost nearly 20% last calendar year and until they can turn that around, the discount will persist. Not one for us.
Virtus Health (VRT) Chart
Monadelphous (MND) Chart
Cadence Capital (CDM) Chart
Question 8
“Hi MM, Great work thus far. Just want to get your opinion on Amaysim (ASY) on its current price and placement. Sometime back it was near 2 dollars then it fell below a dollar.” -Thanks, Jacky L.
Hi Jacky,
AYS was hammered last month after returning to the boards after looking to raise over $50m at 60c, a then 36% discount for investors. The monies are to be used for debt reduction and strengthening of the balance sheet – not growth hence the markets distaste for the offer.
The institutional component was completed raising 35.1m at 60c, its now open to retail holders of the stock with the aim of raising another $15m at 60c, in a 1 for 2.5 non-renounceable rights issue. With the stocks at 63.5c currently, it’s a slim margin and not all retail investors may take up their rights. The deal is full underwritten, so in theory an investment bank could end up with a lot of stock that they don’t necessarily want to hold providing another headwind for the share price.
I would put the stock in the “watching category” at this point in time, it may offer a good trading opportunity later in the year however the momentum is clearly on the downside and a capital raising muddies the waters for now.
Amaysim Australia Ltd (AYS) Chart

Question 9
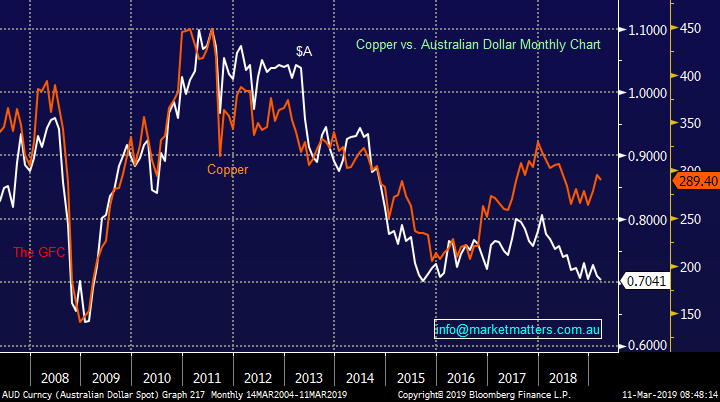
“Hi MM Team, struggling to understand your rational for an appreciating AUD$ to 80 cents? You believe iron ore prices have peaked and are likely to come off recent highs; you acknowledge underlying weakness in the Australian economy due to high levels of consumer debt etc; and you acknowledge the possibility of interest rate cuts - all of which are negative for the AUD$. It is conceded that the short AUD$ position may be a crowded trade, but perhaps it is crowded for a reason (or multiple reasons as the case may be). Even it there is US$ weakness, surely weakness in the local economy / currency is just as likely to offset this (if not be weaker). Bearing in mind that the US interest rates on hold scenario, is probably already baked into the currency. If global growth continues to slow, I suggest that it will be impossible for the AUD$ to appreciate significantly. The only possible tailwind I can see is if global growth has bottomed and the Chinese economy in particular starts to turn around. Happy to hear your counter argument.” Regards Scott T.
Hi Scott,
We touched on this earlier but simply we believe the elastic band of pessimism towards the $A has been stretched too far, as has optimism towards the $US, plus as you mentioned China will in our opinion continue to fuel their economy. The chart below illustrates how we have ignored the copper price over recent years, not something that usually lasts.
We had been bearish the $A over the last few years and are simply expecting some mean reversion - remember a bounce back to 80c is not much considering the decline from 1.10. Occasionally all logic is already built into a markets price i.e. things always look best at a top and vice versa.
MM still believes we will see 80c before 60c for the $A against the $US.
$A v Copper Chart
Overnight Market Matters Wrap
· The SPI is down 14 points as US equities closed lower on Friday night. The Dow was down 0.1%, while the S&P 500 and NASDAQ closed 0.2% in the red.
· US jobs released on Friday night came in at just 20,000 in February, way below expectations of 180,000. Wages rose 3.4% from a year earlier and unemployment fell to 3.8% from 4%.
· The head of the Fed, Jerome Powell, indicated he is in no hurry to change interest rates while global growth is slowing and inflation remains in check. He will give details around plans for the balance sheet “reasonably soon”.
· Metals on the LME were generally lower, with nickel down 1%, the worst performer. Iron ore fell 2% and Brent crude oil traded down 0.8%. Safe haven gold rose over USD12 to USD1298/oz.
Have a great day!
James & the Market Matters Team
Disclosure
Market Matters may hold stocks mentioned in this report. Subscribers can view a full list of holdings on the website by clicking here. Positions are updated each Friday, or after the session when positions are traded.
Disclaimer
All figures contained from sources believed to be accurate. Market Matters does not make any representation of warranty as to the accuracy of the figures and disclaims any liability resulting from any inaccuracy. Prices as at 11/03/2019
Reports and other documents published on this website and email (‘Reports’) are authored by Market Matters and the reports represent the views of Market Matters. The MarketMatters Report is based on technical analysis of companies, commodities and the market in general. Technical analysis focuses on interpreting charts and other data to determine what the market sentiment about a particular financial product is, or will be. Unlike fundamental analysis, it does not involve a detailed review of the company’s financial position.
The Reports contain general, as opposed to personal, advice. That means they are prepared for multiple distributions without consideration of your investment objectives, financial situation and needs (‘Personal Circumstances’). Accordingly, any advice given is not a recommendation that a particular course of action is suitable for you and the advice is therefore not to be acted on as investment advice. You must assess whether or not any advice is appropriate for your Personal Circumstances before making any investment decisions. You can either make this assessment yourself, or if you require a personal recommendation, you can seek the assistance of a financial advisor. Market Matters or its author(s) accepts no responsibility for any losses or damages resulting from decisions made from or because of information within this publication. Investing and trading in financial products are always risky, so you should do your own research before buying or selling a financial product.
The Reports are published by Market Matters in good faith based on the facts known to it at the time of their preparation and do not purport to contain all relevant information with respect to the financial products to which they relate. Although the Reports are based on information obtained from sources believed to be reliable, Market Matters does not make any representation or warranty that they are accurate, complete or up to date and Market Matters accepts no obligation to correct or update the information or opinions in the Reports. Market Matters may publish content sourced from external content providers.
If you rely on a Report, you do so at your own risk. Past performance is not an indication of future performance. Any projections are estimates only and may not be realised in the future. Except to the extent that liability under any law cannot be excluded, Market Matters disclaims liability for all loss or damage arising as a result of any opinion, advice, recommendation, representation or information expressly or impliedly published in or in relation to this report notwithstanding any error or omission including negligence.


