Subscribers questions (BHP, OZL, CBA, QBE, BUB, BAL)
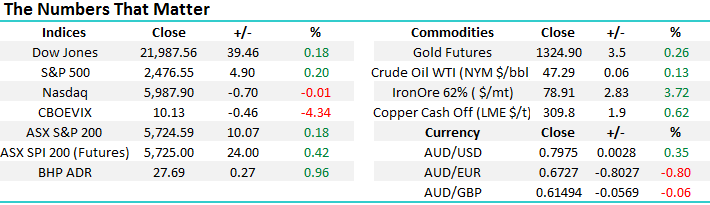
Similar news, different day, this time North Korea successfully conducted its 6th nuclear test with the blast causing a 6.3 magnitude earthquake within its own country. There appears to be no doubt that Kim Jong-un is trying to push some buttons within the UN, testing Donald Trump’s stability and at the same time calling China’s bluff on further economic sanctions. Considering the characters in this play, trying to forecast the outcome of this scary satire is almost futile but more twists / turns and tweets feels almost inevitable.
The market has to-date brushed off the first two episodes of North Korea however the longer this goes on, clearly the more risk of ‘fire and fury’. While we can all hope and pray that no conflict unfolds, from an investment perspective we simply need to stick to our previous plans that were made without the dangerous combination of “fear and greed”. This morning the $US has opened marginally stronger implying there will be no initial short-term panic – while US Futures are down 0.40%.
MM is currently holding 8.5% in cash with a few stocks in our cross hairs on both the buy and sell side, please refer to the Weekend Report for more detailed specifics.
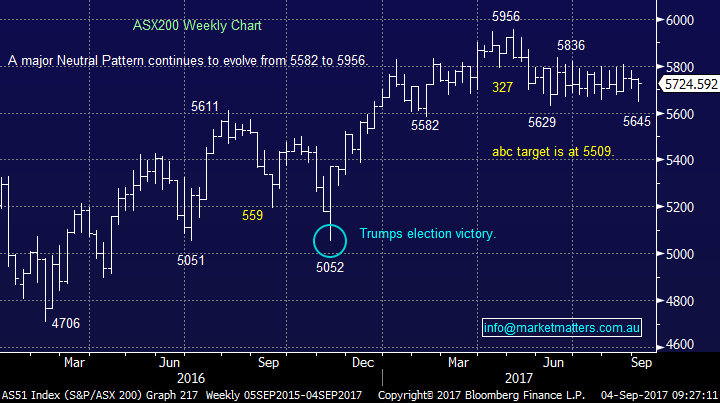
ASX200 Weekly Chart
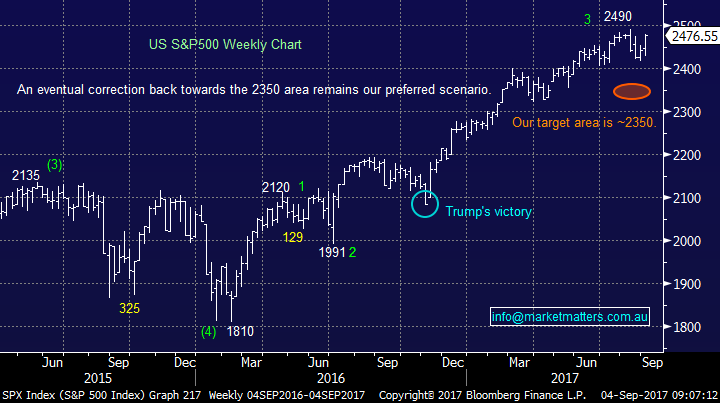
With regard to US stocks we still anticipate an eventual pullback towards the 2350 area for the S&P500, or around 5% from Fridays closing level. The nature of this potential correction is feeling similar to that back in mid-2016 which implies marginally higher prices before a decent pullback.
US S&P500 Weekly Chart
Question 1
“I have been unable to find a definition of “abc” target, please advise” – Thanks Peter T.
Morning Peter, a great question as its potentially a subject that needs clarification for a number of subscribers. An “abc” is a correction area / target when a stock is pulling back which can be used as an entry level to purchase / accumulate a stock.
As we have said previously technical analysis is not a pure science but markets do repeat themselves, primarily because they are often driven by human emotion. Corrections in both stocks and markets can take a number of different forms but an “abc pullback” is a regular occurrence which can be used to pull the “trigger” enabling us to buy when things are looking pretty average, obviously assuming we are looking to buy for other reasons.
Simply a market has an initial correction to point “a”, it then attempts to rally to point “b” and then falls again to point “c”. Ideally the length of the initial down move to point “a” will be very similar in magnitude to the second pullback “b-c”.
Proactive investors will be looking to buy around the c target whereas others will look to buy once the market has recovered back up through point “a”.
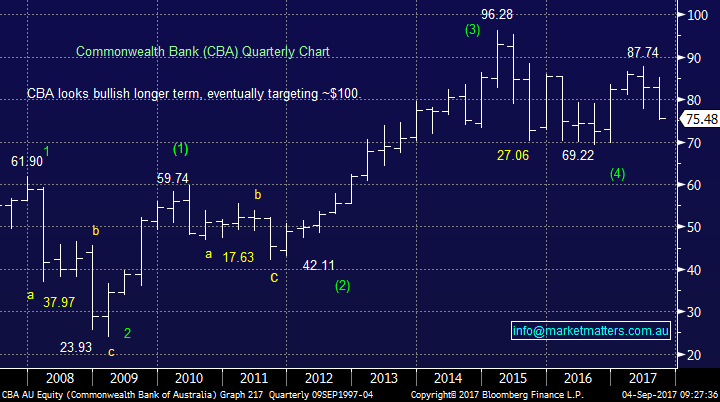
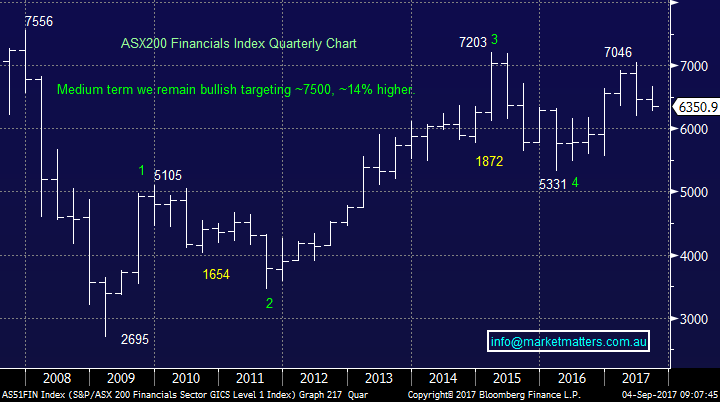
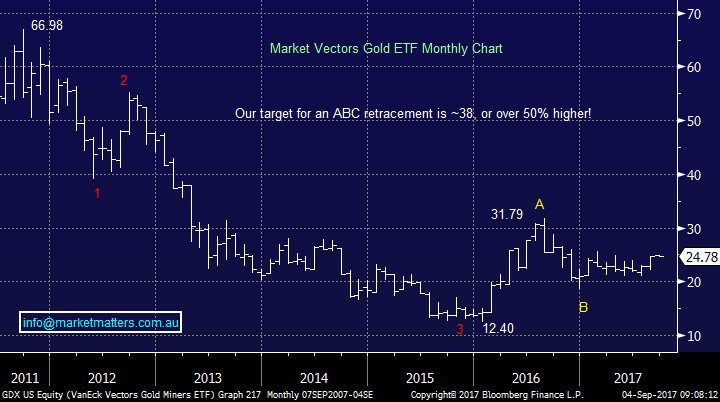
We have shown 3 great previous examples below plus the current gold ETF that we feel has a strong possibility of rallying up to form a point “C”, i.e. bullish gold stocks.
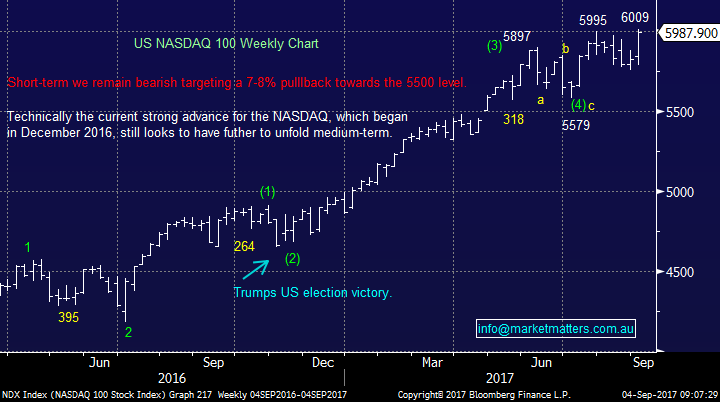
US NASDAQ Weekly Chart
Commonwealth Bank (CBA) Quarterly Chart
ASX200 Financials Index Quarterly Chart
Market Vectors Gold ETF Monthly Chart
Question 2
“Yes, thanks a great report today. If you are considering resources, then the Internal Growth Factor (IGF) becomes relevant. Similar to other company ventures and also when you considered the HGG merger, there was a clear IGF path. But with resources there is always the value of the discovered mineral in the ground and the closer it becomes to getting proven and then actually mined, the more valuable the shares become. So, with companies like GXY and OZL, whilst they have existing income stream, they also have new ventures - just like any other company does. However, there is now the Chinese activity External (EGF) which becomes relevant as the mineral price increases. Why not try to clarify both GF’s at the same time? So, when talking about resources, it might help if both the External & Internal GF was considered (even if only qualitative). For example, how much might the OZL new Prominent, Eloise and Carrapateena developments affect your value judgement, especially as they appear to have the money to develop some of these? I am sure that these factors are considered by share purchasers as the EGF may yet again dominate the IGF. But we have our own job to do and hence don’t have the time and skills to clarify this.” – Thanks, and regards Phil B.
Morning Phil, thanks for the comprehensive question which hopefully will help clarify our view around investing in resource stocks.
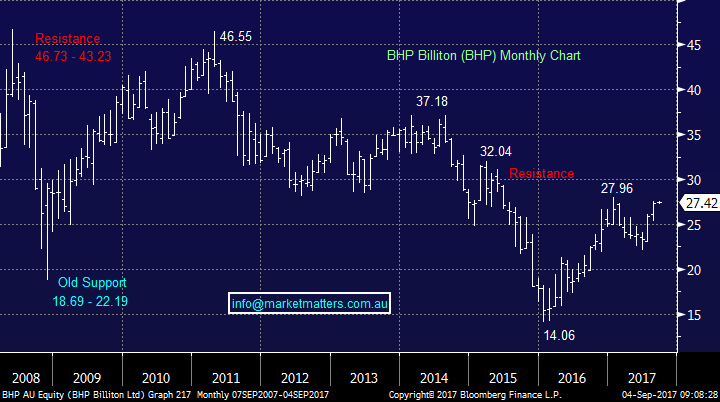
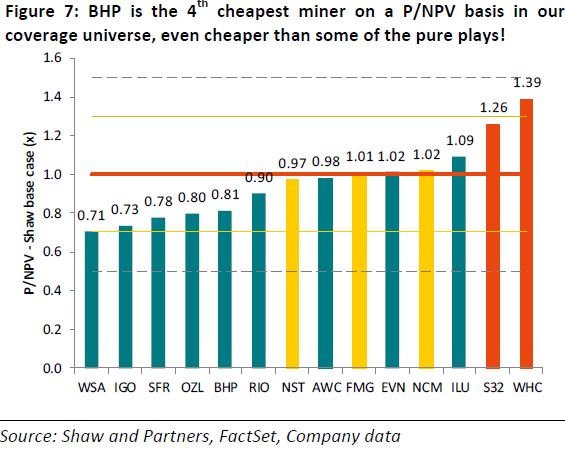
BHP arguably the most famous company in Australia and our largest resource company is still trading over 40% below its 2011 high, even after rallying almost 100% since early 2016 – over the same period the ASX200 has rallied strongly. The picture is not surprisingly very similar for most stocks within the sector. As most of us know the decline was primarily due to the collapse in iron ore from almost $US200/tonne to under $US40/tonne in late 2015. Importantly resource stocks are price takers, not price makers, and hence their profitability is largely dependent on the very cyclical price of commodities.
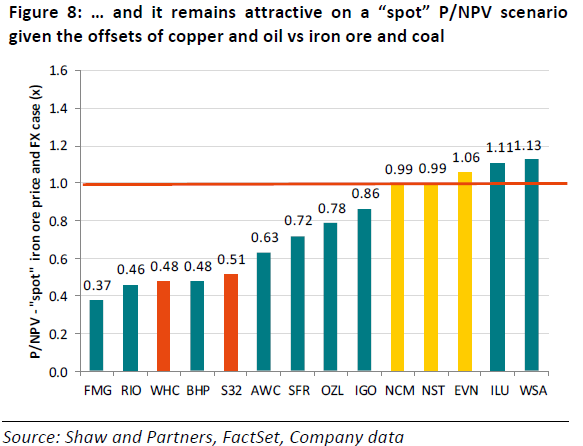
The point we are looking to make is there are a number of factors involved with valuing resource stocks many of which can be tricky to evaluate. However, we do look at likely future earnings when we value a stock, especially on a comparative basis, however the more important aspect to getting our commodity calls right, is having a view on the underlying commodities themselves and importantly, the consensus view of these commodities – or in other words, how is the market positioned. If the consensus is bullish, this sets up a higher chance for disappointment, and vice versa.
Right now for instance, consensus suggests that in FY18 the resource stocks on the ASX will make $13b, however, using spot commodity prices gives a number closer to $18bn highlighting that analysts are still on the bearish side. All of this comes into play, hence at MM we regard the resources sector as one which is for the active investor, we have never held a position for more than 6-months and are often (as was the case in 2014-2015) comfortable having no exposure whatsoever to these much loved but volatile stocks
BHP Billiton (BHP) Monthly Chart
Question 3
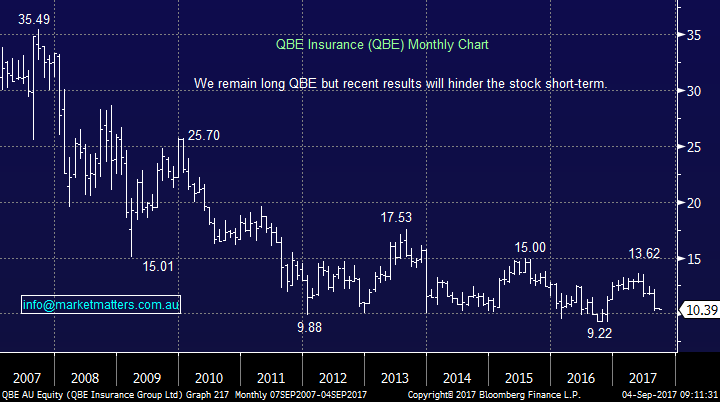
“Hi, Good morning James and MM team, I would like to ask a question around QBE which I believe MM have a 7% portfolio holding in and since reporting yearly numbers on the 17th of August, the stock been punished around 13.50% in just a fortnight (of course, it also went ex-dividend for $0.22 franked at 30% during this time). Clearly the market were disappointed once again and I think this is the 4th consecutive profit / guidance miss from QBE in the last few years. Peter Switzer interviewed John O’Neal on the 17th of August and asked why should investors still stick with the company and the response was for every 1% move in US interest rates, it brings $250m towards QBE bottom line. Given all the curve balls potentially out there, does MM believe rates in the US will go up as fast as once thought 12 months ago while the $AUD remains stubbornly high. QBE currently trades at a discount to its peers at 13.80 forward earnings (IAG at 16.63 and SUN at 15.44) – is QBE a genuine turnaround story or will MM be considering selling into strength over the coming weeks. If MM believe US stocks are about to correct in later 2017 / 2018, then surely that will pull QBE down below $10.” - Kind regards, Tianlei J.
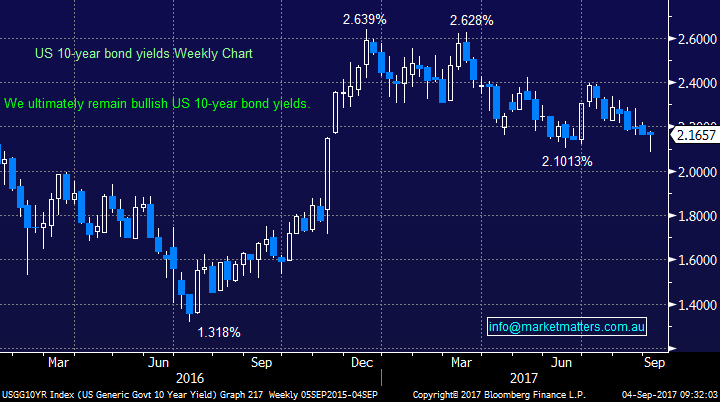
Morning Tianlei, thanks for the question, an area we touched on in the Weekend Report. At MM, we believe US interest rates are close to turning higher which as you said is very bullish for QBE hence we have held our position even while the stock has corrected. QBE did unfortunately have another disappointing report but this time the whole sector struggled i.e. Suncorp (SUN) and IAG Insurance (IAG).
Fingers crossed the management at QBE after four poor results can finally look after their investors but this is clearly an unknown.
A short-term recovery in QBE is likely to be driven but an uptick in US rates as opposed a corporate turnaround but as we prefer SUN within the sector selling into strength is a definite option.
US 10-year bond yield Weekly Chart
QBE Insurance (QBE) Monthly Chart
Question 4
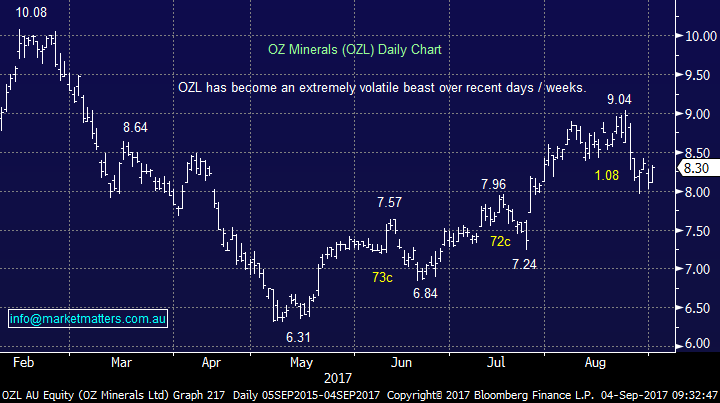
“Hi MM, need advice on OZL, it’s been very weak last few days.” - Thanks, Jeff K.
Morning Jeff, OZL is definitely an interesting stock at present. We were considering purchasing over the last week as a “trading idea”, firstly ~$8.30 and then at $8. On both occasions, we decided against the move because sector heavyweights like BHP and RIO are close to our sell targets.
Hence although OZL is close to strong technical support ~$8 as we are looking to sell / reduce our resources exposure in the coming weeks, subsequently it makes no sense to buy as a trade leaving us neutral OZL.
OZ Minerals (OZL) Daily Chart
Question 5
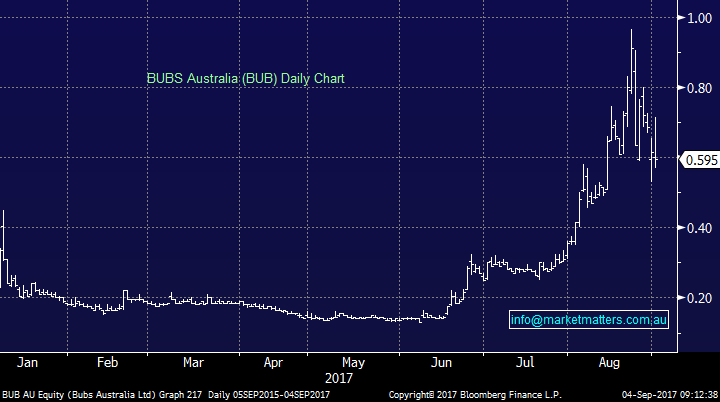
“What is your opinion on BUB? Would it be worth buying and hold, say for 3 years or so?“ - regards Jerry L
Morning Jerry, BUB is another baby food company producing nutritional foods e.g. milk formulas and organic baby foods. This is a company we have not followed closely, primarily because of its size, but obviously after rallying three-fold in a few weeks it’s in the highly speculative space – in the last 3 weeks alone it has swung 50% during each respective week. A stock that swings 50% a week is very risky and one that can hammer an investor returns if not treated accordingly.
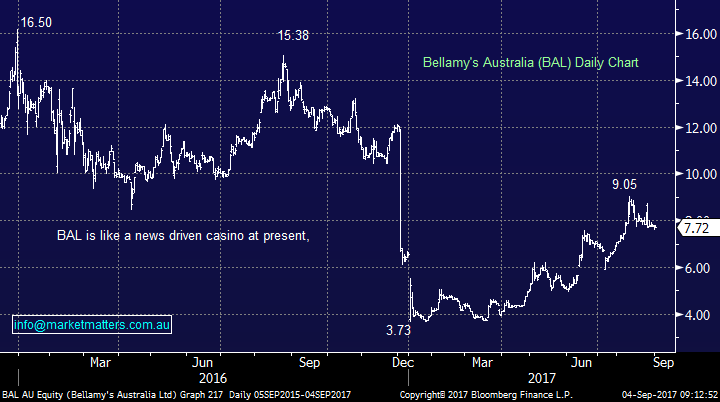
We could not look at this company long term at this stage, it’s more of a casino play. Remember the more established Bellamys has dropped over 50% this year so the sector’s swinging from hot to cold very quickly primarily around China news.
BUBS Australia (BUB)
Bellamys (BAL) Daily Chart
Overnight Market Matters Wrap
Friday’s session will be ignored after news over the weekend of a successful nuclear test set in North Korea was noticed by its neighbours.
Companies trading ex-dividend today are: Amcor (AMC), Fleetwood (FWD), Mantra (MTR, Nine Entertainment (NEC), Sky Network TV (SKT) & Super Retail (SUL).
Despite the last settlement of the September SPI Futures indicating the ASX 200 to open 22 points higher this morning, this morning’s US Futures is thinking otherwise, currently down 0.4% from last Friday’s session as geopolitical tensions rise…again!
Disclosure
Market Matters may hold stocks mentioned in this report. Subscribers can view a full list of holdings on the website by clicking here. Positions are updated each Friday.
Disclaimer
All figures contained from sources believed to be accurate. Market Matters does not make any representation of warranty as to the accuracy of the figures and disclaims any liability resulting from any inaccuracy. Prices as at 04/09/2017. 8.00AM.
Reports and other documents published on this website and email (‘Reports’) are authored by Market Matters and the reports represent the views of Market Matters. The MarketMatters Report is based on technical analysis of companies, commodities and the market in general. Technical analysis focuses on interpreting charts and other data to determine what the market sentiment about a particular financial product is, or will be. Unlike fundamental analysis, it does not involve a detailed review of the company’s financial position.
The Reports contain general, as opposed to personal, advice. That means they are prepared for multiple distributions without consideration of your investment objectives, financial situation and needs (‘Personal Circumstances’). Accordingly, any advice given is not a recommendation that a particular course of action is suitable for you and the advice is therefore not to be acted on as investment advice. You must assess whether or not any advice is appropriate for your Personal Circumstances before making any investment decisions. You can either make this assessment yourself, or if you require a personal recommendation, you can seek the assistance of a financial advisor. Market Matters or its author(s) accepts no responsibility for any losses or damages resulting from decisions made from or because of information within this publication. Investing and trading in financial products are always risky, so you should do your own research before buying or selling a financial product.
The Reports are published by Market Matters in good faith based on the facts known to it at the time of their preparation and do not purport to contain all relevant information with respect to the financial products to which they relate. Although the Reports are based on information obtained from sources believed to be reliable, Market Matters does not make any representation or warranty that they are accurate, complete or up to date and Market Matters accepts no obligation to correct or update the information or opinions in the Reports.
If you rely on a Report, you do so at your own risk. Any projections are estimates only and may not be realised in the future. Except to the extent that liability under any law cannot be excluded, Market Matters disclaims liability for all loss or damage arising as a result of any opinion, advice, recommendation, representation or information expressly or impliedly published in or in relation to this report notwithstanding any error or omission including negligence.
To unsubscribe. Click Here


