Subscribers questions (WBC, GXY, UMG, GNC, SDA, Z1P, XRO, APT, IRE, OVH, AUDS, VALE US, IPL, BGL, EVN)
Australia has just enjoyed our first long weekend (except QLD) with a degree of freedom in months and after crawling back down the M1 into Sydney yesterday afternoon all I can say is wow didn’t many of us take advantage of the relaxation! I believe many of have agreed that the lack of traffic on the roads has been a rare plus which emerged form Covid-19, unfortunately this appears to have returned to normal, let’s hope many other things do asap.
The number of deaths in Australia attributed to COVID-19 remains at 102, incredibly only 0.025% of the current global toll & less than 0.1% of the total number of people who are forecast to pass away in Australia this year. The numbers suggest that we have either dealt with the pandemic extraordinary well or our relative isolation from the rest of the world has insulated us from this deadly virus, either way we remain very much the lucky country.
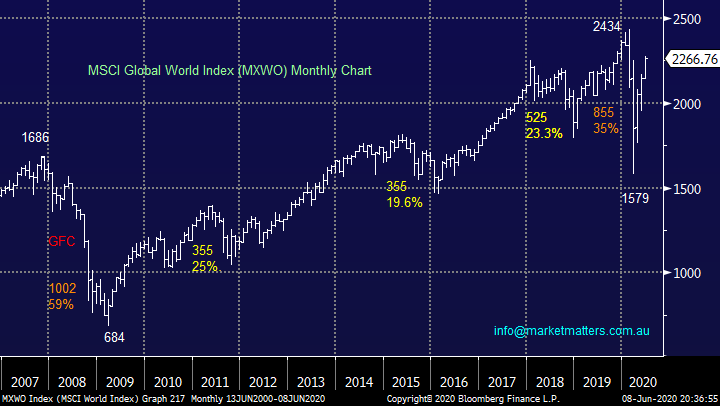
In many corners of the world attention has now moved on to the economic impact of the virus and global stock markets are telling us loud and clear that the last few months lockdown was just a flash in the pan which will go down in history as one of the greatest buying opportunities in decades. The MSCI World Index is now only 7% from its all-time high while the US tech-based NASDAQ has already soared through its previous top dismissing the virus as irrelevant. The simple equation is the combination of massive Fiscal and Monetary stimulus which has been thrown at the virus induced global economic slowdown is outweighing the impact of the virus itself making the market appear cheap to many cashed up buyers.
Domestically we are already witnessing a rapid about face by Scott Morrisons Liberal Party as the Australian economy snaps back faster than many expected, yesterday we saw the announcement of free childcare coming to an end on July 12th and hints the JobKeeper will be pared back way faster than originally intended. The government will need to tread a very careful path because many industries are still struggling because of enforced shutdowns that the statistics suggest may not have even been required. My greatest fear is housing prices, our economy is built on this particular pack of cards and if interest rates start to tick higher it might increase the stress on many already struggling households.
MSCI World Index Chart
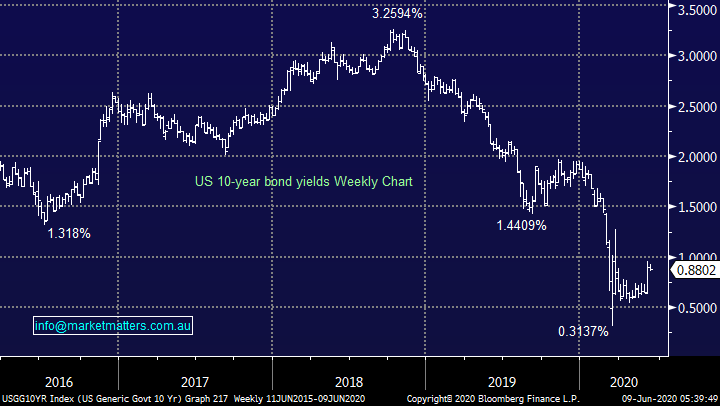
The surge higher by US 10-year bond yields illustrates the manner in which financial markets are dismissing the risks of a deep global recession – they have more than doubled from their panic March lows. As subscribers know we are bullish bond yields which will change the investment landscape of the last few decades which was founded on falling interest rates, we believe they’re now going higher e.g. good for Banks but bad for Healthcare & “Yield Play” Sectors.
MM continues to believe bond yields / interest rates are going higher.
US 10-year Bond Yields Chart
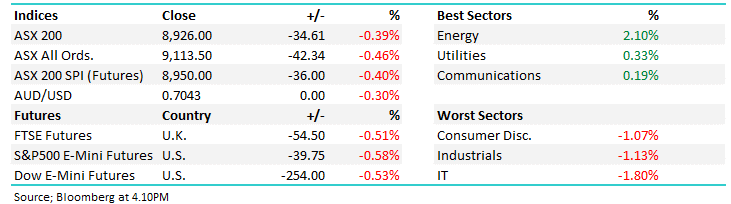
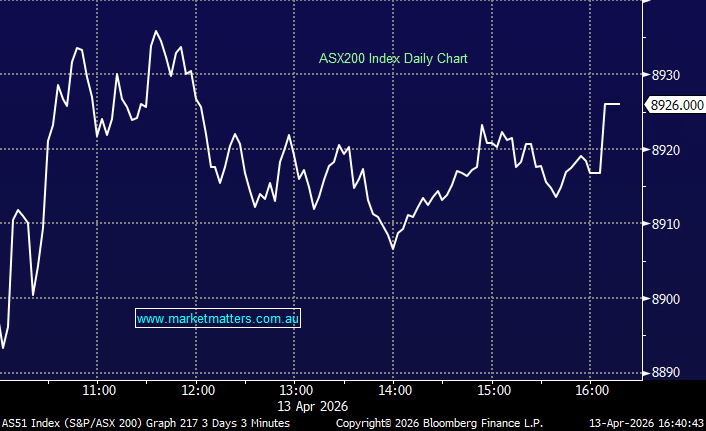
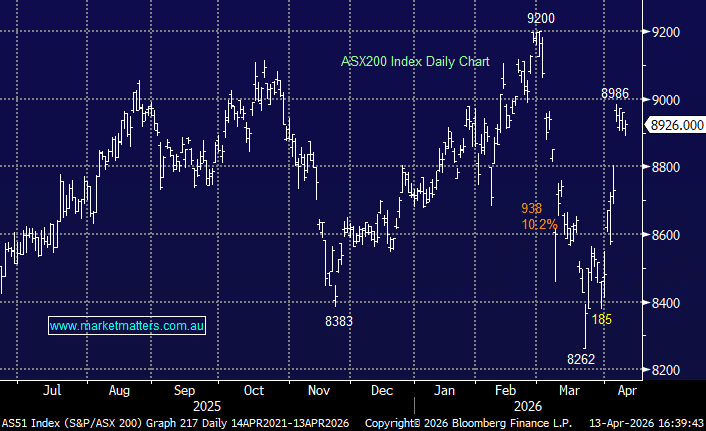
The ASX200 is set this morning to open up around 2%, above the next psychological barrier at 6100, BHP is posed to surge almost 3% implying locally that both the banks and resources will be driving the market higher. The markets spent most of May and early June between 5500 and 6000 and it would appear the next month is simply going to ratchet things up 500-points and 6000-6500 will become the new trading range.
MM remains bullish equities medium-term.
ASX200 Index Chart
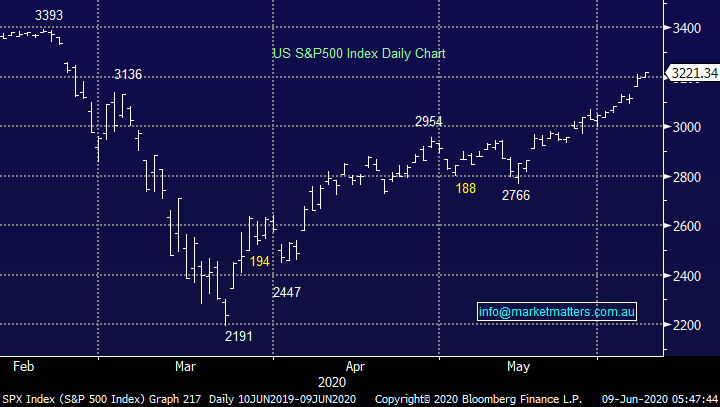
US stocks continue their dramatic recovery following better than expected employment data on Friday night, the numbers were out by a staggering ~10m jobs with an unemployment rate printing closer to 13% than the 20% expected. It feels like most major US indices will be at all-time highs in the coming weeks, hot on the heels of the tech based NASDAQ. Ironically improving economic conditions is likely to reduce the stimulus flow sooner rather than later but with fund managers still relatively cashed up pullbacks look destined to be very well supported i.e. in Mays Bank of America survey we saw cash levels sitting at 5.7%, well above the 10-year average of 4.7%.
MM’s remains bullish US stocks medium-term.
US S&P500Index Chart
Question 1
“Hi James, thanks for the assessment--enjoy your R&R--but don’t cross any borders!! Lol. I may be representative of a part of the herd --not so much wondering whether or not to chase the rally--but being far too clever during the run down--e.g. a “cheeky “ bid for WBC at 22.00 was filled--still well behind there--same with FLT--still 30% behind--MQG--minus 20%. So wondering whether to sit tight or wear the loss into cash and wait for the correction--but if it comes--will it be a small one or strong enough correction to justify cashing out now?? Waiting for the proven “first higher bottom” (the only way to trade long ) is a puzzle if one has bought somewhat impulsively as I did--nah let’s be honest trying to “pick a bottom”--which you would think after 30 something years of trading/investing (depending on the outcome lol) one would be immune to….but no ..human factors rule..In summary I’m guessing that my herd section is doing what I’m doing--nothing much and waiting..” - Thanks again, Cheers Paul A.
Morning Paul,
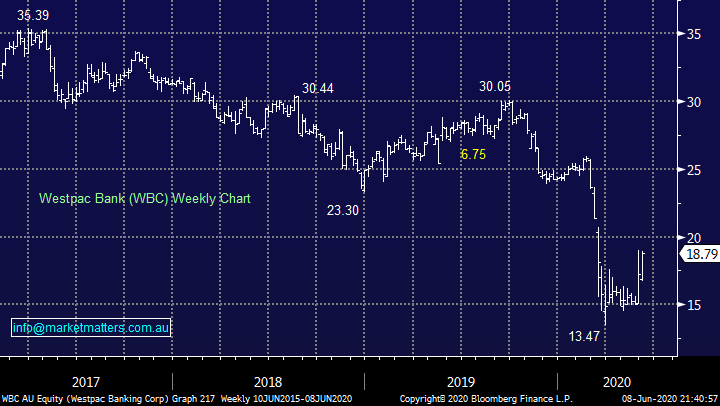
Rather than talk short-term noise lets simply consider where we believe stocks will travel over the next 12-18 months, MM remains bullish equities with an emphasis on the value end of the spectrum i.e. stocks that travel well when bond yields rally. Assuming we are correct the banking sector and with resources should perform admirably into 2021. Flight Centre (FLT) looks cheap but obviously its performance is dependent on how quickly things return to normal in the travel & tourism front. Our Growth Portfolio is holding 16.5% in cash which feels too high this morning, we are looking to increase our market exposure and I fear too many people are expecting “the inevitable second dip lower” whereas the path of most pain, which is so often trod, is arguably an ongoing rally.
MM likes the banking sector here
Westpac (WBC) Chart.
Question 2
“I cannot get IBD RS rating for Australia stocks, I know we can use index~asx200 as benchmark, and does trading view website give us a similar stock rating like IBD's RS rating? Any websites we can go to get Australia stock rising relative strength, not the common indicator RSI?” – Steve Y.
Morning Steve,
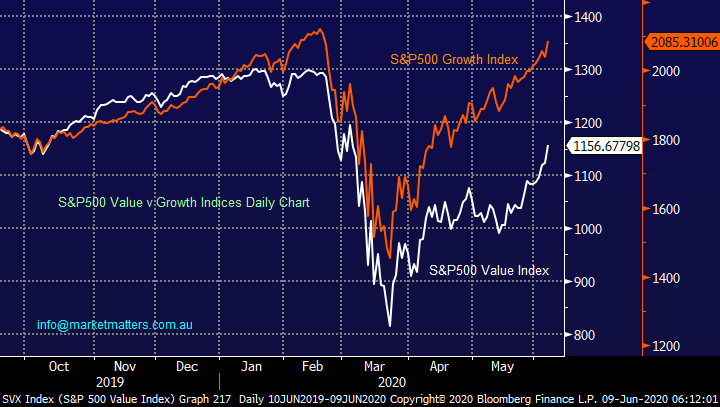
For those not familiar with this term “The RS Rating tracks a stock's share price performance over the last 52 weeks, and then compares the result to that of all other stocks. The rating shows clearly if the stock is a market leader or laggard in terms of price performance.”
I see your dilemma this indicator is far more readily available on US bourses, I believe its time to go “old fashioned” locally and do the calculations in house. We look at relative strength using a more general day to day approach such as value and growth indices shown below hence we do see the benefit of following these ratings but some work required, however its when you do work that nobody else does that the fruits are often best enjoyed.
The major advantage of buying stocks with a high rating is it avoids catching falling knives which may keep falling.
S&P500 Value & Growth Indices Chart
Question 3
“Could you pl advice on Macquarie bank capital notes which is trading around 102.65? Is it a buy?” - Thanks Priya W.
Hi Priya,
MBLPC was issued on a margin of 4.70% over bank bills, that margin is now 4.11% given the rally in price to close on Friday at $102.90. As a general rule we think ~4% over bank bills is cheap, and ~3% is expensive.
MM is still positive on the new Macquarie Hybrid
Question 4
“Hi James, thanks for the useful feedback. I bought Galaxy Resources (GXY) at $1.22 Is there any hope for a recovery in the next 12 months or should I cut my losses? Is the performance of GXY primarily about the price of lithium or are internal factors also at play?” - Regards Ram H.
Hi Ram,
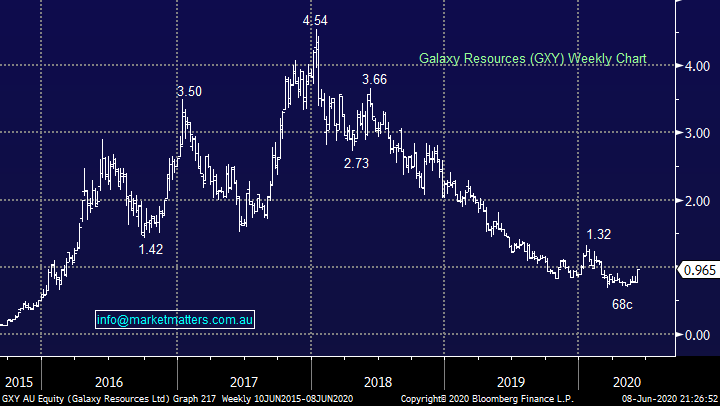
The lithium sector has been an absolute minefield over the last few years as investors became way too optimistic on the take up of electric vehicles (EV) while ignoring the increased production of lithium i.e. supply trumped demand. At MM we are happily on the sidelines with regard to this sector but the technicals suggest a bounce towards $1.30 is likely in the coming months.
MM is technically bullish GXY short-term.
Galaxy Resources (GXY) Chart
Question 5
“Hi James & the M. M. Team. Previously you’ve recommended GrainCorp (GNC) prior to the divestment of United Malt Group (UMG), it’s performance has been disappointing. What are your current thoughts on both companies for the short & medium terms. To Err is to be human, to be Smart is to subscribe to Market Matters!! Keep up the excellent Stock Market insights for a happy subscriber.” - Cheers, Martin B.
Hi Martin,
Thanks & wow, we’ve enjoyed some wonderful compliments at MM but that is truly the most eloquent, rings a bell somewhere!
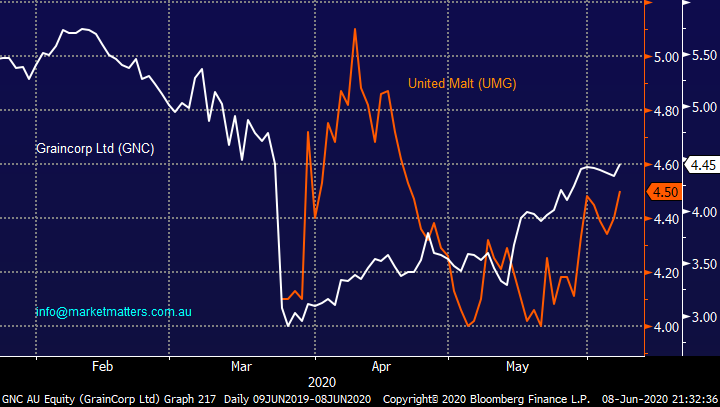
The goal with the demerger was to unlock value in the 2 respective Agri businesses or in layman’s terms get the share prices higher. UMG has become the world’s 4th largest independent maltster while grain business GNC should be well positioned moving forward due to food dependency becoming an ever-increasing issue. In the current economic environment, we see more exciting opportunities elsewhere.
MM is neutral both GNC and UMG.
GrainCorp (GNC) & United Malt (UMG) Chart
Question 6
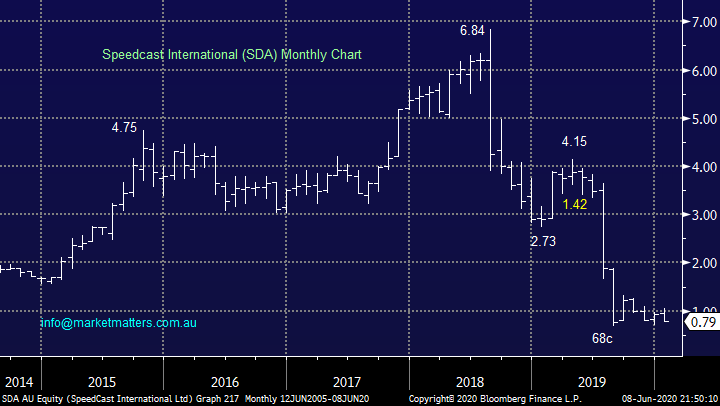
“Hi Gents, Keep up the great work, I am a holder of SpeedCast (SDA) and was wondering if you could shed some light on what’s happening with them and what the process is if they go completely under. It would be good to be able to right them off as a bad experience before the end of the financial year if possible.” - Cheers Burge.
Hi Burge,
Communications satellite technology provider SDA is unfortunately in suspense while it goes through a chapter 11, which is a voluntary restructuring process in the US, like bankruptcy in Australia however more companies come out the other side of Chapter 11. I’m not as familiar with Chapter 11 proceedings, however when a company in Australia goes into administration, shares cannot generally be written off until the business is wound up completely and the administrator writes to shareholders confirming this. I doubt this will be the case with SDA this month. As always, best to speak with your accountant about tax matters.
MM is obviously bearish SDA!!
SpeedCast International (SDA) Chart
Question 7
“Hi James & Team, I have been a fairly new subscriber to MM (about 1 year ) and really enjoy the market insights provided by you and the team. Keep up the excellent work. I have a few questions:
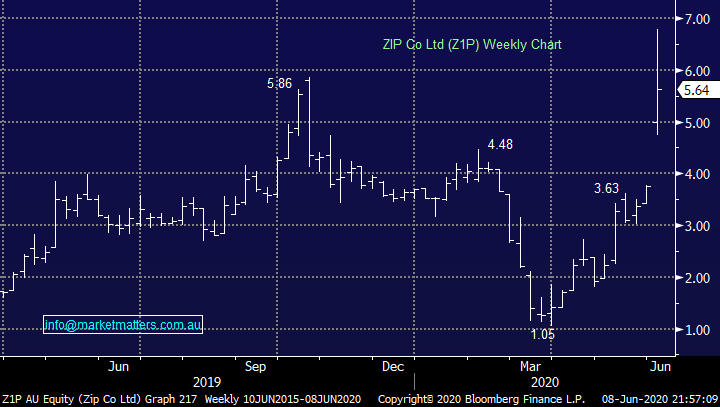
1) ZIPCO: Is the current valuation of ZIPCO at about $5.55 cheap and is there room for growth for this stock. I own shares before the spike and was considering my next move.
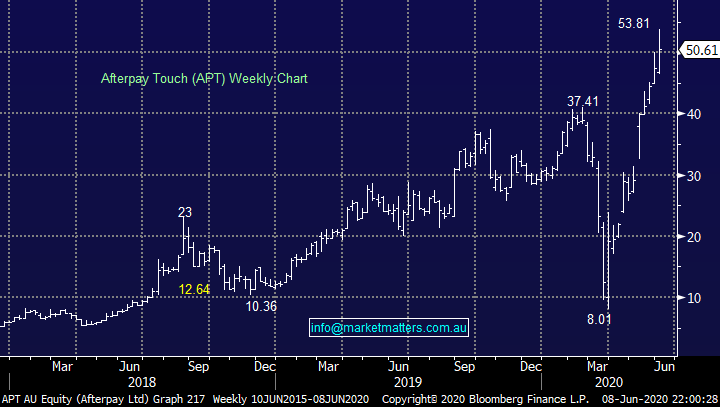
2) APT / XERO: These two stocks had a fantastic run and was a bit disappointed that MM did not initiate a buy alert/recommendation much sooner in March when the markets tanked. I remember that MM did eventually make a recommendation at a later time for XERO but at a much higher price. Any suggestions going forward.
Thanks, and regards” – Manjit S
Hi Manjit,
Thanks for the vote of confidence and straightforward poignant questions, much appreciated:
1 – ZIPCO (Z1P) completed the $403m acquisition of US business QuadPay last week as it tries to emulate Afterpay’s success in the US. We had the management team present to us on Friday and the growth runway is clearly compelling in the years ahead. The deal they did last week was clearly well received, the fact they issued a convertible note to an investor with deep pockets was taken very well.
We like the company, however in the short term, the stock has run extremely hard and we are not buyers at current levels.
MM is neutral Z1P
ZIP Co. Ltd (Z1P) Chart
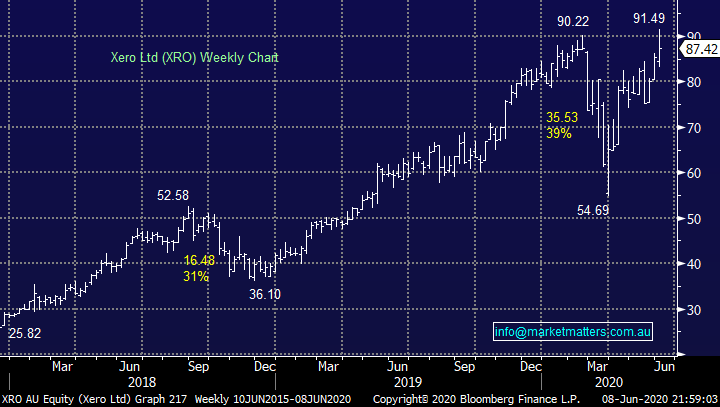
2 – Xero (XRO) remains a solid performer in the MM Growth Portfolio and although its hit our target above $91 we are giving the position / company the opportunity to keep performing i.e. “run your profits and cut your losses”. Risk / reward we wouldn’t be aggressively chasing at current levels, but MM continues to like the business.
We bought our first tranche at $66.49 then 2nd at $76.97 giving us a big overweight on the stock.
Obviously like yourself in hindsight we wish MM had pressed the “buy button” sooner when the stock plunged below $60 but it’s impossible to buy everything at the lows, we adopted an accumulation into weakness attitude which we believe makes more sense in chaotic markets like March.
MM is comfortable with our XRO holding.
Xero (XRO) Chart
Afterpay Touch (APT) Chart
Question 8
“Hi James Thank you for sharing your views on the markets. What’s your opinion on Iress in the next 1-2 year please? Do you think this latest acquisition (Quanthouse & Ovh) are beneficial to the shareholders? Ovh make up only approx 14% of iress’s total asset base. Is the SPP attractive to you on a risk/reward basis?” - Regards Richard H
.Morning Richard,
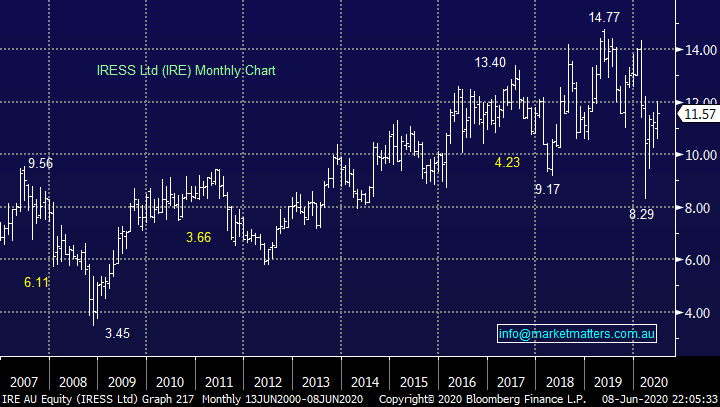
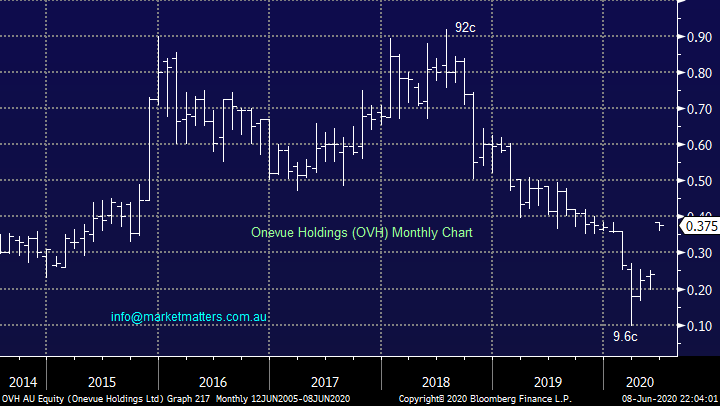
IRE have a solid footing in the local broker community however there is a growing trend towards wealth management over and above transactional services which is why they’ve made a move on OVH, an investment platform provider that charges a fee based on assets under management
The capital raise to fund the acquisition is at $10.42 which looks great value compared to the current price and I think the move by IRE makes total sense.
MM likes IRE’s SPP offer at $10.42
IRESS Ltd (IRE) Chart
Onevue Holdings (OVH) Chart
Question 9
“Hi guys, I have been invested in the AUDS ETF since mid-January this year and mystified by its performance recently. The AUD/USD is back to where it was when I purchased but the ETF is still 8.5% down. Is this something to do with the 2x leverage in the ETF or some sort of time based decay due to futures / options or some other hidden (to me) reason?” - Thanks and regards Craig D.
Hi Craig,
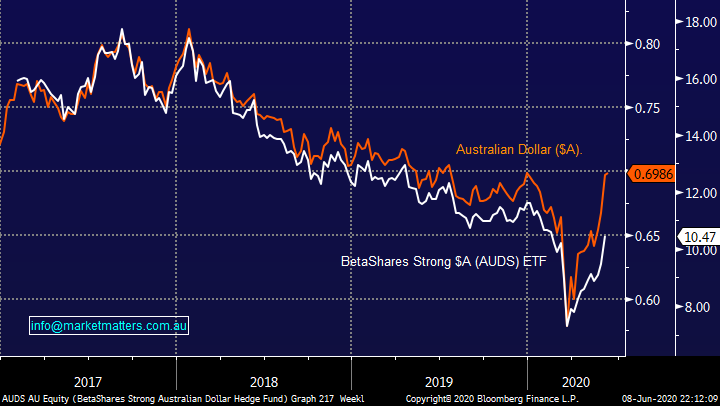
The ETF will have trailed on performance slightly because interest rates in the US have been higher but as you can see below not to any great degree, I believe once the AUDS ETF starts trading this morning after the long weekend you will be far happier with your position.
MM remains bullish the $A initially targeting the 80c region.
AUDS ETF v $A Chart
Question 10
“Hi James & Team, would you please advise your view on the following:
1) The rationale to buy VALE SA when COVID-19 is rampant in Brazil. Is it like buying straw hats in winter?
2) 5G NETWORK 5GN
3) ELO
4) EOs
5) GOLD ETF & ETPMAG”
Many Thanks, Sidney H.
Hi Sidney,
Lots of questions hence very brief replies:
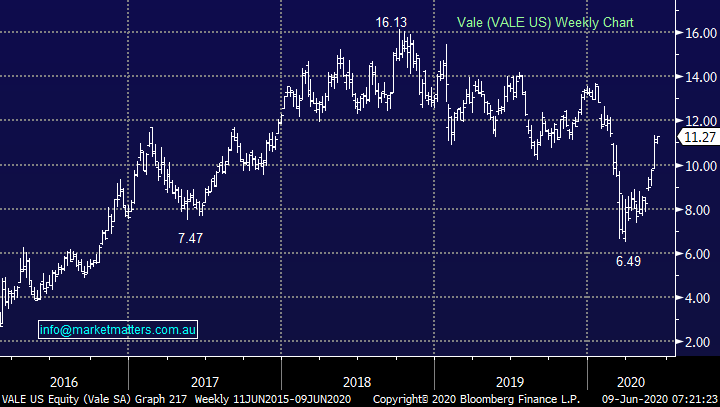
1 – exactly as you say buy things when the news looks awful often pays dividends, we believe it will in the case of Vale where MM likes the iron ore sector moving forward and global equities have recovered in dramatic fashion post COVID-19. We expect Vale to follow suit despite their current production issues
2 – 5G should benefit Telstra (TLS) but no signs yet.
3 – MM is neutral Elmo Software (ELO) around the current $6.50 area.
4 – EO’s, I assume you mean EOS, Electric Optic Systems, looks okay technically however we I don’t know enough about this from a business perspective.
5 – we believe gold ETF’s can see some profit taking as bond yields rally but we will be looking out for buying opportunities if / when inflation does raise its head.
Vale (VALE US) Chart
Question 11
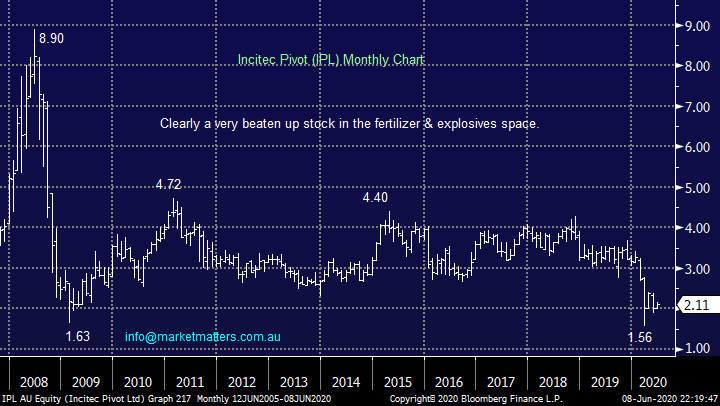
“What is your recommendation on the current SPP offer For IPL which close 5pm EST tomorrow night Tuesday 9/6/20” – Albert M.
Hi Albert,
Explosives and chemicals business IPL are raising up to $75m through an SPP at $2 after successfully raising $600m in an institutional raise to strengthen its balance sheet, not particularly attractive in our opinion.
MM is neutral IPL.
Incitec Pivot (IPL) Chart
Question 12
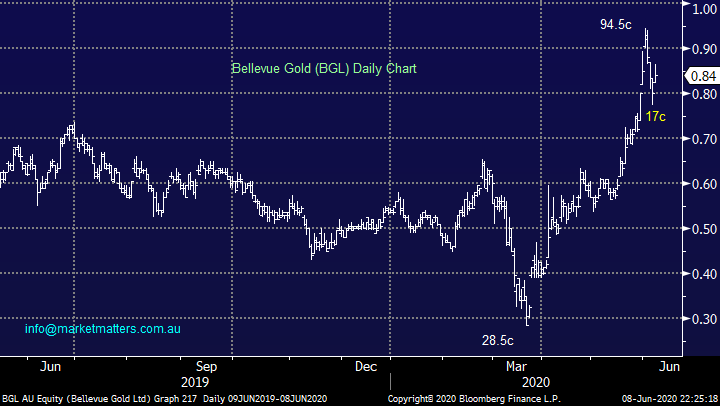
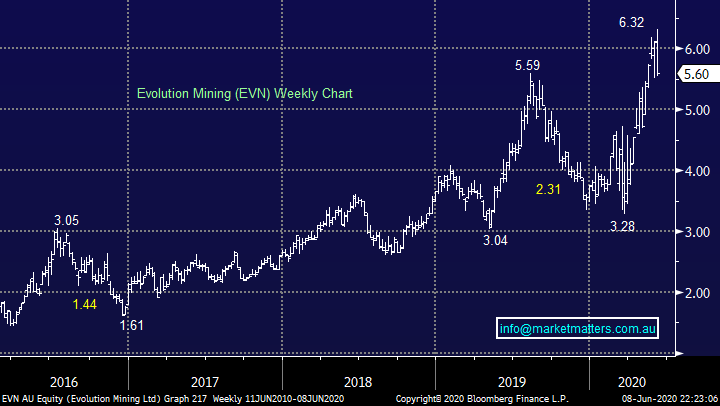
“James and team - I would be interested in your opinion on a couple of gold companies that I have been looking at. BGL - on 27/5 released a report on drilling activities which is showing very high grades. Share price since then has kicked up although the price was showing significant kick since mid-March DCN - price tanked from end January and going through a recapitalisation to raise $98m. Company is mining and has a processing plant. Grades are reasonable and hasp in place a three year business plan EVN - Has been operating profitably for many years and paying dividends. Share price just below all-time highs ($5.60 as at 5/6) Interested in your opinion on each in terms of short and mid-term capital growth.” - Thanks Colin H.
Morning Colin,
Gold is bouncing around the $US1700/oz area with a number of different fundamental influences pushing and pulling the precious metal around, we feel after its strong advance the risk / reward is not particularly attractive at current levels as bond yields increase. However in the bigger picture we like gold implying as is often the case its all a matter of timing.
1 – Short-term we can see BGL rotating between 75c and $1, medium-term I would be using stops under 60c.
2 – DCN looks average in the space and we would avoid compared to its peers.
3 – EVN looks good medium-term although another sharp correction under $5 should not be discounted hence technically we would advocate accumulating into weakness.
MM likes both gold plays but at lower levels.
Bellevue Gold (BGL) Chart
Evolution Mining (EVN) Chart
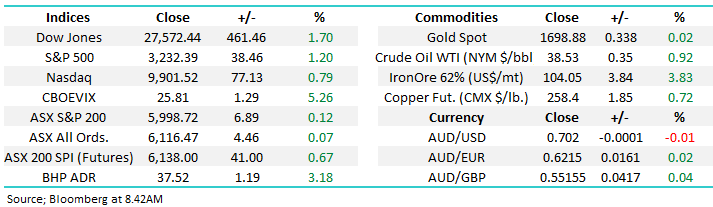
Overnight Market Matters Wrap
- The US equity markets welcomed the ‘reopening’ of its economy + a better than expected jobs report and rallies strongly
- The buying that came in late in the session was following the US Fed’s announcement of its Main Street Lending Program which provides further stimulus to the US economy
- On the energy front, BHP is expected to outperform the broader market after ending its US session up an equivalent of 3.18% from Australia’s previous close.
- The June SPI Futures is indicating the ASX 200 to catch up from missing a session yesterday and open 140 points higher, testing the 6140 level this morning.
Have a great day!
James & the Market Matters Team
Disclosure
Market Matters may hold stocks mentioned in this report. Subscribers can view a full list of holdings on the website by clicking here. Positions are updated each Friday, or after the session when positions are traded.
Disclaimer
All figures contained from sources believed to be accurate. All prices stated are based on the last close price at the time of writing unless otherwise noted. Market Matters does not make any representation of warranty as to the accuracy of the figures or prices and disclaims any liability resulting from any inaccuracy.
Reports and other documents published on this website and email (‘Reports’) are authored by Market Matters and the reports represent the views of Market Matters. The Market Matters Report is based on technical analysis of companies, commodities and the market in general. Technical analysis focuses on interpreting charts and other data to determine what the market sentiment about a particular financial product is, or will be. Unlike fundamental analysis, it does not involve a detailed review of the company’s financial position.
The Reports contain general, as opposed to personal, advice. That means they are prepared for multiple distributions without consideration of your investment objectives, financial situation and needs (‘Personal Circumstances’). Accordingly, any advice given is not a recommendation that a particular course of action is suitable for you and the advice is therefore not to be acted on as investment advice. You must assess whether or not any advice is appropriate for your Personal Circumstances before making any investment decisions. You can either make this assessment yourself, or if you require a personal recommendation, you can seek the assistance of a financial advisor. Market Matters or its author(s) accepts no responsibility for any losses or damages resulting from decisions made from or because of information within this publication. Investing and trading in financial products are always risky, so you should do your own research before buying or selling a financial product.
The Reports are published by Market Matters in good faith based on the facts known to it at the time of their preparation and do not purport to contain all relevant information with respect to the financial products to which they relate. Although the Reports are based on information obtained from sources believed to be reliable, Market Matters does not make any representation or warranty that they are accurate, complete or up to date and Market Matters accepts no obligation to correct or update the information or opinions in the Reports. Market Matters may publish content sourced from external content providers.
If you rely on a Report, you do so at your own risk. Past performance is not an indication of future performance. Any projections are estimates only and may not be realised in the future. Except to the extent that liability under any law cannot be excluded, Market Matters disclaims liability for all loss or damage arising as a result of any opinion, advice, recommendation, representation or information expressly or impliedly published in or in relation to this report notwithstanding any error or omission including negligence.