Subscribers questions (TSLA US, NWH, STO, IFT NZ, OZL, APT, QAN, NXT, Z1P, IGL, BIN, TYR, SSM, WOR, IVC, MAQ, SGP)
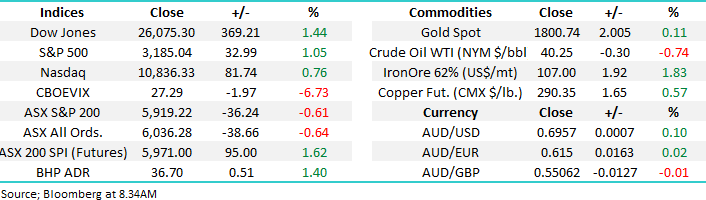
The ASX200 is poised to open up around 100-points this morning assuming it interprets this weekend’s coronavirus statistics as basically in-line with expectations. We believe equities are pretty much following our play book in that they “want to go up” under the impetus of ongoing huge central bank liquidity but the virus remains the potential “spider in the inkwell” with the eyes of stocks firmly fixed on the potential ongoing / future economic impact. The virus news over the weekend has not evolved dramatically but it remains understandably concerning to many:
1 – Sydney / NSW is struggling to stem a secondary outbreak with a pub in Casula the current hotspot. One thing appears 100% apparent, if you let people into your state / country from other highly infected areas it’s almost impossible to contain COVID-19.
2 – Florida has just reported more than 15,000 cases in one day, Australia only had 279 in total yesterday. The key for stocks is the US are appearing to be learning to live with COVID-19 and accept the consequences e.g. Disneyland remains open.
If the US under Trumps leadership is going to continue walking this ruthless path their economy is likely to recover but a large number of elderly Americans will suffer accordingly, good for stocks but not necessarily mankind. Basically the US is currently handling the pandemic like a severe flu where the 3.2 million people who have tested positive assumed that they won’t again catch the virus while the almost 135,000 deaths are acceptable – survival of the fittest on a horrendous grand scale. With an election looming in November it’s hard to imagine Trump changing his almost Sweden like “herd immunity” stance towards the virus, anything to keep the economy humming.
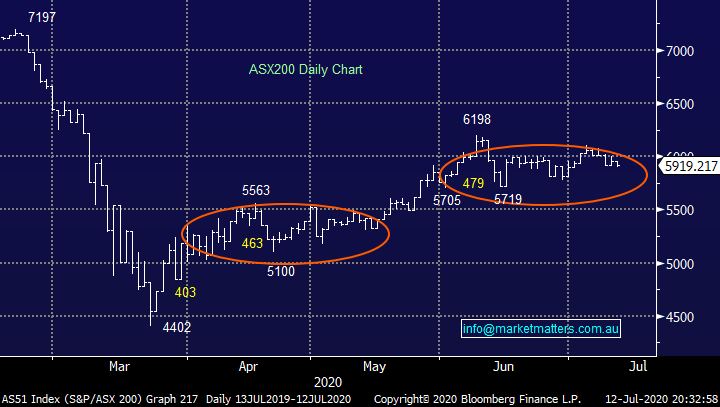
Another fascinating day / week lies ahead, we are still anticipating a pop above 6200 in the coming weeks but we must remain cognisant of underlying risks mounting almost daily.
MM remains bullish Australian stocks medium-term.
ASX200 Index Chart
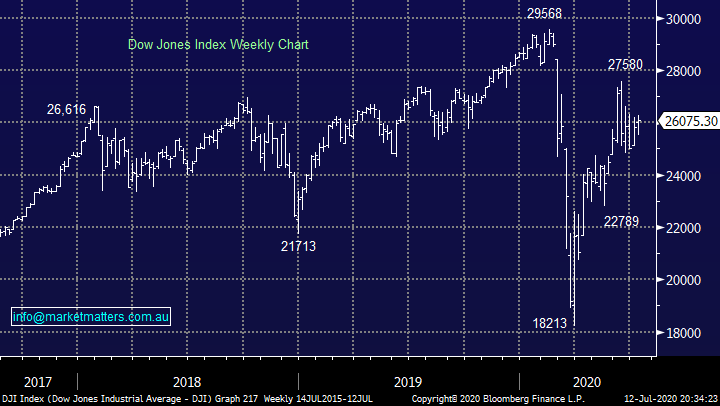
On Friday night the Dow gained 369-points but unlike the tech-based NASDAQ it remains almost 6% below its post virus swing high posted a month ago, a very similar picture to the local ASX. We remain overall bullish US stocks but as we’ve expected since the virus outbreak there will be plenty of bumps in this news driven road.
MM remains bullish US stocks initially looking for additional 6-8% gains.
Dow Jones Index Chart
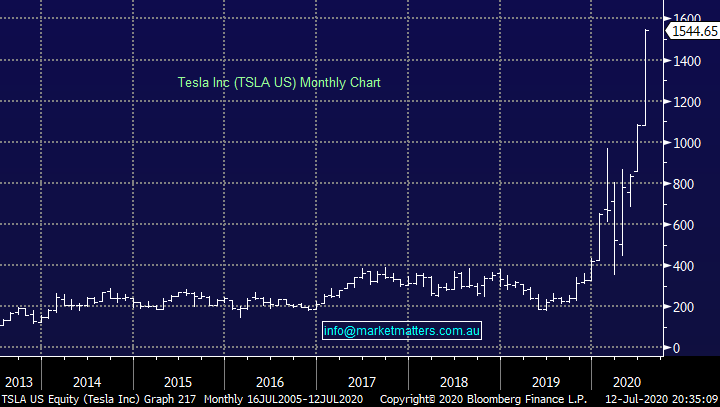
The papers are currently revelling in the news that Tesla’s Elon Musk is now worth more than Warren Buffet while this is undoubtedly a sign of the times it doesn’t suit the story to labour the point that the famous value investor has now given away to charity approaching $US40bn, more than half of the Tesla’s CEO’s fortune. However, a couple of points did catch my attention following TSLA’s 11% surge on Friday night.
1 – While TSLA has a whopping $US20bn short position it’s hard not to imagine further squeezes higher.
2 – as we often say whether it’s a bubble or a huge short squeeze they usually go much further / longer than many expect.
3 – We are in a new age market which is illustrated by the performance of the FANG stocks in 2020 but things do usually get volatile along these journeys and believers in the likes of Tesla need to understand the likely volatility moving forward.
Technically MM likes TSLA medium-term.
Tesla Inc (TSLA US) Chart
An encouraging strong number of questions this week with a variety of topics, we are lucky to have such an engaged subscriber base.
Question 1
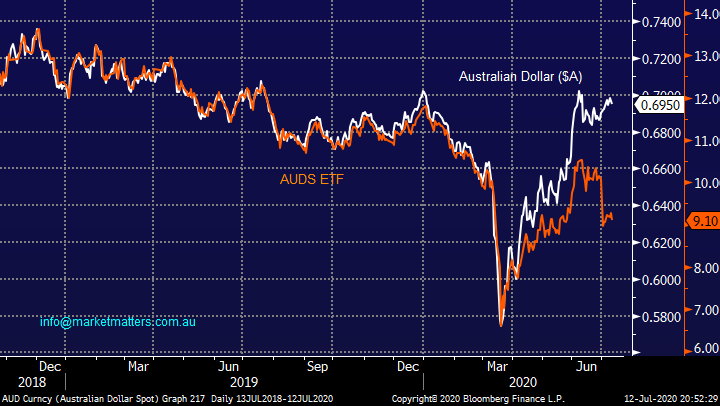
“Good Morning, I enjoy the commentary and it has certainly been educational on how the market works. My question relates to AUDS. I agreed with your views on the AUD a year ago and purchased AUDS on the ASX. The dollar went down during that period (who could have predicted COVID) but has since recovered and it seems your predictions are directionally correct My question relates to the ETF itself. I purchased on 15 July 2019 for $12.16. The AUD was 0.70175 vs the USD on that day. Today 8 July 2020 the AUD is 0.69327, down 1% on a year ago. The ETF is actually down a net 14.93% over the same period (24.45% down on capital with a 9.52% dividend). Why does the ETF not reflect the movement in the dollar? I understand it is geared but that doesn't account for the huge discrepancy.” - Guy P.
Morning Guy,
The AUDS has certainly lagged the $A as can be seen below, frustrating for both you and MM. There are a number of factors at play here, a couple of which you mentioned:
1 – The current gearing on the ETF is 2.57x with BetaShares aiming to maintain it between 2 and 2.75x.
2 – BetaShares management cost is 1.38% p.a.
3 – The current yield paid annually of 12.74% unfranked obviously clips the wings of the ETF price.
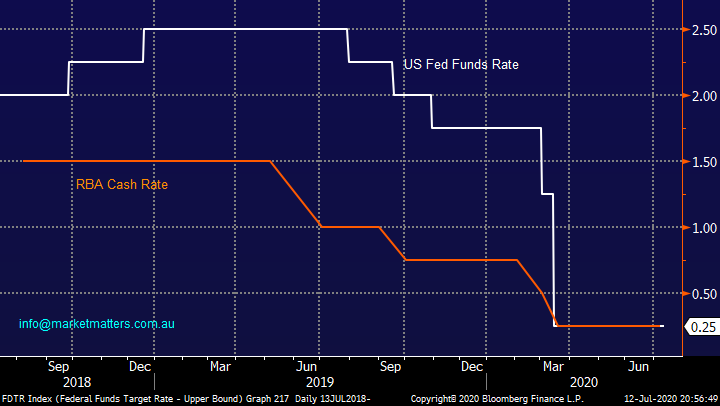
4 – The “cost of carry” has been against us for most of the last few years with US interest rates above our own prior to COVID-19 which creates a slow but steady headwind for the ETF – see second chart below.
Bring these all together and the ETF lags but if we are correct the position will still bear fruit over the next 12-months.
MM remains bullish both the $A and AUDS.
The $A & AUDS ETF Chart.
RBA & US FED Cash Rate Chart.
Question 2
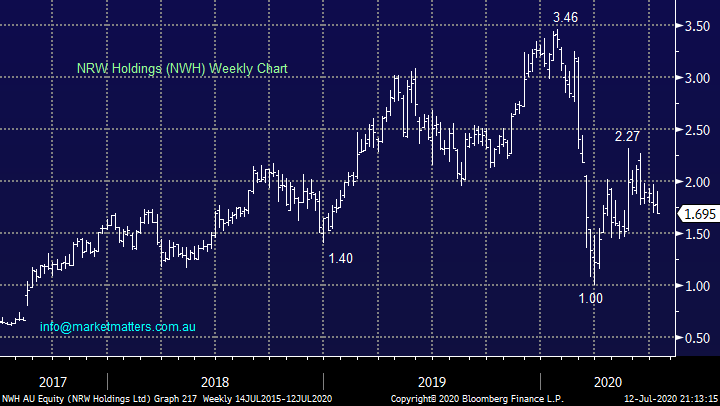
“Hi James & Team, wanted to know your thoughts on NWH and STO please in the short-term. Many thanks for your informative reports.” - regards B & P.
“Hi James & Team, I'd appreciate your thoughts on NWH. Their recent update was positive (even the market took notice "on the day"), the resource sector looks positive (Cu, Ni, Al, Fe, etc.). So, why is the market not showing the love?” - Thanks, Jan P.
Morning Guys,
One stock we hold in the MM Growth Portfolio and one we have been positive on over recent months, neither of which have recently been going according to plan.
1 NRW Holdings (NWH) – this mining and civil construction services business has been moving like a magnified COVID-19 barometer, a little unfair in our opinion. We continue to like this mining services business and feel the reintroduction of its previously deferred dividend echoes that management are also comfortable. Short-term its 50-50 clearly being in the doghouse but when it turns, we believe it will rally hard i.e. one to accumulate into weakness.
MM remains bullish NWH.
NRW Holdings (NWH) Chart
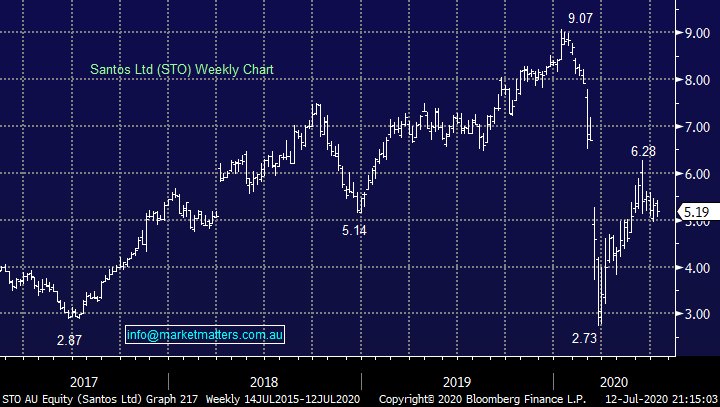
2 Santos (STO) – leveraged oil play STO has struggled in very similar manner to NWH but with crude oil up over 2% on Friday it should enjoy a better showing today. In hindsight it got a bit ahead of itself last month, but we still see 20-25% upside from current levels and would also advocate accumulating into current weakness.
MM is bullish STO.
Santos (STO) Chart
Question 3
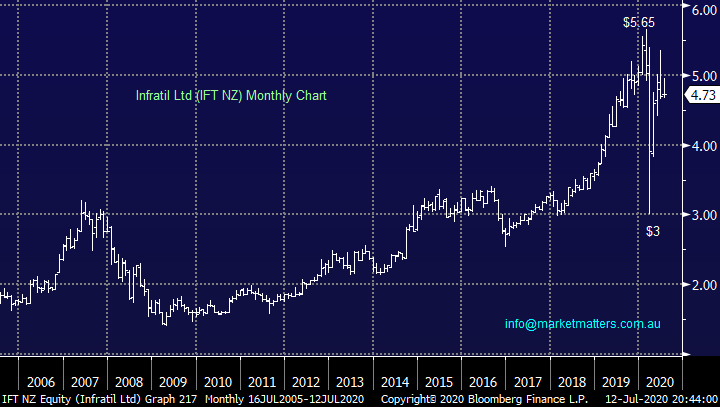
“Hi James and team. Thanks for your excellent work and analysis of the market. Appreciate it very much. Can you please, comment on a New Zealand Company code IFT-NZ. I think the company’s name is Infratil Limited. I believe it has good quality assets, sort of Infrastructure Sector assets. Appreciate your view on this company whether it is a Buy at current prices or not worth looking into.” – Thanks, Shernavaz C.
Hi Shernavaz,
Thanks for the appreciated feedback and rare question towards NZ. Infratil (IFT NZ) is an infrastructure investment company which while not cheap has a solid track record plus a healthy projected 3.65% yield. Amongst its assets is over 65% of Wellington Airport, commercial real estate and a data centre business. The current entry level is not particularly exciting compared to March but another 20% upside in the next 1-2 years looks likely which is attractive.
MM is bullish IFT medium-term.
Infratil Ltd (IFT NZ) Chart
Question 4
“Hello James and Team, I’ve set this up on a silver platter, but I’m genuinely interested to hear your sales pitch. What are the pros and cons of people shifting from active investing themselves, to outsourcing their wealth management to a fund manager?” - Regards, Alan P.
Thanks, Alan, for the slower ball, let’s see if I can find the middle of the bat!
The simple premise when considering professional management is that you get more than you pay for. i.e. if you pay 1.2% pa to have your portfolio professionally managed, the manager is adding more than that, either in terms of performance, risk management, reporting, hassle reduction like taking care of all paperwork or simply freeing up your time to do other things. Generally, the combination of the above is what entices people to invest through our Managed Accounts (either through me and my team at Shaw and Partners or through the Market Matters SMA’s)
I’m clearly biased however I think what we offer is unique. It combines the ease of investing through a managed fund with the benefits of holding assets directly. When combined with daily notes through Market Matters, clients in our managed accounts are up to speed on our thoughts and positioning, have a professionally, actively managed portfolio of Australian and international shares (and other securities if relevant) receive regular consolidated and comprehensive reporting while having direct access to the person / team managing their investments. It’s easy, it’s direct & it’s transparent. We have clients ranging from corporates to great Australian charities, SMSF investors, to younger families growing a portfolio to fund their kid’s education.
Question 5
“I see in an earlier note today a reference to including some educational tips. Great idea. Perhaps you might include some information in the ASX pre-open phase. I have done some reading on it but still find it difficult to get my mind around the mechanism of operation. Your comments on how it can be utilised would be useful.” - Thanks Colin H
Hi Colin,
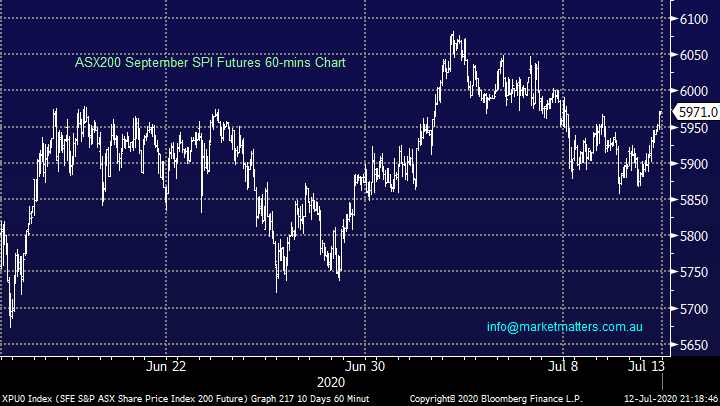
The pre-open is usually referred to as the “match” and simply allows investors to enters buys (bids) / sells (offers) into the market after 7am before stocks start trading e.g. those beginning with A & B at 10am, C to F at 10.02.15 etc. The weight of buyers and sellers matches off and we get an opening price calculated by the ASX’s computer algorithm, it produces an official auction price where the respective stocks start trading which in turn reflects the balance of bids / offers by volume.
The SPI Futures start trading at 9.50am and at times they move aggressively before the underlying stocks open which leads to stacking of either the bid or offer by the arbitrage systems which can cause an open price in equities which surprises people who don’t keep an eye on the SPI.
ASX 200 Sept SPI Futures “all-day” Chart
Question 6
“Hi Market Matters. Thank you for the awesome service!!
1. Is Market Matters favourable on Aussie Broadband IPO?
2. Are Market Matters members able to provide a bid into the IPO book? Subject to a minimum demand level?
Best Regards” - Matt C
Hi Matt,
Shaw and Partners is listing this stock later in the year via an IPO. More details to come when they are made available. MM subscribers have two options here. Apply directly through the prospectus when it is issued, or if you have a Shaw and Partners Account you will be able to bid into the bookbuild when it happens. If you’d like to open an account, we can arrange. [email protected]
I’ve heard good things about Aussie Broadband with decent demand seen in the pre-IPO raise of $25m.
Question 7
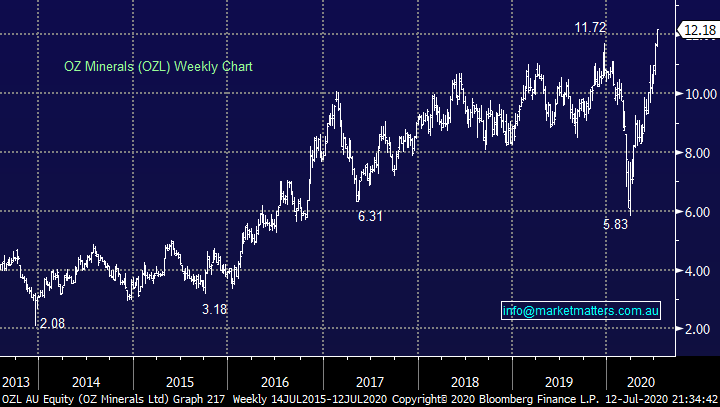
“Hi James and Team, I’ve just been doing some reading of the GS report available on Commsec re the Aust Metals and Mining Report. I’ve highlighted the OZL data from their current report, published 8 July, pg 8. You have mentioned that you’re bullish OZL in the meantime. The report below has a threefold increase in the EPS in the next 12 months, and 4x over the next two years. How much do you think this is already factored into the share price? At the moment they are trading almost 50x P/E if I have done my sums right, is that because of the forward earnings estimates? You’ve highlighted OZL as a potential sell in the short term if it pops a little, but why not leave it run for another 12-24 months? I know that might be asking more than you’re willing to share and I respect that you need to keep some of your secret recipe in the family. Looking forward to your thoughts, “- Regards, Alan P.
Hi Alan,
Great timing on this question as we have evolved the MM opinion on OZL over recent weeks, 10-days ago we wrote the below and we now have no plans to cut our OZL position, remember MM is always a flexible investor:
“Our position in OZ Minerals (OZL) still appears on point as the stock looks poised to make fresh decade highs in the near future. As the chart below illustrates OZL doesn’t appear to be getting too far ahead of itself when compared to the base metal – its primary source of revenue. MM remains bullish copper into 2021.”
MM remains comfortably bullish and long OZL.
In terms of the earnings profile, the rise in EPS is currently baked into the share price (this is the consensus view, not just GS). The upside comes from higher commodity prices which have not yet filtered into the consensus EPS expectations. In terms of broker coverage, OZL is well covered with 15 buys, 3 holds, 1 sell. Goldman is the 4th rated analyst on the stock, Morgan Stanley is No 1 on OZ.
OZ Minerals (OZL) Chart
Question 8
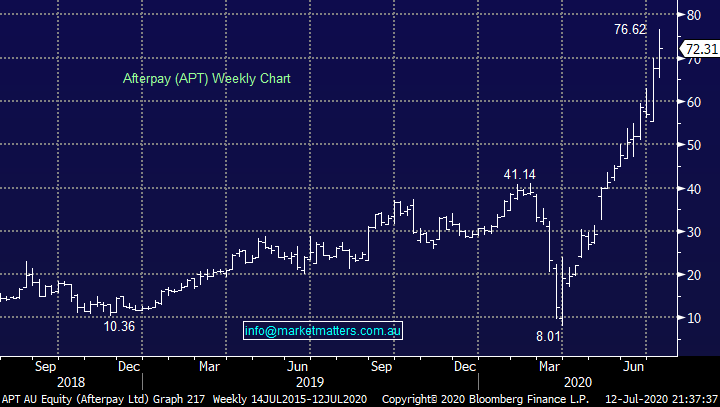
“Hi MM, Something for Monday - Can you explain the retail placement offer for Afterpay. Please also advice your view thus far with your price target. And love your insight, thumbs up.” -Jacky.
Hi Jacky,
As part of the $800m in fresh equity issued by APT, $150m is available to retail investors through a Share Purchase Plan (SPP). Holders on the register at 6th July (before the stock went into a trading halt) have the option to bid for up to $20,000 worth of shares at $66.00, or if the average price of APT is below $66.00 in the 5 days leading up to the close of the SPP, that’s the price that you’ll pay (5 day volume weighted average price VWAP). Normally they’ll be a discount to that VWAP price however not the case here. The timetable for the SPP will be released shortly.
$850m was raised in the institutional component which included $600m of new equity plus $250m from the founders selling down. That stock can be traded today so there’s a good chance APT will underperform the other BNPL stocks given the current 10% premium to the issue price.
MM would wait until near the close of the SPP and make a call then, a 5-10% discount is enticing.
Afterpay (APT) Chart
Question 9
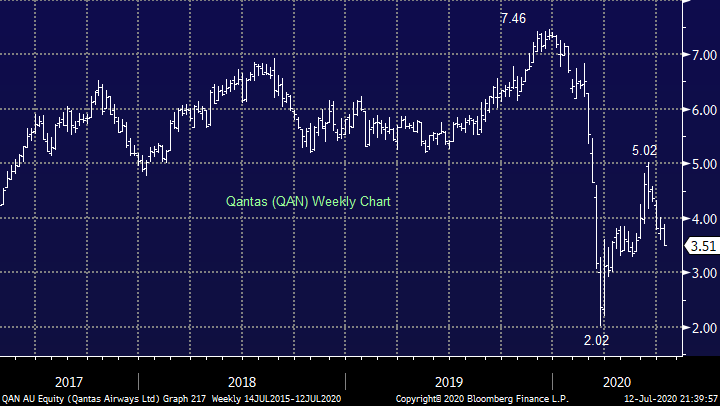
“Hi there, Just wondering what your thoughts are on the QAN share purchase plan? do you think it is worth investing in? and do you think this decision from QAN will downgrade their value? what does the future of QAN look like?” - Thanks Nick S
Hi Nick,
Qantas Airways (QAN) is in a similar position to Sydney Airports (SYD) which we discussed on in the Weekend Report, we simply feel it’s going to be a tough long road to recovery through COVID-19. In June QAN was offered a whopping $1.86bn worth of shares at $3.65 which is now already underwater, at MM we have no interest in Qantas. If the world gets on top of COVID-19, or finds a vaccine, the stock will undoubtedly recover strongly but we see better risk / reward for such an event elsewhere.
MM is neutral QAN.
Qantas (QAN) Chart
Question 10
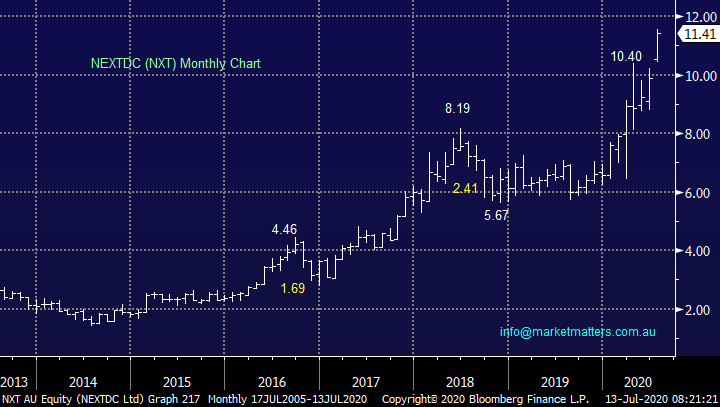
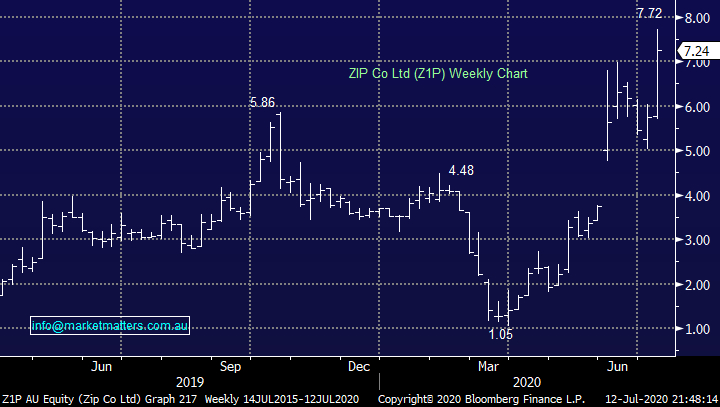
Hi MM Team, just your thoughts on NXT?? Also, when you do your technical analysis work do you pay any attention on weekly / monthly bar charts to gaps between the bars as there are several stocks that have in the past several stocks that have in the past several months e.g. BHP, FMG, Z1P, thanks and keep up the good work” – Tim C.
Hi Tim,
No change with our NXT view, we are bullish and stops for the aggressive or nervous players can now be raised to $10.25.
MM remains bullish NXT.
NEXTDC (NXT) Chart
With regards to the chart “gaps” like that illustrated below by Z1P the answer is not particularly, we pay far more attention to the reasons behind the gaps etc or in other words we believe it’s a time to focus almost entirely on fundamentals when large “news driven” gaps occur.
ZIP Co Ltd (Z1P) Chart
Question 11
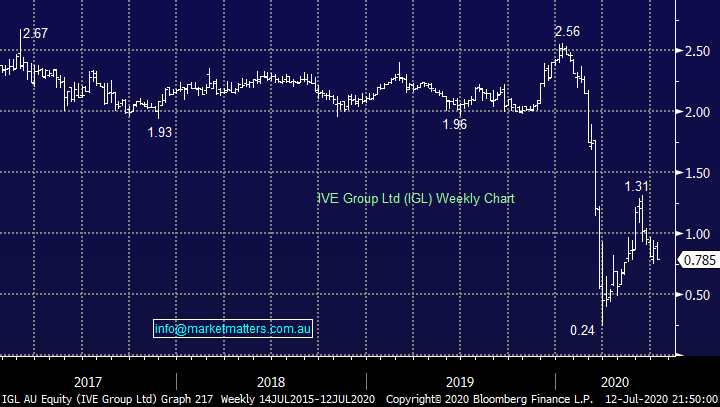
“Hi James, I would appreciate your updated thoughts on IVE Group -IGL , I am looking at averaging down and is Bingo Industries -BIN , under $2.00 a good buy ? Risk/Reward.” - Cheers Burge.
Hi Burge,
These are 2 companies they may raise capital moving forward, especially if we see a secondary aggressive lock down in Australia.
1 – IVE Group (IGL) - MM owns IVE Group (IGL) in our Income Portfolio and this advertising and marketing business is clearly a play on the domestic economic recovery, undoubtedly at some stage a great stock for the aggressive player but we are neutral at present.
MM is neutral IGL.
IVE Group Ltd (IGL) Chart
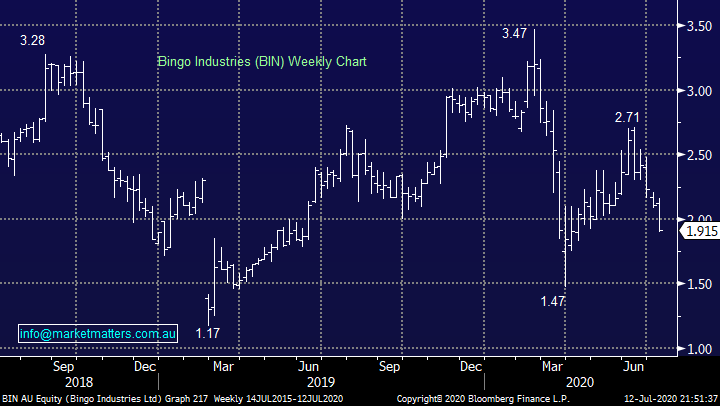
2 Bingo Industries (BIN) - MM owns BIN in our Growth Portfolio and while we have contemplated averaging this waste & recycling business we feel the virus / capital raise risks makes it more prudent to stay as we are, at least for now.
MM still likes BIN but short-term its tricky.
Bingo Industries (BIN) Chart
Question 12
“James If you get a chance could you advise what you think may be a suitable buy in and target price for TYR. I know you covered it Monday and rejected it at current levels but coincidentally it was covered in the Livewire Buy Hold Sell today ( Friday ) with both brokers recommending it as a buy however neither party gave an indication of a suitable buy in price. (they never do !). I don’t know when their video discussion is recorded so couldn’t make a determination against the current chart data. It’s clearly moving in an upward direction (not always the best time to buy) but given the Livewire brokers enthusiasm I thought it may be worth putting it on my watch list. As always look forward to your views on buy in amount and TP” - Cheers Mike D.
Hi Mike,
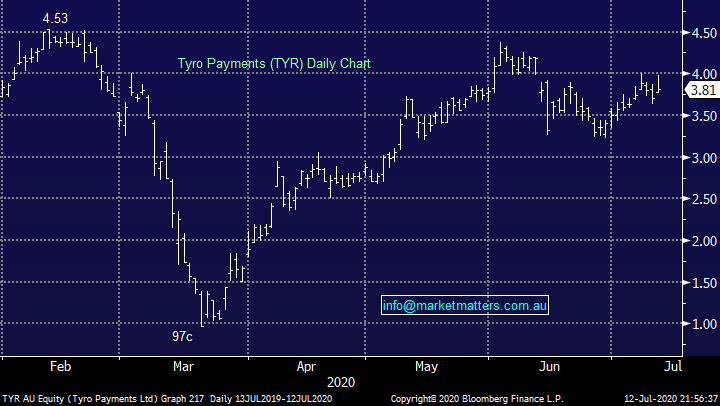
As you’ve rightly suggested we’ve been writing about Tyro Payments (TYR) each Monday afternoon as they’ve been providing a handy weekly snapshot of their transaction volumes during COVID-19. TYR are the fastest growing payment terminal provider in Australia so they’re in a good position to provide insight into offline payments. Last week we highlighted the plateauing of growth in transaction volumes and suggested the stock had run hard. They’ve just released their numbers this morning and transaction volumes are down on the week it seems (I’ve only had a very quick read).
MM are bullish TYR medium term targeting ~$5. Short term the price action is neutral, we could accumulate here leaving room to average on any pullback to ~$3.
Tyro Payments (TYR) Chart
Question 13
“Hi James, thanks as always for your great publication. As with all on the share market lately my question/s is around COVID implications ... I wondered whether you could give your assessment of the prospects of the following SSM, WOR and IVC all of which appear to be struggling (as a result of the COVID situation?). do you see any prospects for significant upside from here?” - Many thanks Don H.
Morning Don,
I appreciate the positive feedback on this Monday morning, always a great way to start the week. Obviously, I have discussed COVID-19 earlier so will comment briefly in the 3 stocks mentioned.
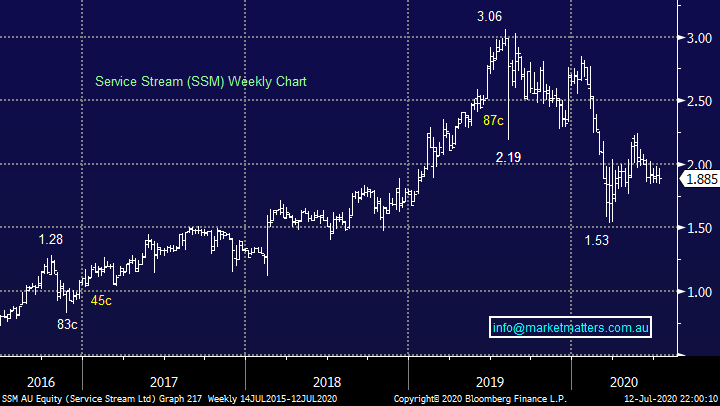
1 - Service Stream (SSM) this infrastructure services company has disappointed of late but we believe this is company with a decent yield of around 5% and a positive growth outlook.
MM still likes SSM.
Service Stream (SSM) Chart
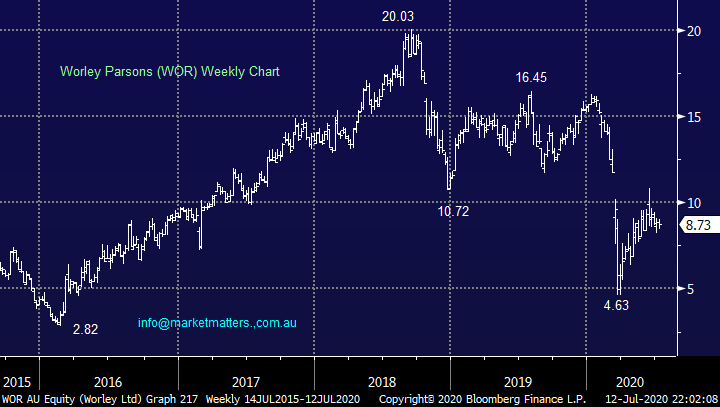
2 – Worley Parsons (WOR) is walking the same path as the Energy Sector which we remain bullish in line with our reflation outlook hence we like WOR into current weakness.
MM likes WOR into current weakness.
Worley Parsons (WOR) Chart
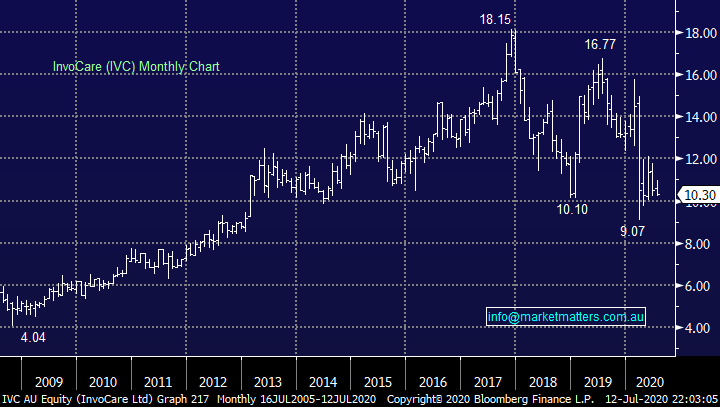
3 – Funeral operator InvoCare (IVC) has been struggling over recent years because of improved competitive offerings. While there is clearly a degree of certainty around, they’re earnings as we all die one day the downside momentum looks capable of taking IVC under $9.
MM is neutral IVC around $10.
InvoCare (IVC) Chart
Question 14
“Hi James and Team. Thanks for another informative week, I am interested in your general view on Macquarie Telecom (MAQ). As you know it is in the Cloud and Cybersecurity space - 40 % of its business is with the government I really like the space and the company is well established. It looks expensive (PE ) and EPS have been a little flat . ROE is ok at around 15%. No Debt - I assume it does not hold Data Centres. Last 3-months has seen strong share price appreciation. How does it compare to NXT and MP1 ? I assume a different business model? I know you like TDI in this space (cloud)” – David P.
Morning David,
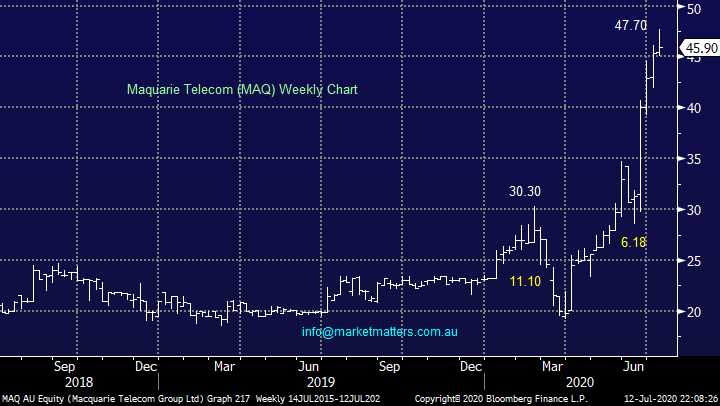
MAQ is a stock and business we like and obviously wish we owned. After surging 50% in just a few weeks some consolidation feels likely whatever the underlying market does – our ideal buy level for this telco is currently around $40. On comparison to NXT and MP1 is about equal, we like all 3!
MM likes MAQ around $40.
Macquarie Telecom (MAQ) Chart
Question 15
“Hi James and team, noted in the Weekend Report you mention you're bullish Chinese facing stocks, which stocks are these? Obviously, RIO, BHP and FMG but are there others you can list? Also, your thoughts on small cap gold miner Ausgold (AUC)? Are they too small for your radar?” - Thanks, Kim B.
Hi Kim,
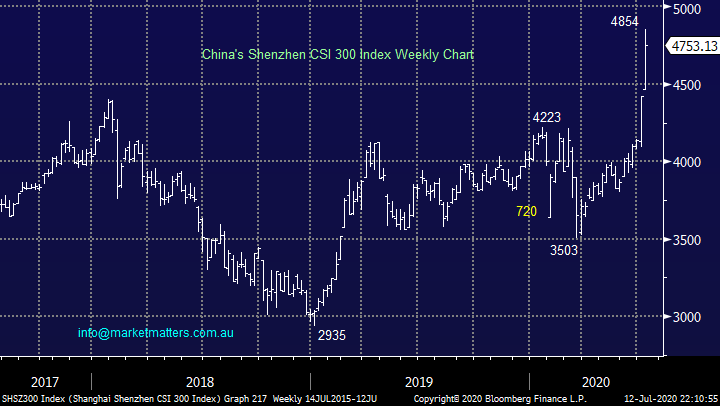
Obviously the resources sector is one we like very much, alternatively perhaps just go to the proverbial source and buy say Alibaba (BABA US) or Tencent (700 HK) on the international markets, we own and like both in our International Portfolio.
MM is bullish China and related stocks into 2021.
AUC is a sub $50m gold “specie” hence not ideal for our portfolio but we like the whole sector both large & small, if / when gold corrects ~$US100/oz expect us to start buying.
China’s Shenzhen CSI 300 Index Chart
Question 16
What companies are likely to do a retail capital raise? What should we be looking for in the numbers? Thanks. Frances
Morning Frances,
Each company will have different metrics that can drive it to raise money, some will raise because they need to, either to shore up their balance sheet for internal reasons or they’re being pressured by lenders to do so, we call this a defensive raise and the key metric here to look at is stretched balance sheets. Gearing ratios are important here, debt to equity for example & specifically, an increase in debt to equity. Companies will also have banking covenants, and these are usually tied to earnings. For example, Net debt to EBITDA cannot exceed 3x. In other words, if a company has earnings before tax etc of $200m, net debt cannot be greater than $600m. Many companies had the seek waivers from banks during COVID-19. We will get a better read on equity raises in August during local reporting season. The other sort of raise is an offensive one, to buy something, or invest more heavily for growth which was primarily the case with Afterpay (APT).
Focussing on the defensive raise by sector:
Resources: Unlikely with the majority of the ASX resource stocks net cash
Banks: NAB has raised, unlikely that others will unless we see more widespread lockdowns / sharp deterioration in property prices. Under this scenario ANZ & WBC most likely, CBA highly unlikely.
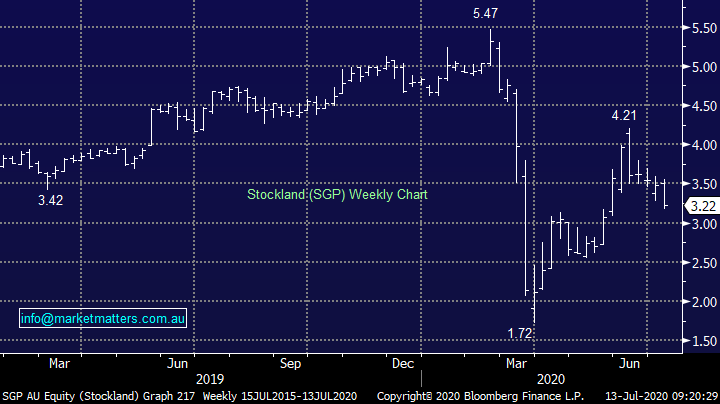
Property: Stocks exposed to retail shopping centres that have higher gearing , Stockland (SGP) is likely in our view, Vicinity (VCX) has raised however they may need to raise again, Office exposures like Dexus (DXS) also in the mix.
Building Stocks: Boral (BLD) remains likely despite new CEO commentary, Bingo (BIN) is a possibility if earnings deteriorate, Adbri (ABC) also in the mix
Others: We hold IVE Group (IGL) in the income portfolio which could raise.
If we had to highlight one sector that we believe will dominate equity issuance moving forward, it’s property.
Stockland (SGP) Chart
Overnight Market Matters Wrap
· The US rallied on hope of a vaccine by year end
· Covid-19 affected stocks rallied – particularly in the US airlines and hotel names.
· Copper futures continued to lead the base metals market higher, jumping over 2.5% to a one year high of US$290.35/lb. on Latin American supply constraints at a time of China’s recent robust economic data continues to drive demand.
· BHP is expected to outperform the broader market after ending its US session up an equivalent of 1.40% from Australia’s previous close.
· Domestic data to look out for this week is the employment data, with unemployment expected to be 7.2%
· The September SPI Futures is indicating the ASX 200 to rip 114 points higher this morning, towards the 6035 level.
Have a great day!
James & the Market Matters Team
Disclosure
Market Matters may hold stocks mentioned in this report. Subscribers can view a full list of holdings on the website by clicking here. Positions are updated each Friday, or after the session when positions are traded.
Disclaimer
All figures contained from sources believed to be accurate. All prices stated are based on the last close price at the time of writing unless otherwise noted. Market Matters does not make any representation of warranty as to the accuracy of the figures or prices and disclaims any liability resulting from any inaccuracy.
Reports and other documents published on this website and email (‘Reports’) are authored by Market Matters and the reports represent the views of Market Matters. The Market Matters Report is based on technical analysis of companies, commodities and the market in general. Technical analysis focuses on interpreting charts and other data to determine what the market sentiment about a particular financial product is, or will be. Unlike fundamental analysis, it does not involve a detailed review of the company’s financial position.
The Reports contain general, as opposed to personal, advice. That means they are prepared for multiple distributions without consideration of your investment objectives, financial situation and needs (‘Personal Circumstances’). Accordingly, any advice given is not a recommendation that a particular course of action is suitable for you and the advice is therefore not to be acted on as investment advice. You must assess whether or not any advice is appropriate for your Personal Circumstances before making any investment decisions. You can either make this assessment yourself, or if you require a personal recommendation, you can seek the assistance of a financial advisor. Market Matters or its author(s) accepts no responsibility for any losses or damages resulting from decisions made from or because of information within this publication. Investing and trading in financial products are always risky, so you should do your own research before buying or selling a financial product.
The Reports are published by Market Matters in good faith based on the facts known to it at the time of their preparation and do not purport to contain all relevant information with respect to the financial products to which they relate. Although the Reports are based on information obtained from sources believed to be reliable, Market Matters does not make any representation or warranty that they are accurate, complete or up to date and Market Matters accepts no obligation to correct or update the information or opinions in the Reports. Market Matters may publish content sourced from external content providers.
If you rely on a Report, you do so at your own risk. Past performance is not an indication of future performance. Any projections are estimates only and may not be realised in the future. Except to the extent that liability under any law cannot be excluded, Market Matters disclaims liability for all loss or damage arising as a result of any opinion, advice, recommendation, representation or information expressly or impliedly published in or in relation to this report notwithstanding any error or omission including negligence.


