Subscribers questions (TLS, VOC, LPD, AGY, API, SIG, CYB, A2M, GMA, ORG, CLQ)
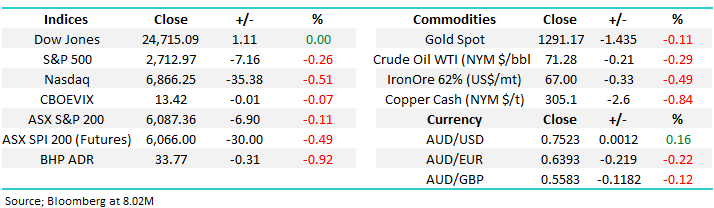
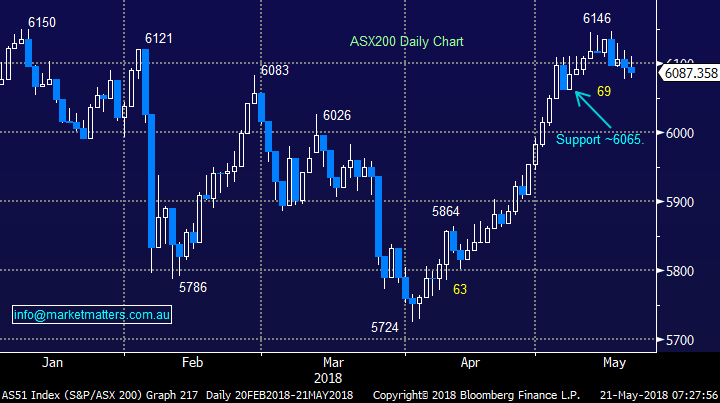
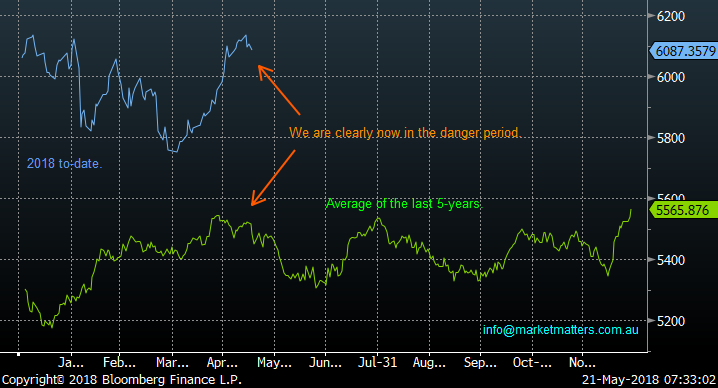
The ASX200 was looking to open down around ~30-poInts this morning according to the SPI FUTURES, however better news over the weekend on China / US Trade talks and our market should now open slightly higher based on movements of US FUTURES this morning. At MM we remain short-term bullish looking for a new decade high in the 6250-area now only ~2.7% away assuming May fails to bring a late period of weakness to live up to its seasonal reputation i.e. “sell in May & go away” – see second chart below.
- We remain short-term bullish the ASX200 but the risk / reward is no longer exciting for the bulls – especially considering our medium-term view.
This week we received an excellent group of questions which is extremely encouraging for the whole MM team, the market is clearly interesting a few people following its recent rally. Today I have answered over 10 when you include the combined answers - of course please keep the questions coming!
ASX200 Chart
ASX200 Seasonality Chart
Question 1
“Do you expect any sizeable or lasting impact from the US-China trade agreement or is it priced in? – Dave R.
Hi Dave, been a while! The US and China have “touted” their trade talks a success although interestingly they have left the details for later. We believe as you say the trade agreement is built into the market and this was illustrated perfectly by the aggressive selling that hit stocks when fears of a global trade war, led by China and the US, escalated earlier in the year i.e. markets are positioned for improving “free” trade.
Donald Trump announced in March the US would impose a 25% tariff on imported steel and a 10% tax on aluminium, this was clearly aimed directly at China. In hindsight this now feels like another classic example of how the “Don” likes to negotiate, perhaps we should all read “Trump: The art of the deal” in more detail to understand the psychology behind his future bluster.
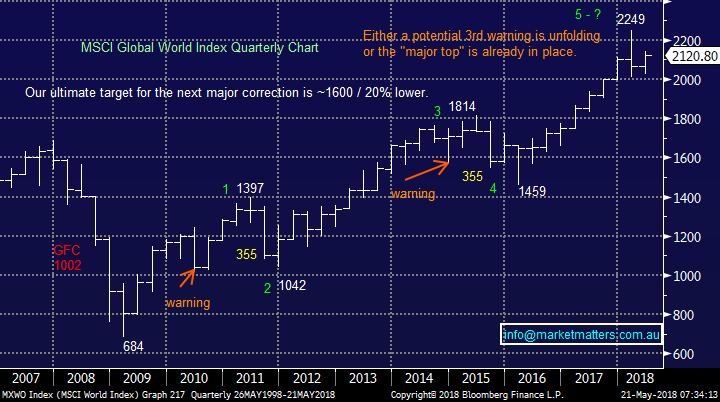
I would expect a ~1% pop higher by most global indices on the weekends news early this week before things quickly return to trading as normal.
MSCI Global World Index Chart
Question 2
“Hi, Is TLS now in buying territory? Four analyst downgrades today with an average target price of $3.025 vs closing price of $2.87.” - David H.
“Hi James, the telecommunications Sector has been negatively impacted due to concerns pertaining to Telstra, hence would appreciate your views on VOC.” - Regards Jeff.
Hi Guys,
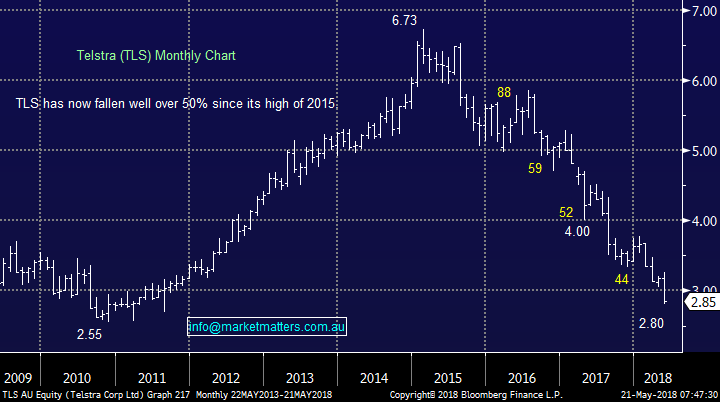
Telstra shares (TLS) have plummeted well over 50% since Andy Penn’s appointment, wiping a huge $46bn from the companies valuation hurting virtually every Australian through their Super. Interestingly the AMP scandal that so publicly cost chairman Catherine Brenner her job cost investors less than $3 billion. Anyway enough whingeing, time to look forward and attempt to make some money from this telco giant which hopefully is not travelling along the same path as the dodo!
TLS is undoubtedly in a bear market which we often refer to as resembling a ping pong ball going down a staircase, it will reach the bottom but not without some large bounces along the way.
- Since its major high in early 2015 TLS has bounced 17.7%, 12.6%, 13% and 13.2%.
Until further notice at MM we regard TLS as a trading / active investing stock that’s paying a large fully franked dividend. We believe TLS is a buy for the brave below $2.80 looking for a free-dividend / ~15% bounce.
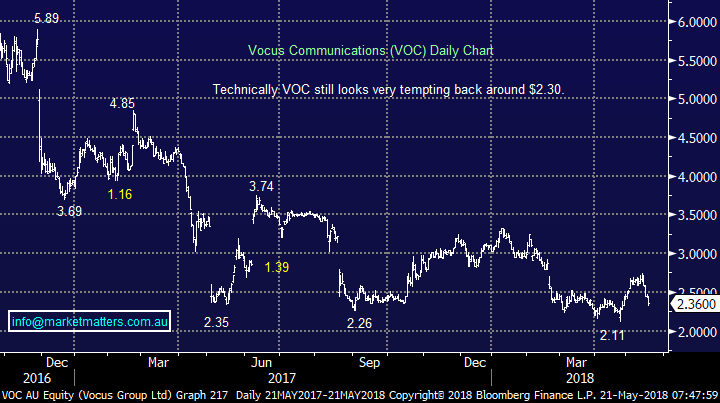
Similarly, we believe Vocus is now a trading stock which looks attractive for the brave around $2.30. This morning, news that Kevin Russell will take over as the new CEO may be seen as a positive, although he was the front runner for the position + he has recently completed a stint as Telstra’s group executive for retail – not a glowing endorsement at the moment! Importantly, Vocus may need to raise capital so taking trading positions in this stock holds additional risk.
When future clarity returns to the sector / stocks they will hopefully again become more “investable grade” companies but until this time we will remain cautious.
Telstra Ltd (TLS) Chart
Vocus Communications (VOC) Chart
Question 3
“Hi M&M, I was wondering if you could analyse and give your opinion on a couple of stocks in the lithium sector whose next step is production. LPD and AGY. Thank you and keep up the good work” – Thanks Tony.
Hi Tony,
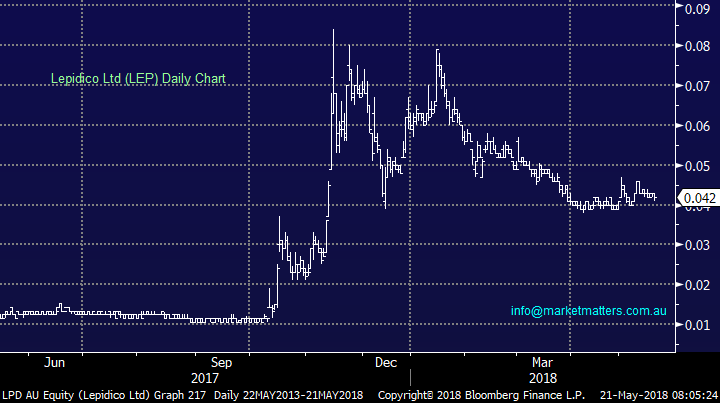
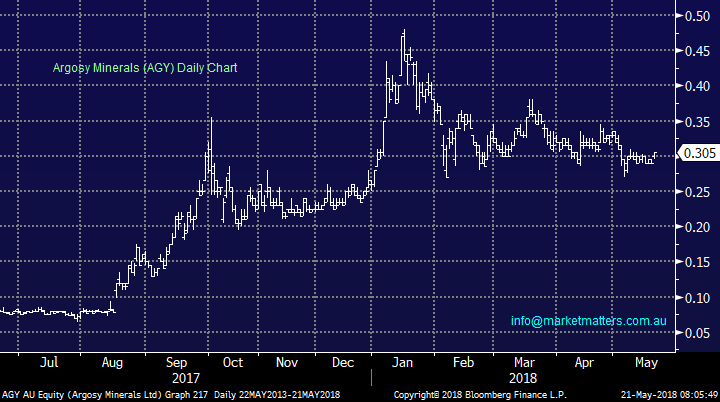
At MM we are fans of the lithium sector as I’m sure you are aware but we also acknowledge its currently volatile / high risk after rallying so far in just 3 ½ years e.g. last week our holding in Orocobre (ORE) rallied ~13% from its Tuesday low. Our concern for the 2 companies mentioned is where they stand In the sector evolution – cast your mind back to the iron ore boom, most of the hopefuls have subsequently failed and only Fortescue (FMG) really remains as the cream floats to the top.
- LPD has a $122m market cap while AGY sits at $280m, compared to our sector favourites ORE $1.58bn and Kidman Resources (KDR) at $919m.
Both of our preferences have major partners with Toyota and Tesla and yet LEP / AGY move with the same level of volatility. Undoubtedly one, or both, of the 2 mentioned smaller players may come good but from a risk / reward basis we prefer ORE / KDR plus for the aggressive player they provide plenty of opportunities for the nimble – just look at recent successes in both KDR and ORE.
Lepidico Ltd (LPD) Chart
Argosy Minerals (AGY) Chart
Question 4
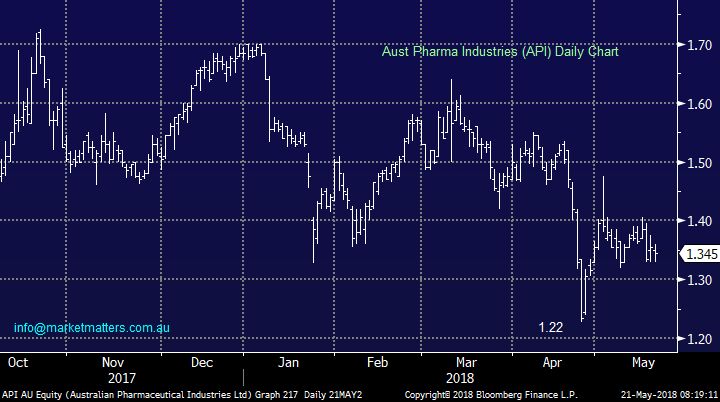
“Thank you for the amazing service! Question - Why were API and SIG both down today? “- Best Regards, Matt C.
Morning Matt, I know we are a tad late with today’s reply but I felt it was still worthwhile.
1 Aust Pharma (API) – API has been under pressure with earnings showing flat revenue and shrinking sales on its Priceline brand. Overall things look challenging for API to us and there are better places to be invested.
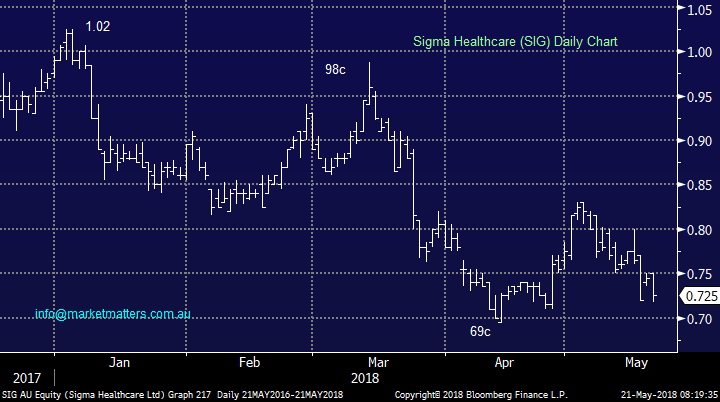
2 Sigma Healthcare (SIG) - Pharmaceutical wholesale / distribution company Sigma Healthcare Ltd (SIG) has disappointed investors since the release of its full year earnings on March 22. Also, and very importantly its been locked in a legal dispute with major customer My Chemist / Chemist Warehouse and there are very rarely any winners from these situations.
SIG is trading on a forward PE of 13.7x 2019 earnings while yielding 6.9% fully franked.
- We regard SIG as good value, albeit high risk, into fresh lows under 69c.
Aust Pharma Industries (API) Chart
Sigma Healthcare (SIG) Chart
Question 5
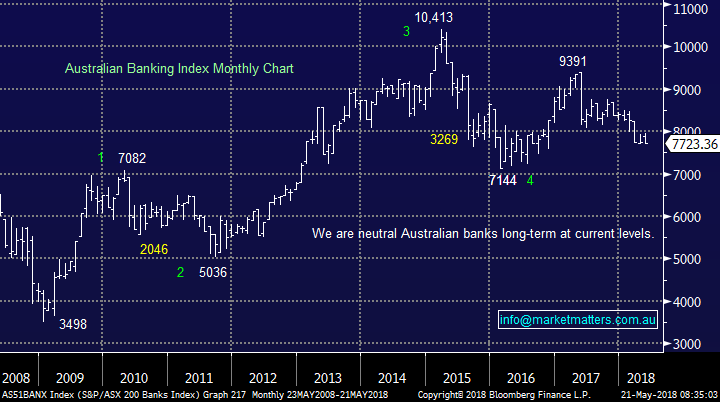
“Greetings James, what is the ASSI Banking Index. I can’t find it among the indices in my data download. Does it have an alternative name?” - Regards, John W.
Hi John, the ASX200 Banks Index is a capitalization weighted index. The code is actually AS51 which is a Bloomberg code. The index is not surprisingly comprised of relevant companies within the ASX200 e.g. CBA, Westpac, CYB and Bank of Queensland.
ASX200 Banking Index Chart
Question 6
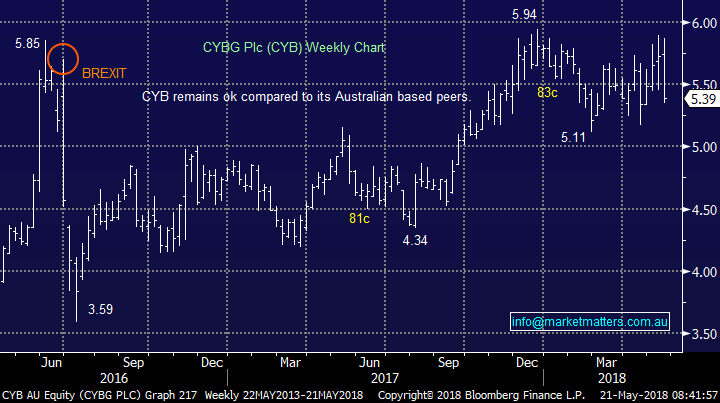
“Hi guys, 1st time for a Q Its about CYB and the fact that talk about town is that they paid ppl to create new accounts Your thoughts please” – Thanks Bert.
Hi Bert, undoubtedly banks are giving special offers, deals and discounts for customers to open new accounts and CYB recently rolled out a promotion on this that (as the company said) resulted in many thousands of new accounts being opened. The issue was that most accounts failed to get deposits (but costs money to open) and now we have some analysts saying that customers were being paid to do so without following up on the details of how this actually occurred.
In terms of banks generally, undoubtedly the royal commission has shocked us all but I don’t believe this is the time to become paranoid, it feels highly likely that the worst is behind the sector, at least on the news front
CYBG Plc (CYB) Chart
Question 7
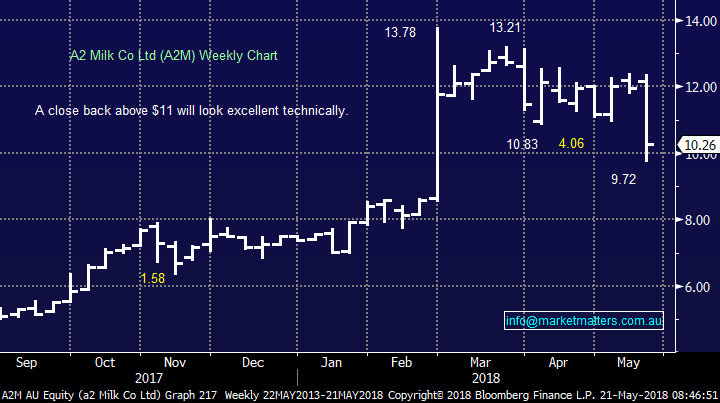
“Good morning James. my question about A2M buyback. A2M has declared the 7Million share buyback last year but until now it doesn't happen yet. do you think they will start buying back in near term to support its share price falling? if it does happen, will it help the share back to normal uptrend? also like PTM share buyback plan, why the coy didn't do it since it was announced?” – Michael.
Morning Michael, undoubtedly if A2M are going to commence there buyback the current weakness would be the logical time but perhaps the increased marketing spend as the company continues its expansion feels a better way for management to invest their $$. Personally I would rather see them reinvest the dollars in the business as the companies growing so well / fast as opposed to lazily buy their own stock.
Also, considering the huge appreciation by the stock I don’t feel management will feel any compunction to “support the stock’ they have looked far smarter than this over recent years.
We are long A2M in our Growth Portfolio and happy so far.
As for PTM I have no idea why you announce a buyback and then don’t pull trigger unless better ways to spend the $$ presents itself, it almost feels like its misleading the market.
A2M Milk (A2M) Chart
Question 8
“Hi I have a query regarding your growth portfolio, if it were not for two stocks [WEB&SUN] the portfolio would be showing quite a loss, is this of a concern. Likewise, with the income portfolio it would seem that one stock[NCK] is holding it up, although I guess any losses here are offset by dividends,” - John D.
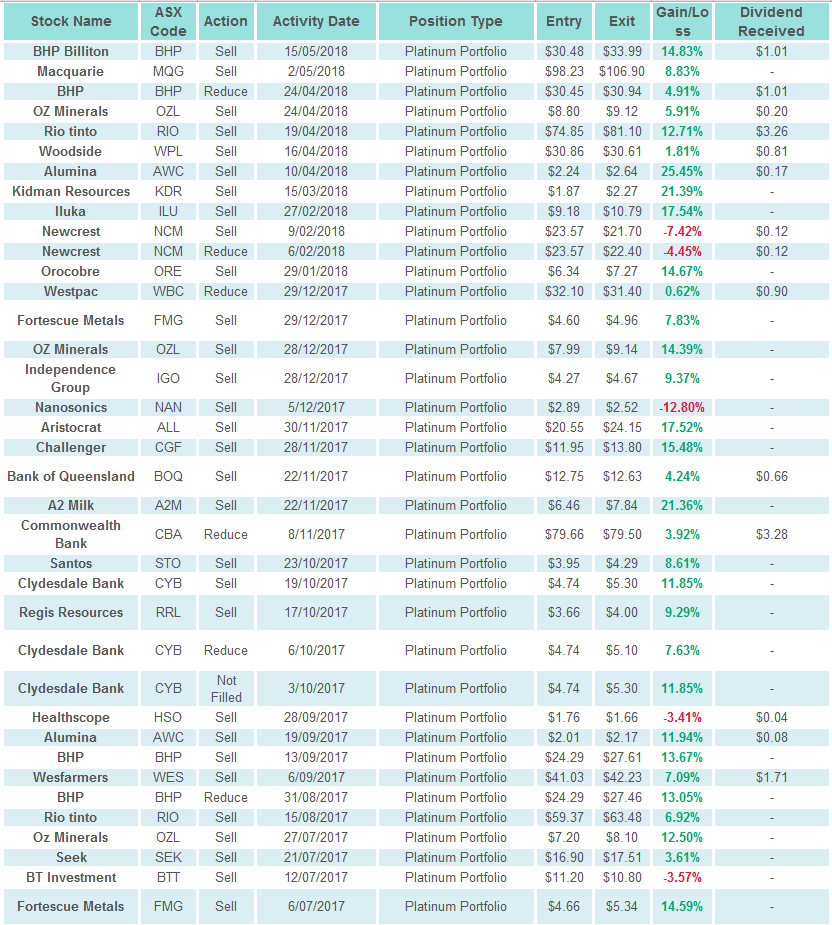
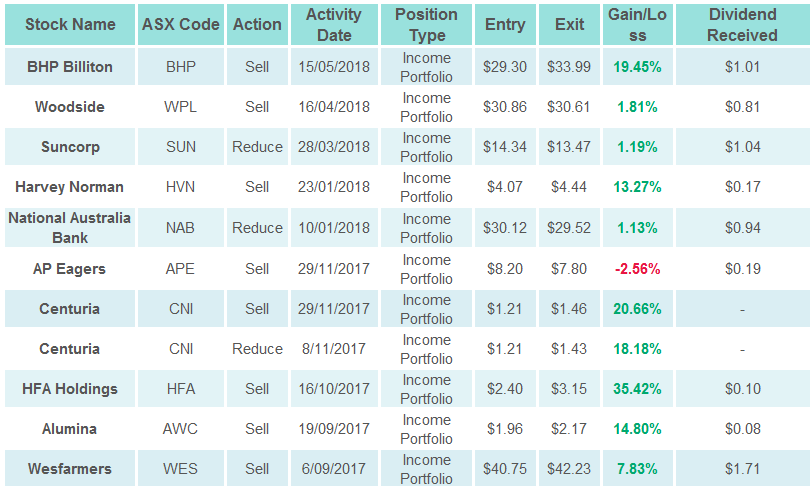
Hi John, at a glance this feels a very valid observation but I believe you should also take into account our recent activity / locked in profits to see the whole picture.
- Remember in the last 2 Weekend Reports we’ve highlighted how stocks are coming in / out of favour sometimes daily, at MM we are not afraid to lock in profits when stocks reach our target areas. We believe we are in the mature phase of a post-GFC bull market where active investing is currently the way forward.
Below are all closed trades from both Portfolios this Financial Year to date;
Growth Portfolio
Income Portfolio
Question 9
“Hi MM I noticed in your Income Portfolio that you have Genworth as a Buy. Interested in your reasons.” - Thanks Richard.
Hi Richard,
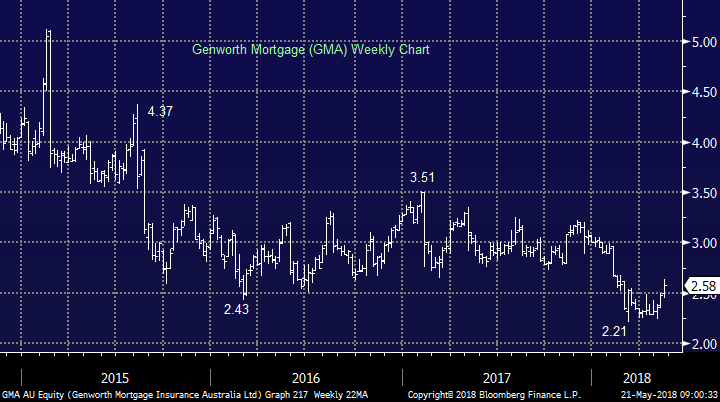
Technically GMA actually looks good technically with a counter-trend target around $3.25-3.50. We discussed the stock in an Income Report in April and the rationale still holds true.
**Written 11/4/18***Genworth (GMA) $2.29 – click to view the note
We’re currently showing a paper loss on to mortgage insurer Genworth of ~15% as at yesterdays close seemingly underestimating how concerned investors are about a property crash in Australia. That’s obviously one reason for the stock suffering of late, however there’s also a few other factors at play;
· We know GMA is cheap trading on 10x with a forecast yield over 10% plus franking however they’ll likely have flat earnings going forward. The main factor of weak earnings in recent times has been an increase in lending standards from major banks which effectively reduces the demand for mortgage insurance
· We bought on the thesis that very well flagged flat / lower earnings means less insurance which means less risk and ultimately less capital requirements, so capital would flow back to shareholders. That view still stands however when they reported they essentially pushed back expectations around when that capital could be released.
· The parent company (US listed Genworth) still owns 55% of GMA, and they’re likely sellers given they have plans to reduce / restructure debt. An overhang of stock reduces the natural demand in the market
We still like GMA technically but need to see a close back over $2.40 to become bullish – the market is very negative this stock and it will simply take some ‘less bad’ news to see the stock higher.
Genworth Mortgage Insurance (GMA) Chart
Question 10
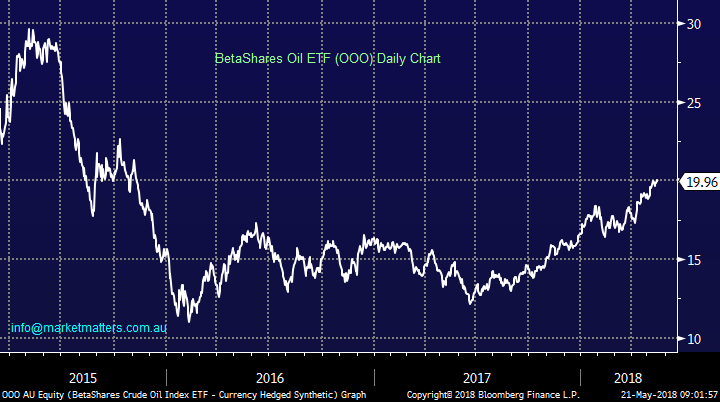
“Hey guys, thanks for the work to date. Given your thoughts on oil, I take it you believe a sell is in order for any oil-based ETF i.e. OOO?” - Kind regards Mic W.
Hi Mic, The volatility in oil can undoubtedly be scary at times especially with an unstable Middle East.
Hence we are usually more included to short a stock like Origin via put options, with capped risk, as opposed to an open ended risk with the ETF – note this is very much for the trader.
From an investment perspective we simply believe it’s time to lock in profits and avoid the energy sector for the time being.
Beta Shares Crude ETF Chart
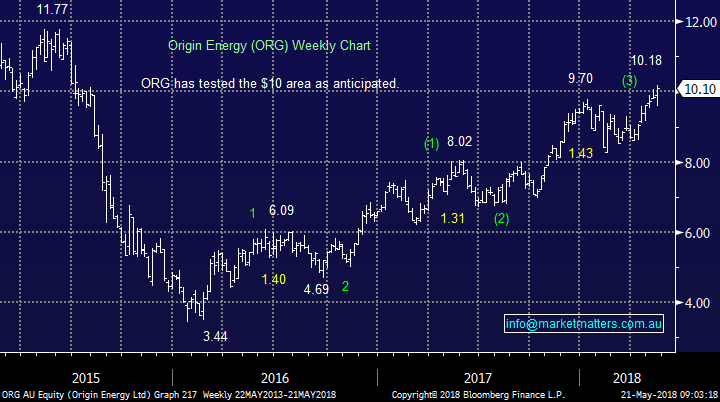
Origin Energy (ORG) Chart
Question 11
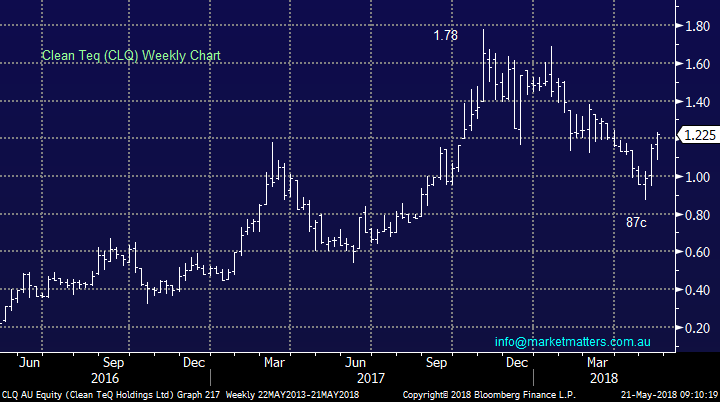
“Hi MM, I was wondering what your opinion on Cobalt is and whether there are any stocks on your radar to gain exposure to this thematic? Would you recommend CLQ to get exposure to cobalt?” - Kind regards, Mitch.
Hi Mitch, we do like the cobalt space, along with lithium being a major component in the growing battery space.
While we do prefer lithium stocks ORE / KDR I must say Clean Teq. (CLQ) looks great targeting above $1.60 minimum, although I would run stops below $1, hence risk / reward ok but not amazing.
Clean Teq. Holdings (CLQ) Chart
Overnight Market Matters Wrap
· The US equity markets closed mixed with marginal change overnight, as their bonds ascended further to multi-year highs at 3.12%.
· Commodities drifted lower, with both crude oil and iron ore down – expect BHP to underperform the broader market after ending its US session down and equivalent of -0.92% from Australia’s previous close towards $33.77.
· Locally, the banking sector will be closely looked at with the Hayne Royal enquiry to reconvene, today with Westpac (WBC) and its business lending practice.
· The June SPI Futures is indicating the ASX 200 to open 28 points lower towards the 6060 level this morning.
Have a great day!
James & the Market Matters Team
Disclosure
Market Matters may hold stocks mentioned in this report. Subscribers can view a full list of holdings on the website by clicking here. Positions are updated each Friday, or after the session when positions are traded.
Disclaimer
All figures contained from sources believed to be accurate. Market Matters does not make any representation of warranty as to the accuracy of the figures and disclaims any liability resulting from any inaccuracy. Prices as at 21/05/2018. 8.31AM
Reports and other documents published on this website and email (‘Reports’) are authored by Market Matters and the reports represent the views of Market Matters. The MarketMatters Report is based on technical analysis of companies, commodities and the market in general. Technical analysis focuses on interpreting charts and other data to determine what the market sentiment about a particular financial product is, or will be. Unlike fundamental analysis, it does not involve a detailed review of the company’s financial position.
The Reports contain general, as opposed to personal, advice. That means they are prepared for multiple distributions without consideration of your investment objectives, financial situation and needs (‘Personal Circumstances’). Accordingly, any advice given is not a recommendation that a particular course of action is suitable for you and the advice is therefore not to be acted on as investment advice. You must assess whether or not any advice is appropriate for your Personal Circumstances before making any investment decisions. You can either make this assessment yourself, or if you require a personal recommendation, you can seek the assistance of a financial advisor. Market Matters or its author(s) accepts no responsibility for any losses or damages resulting from decisions made from or because of information within this publication. Investing and trading in financial products are always risky, so you should do your own research before buying or selling a financial product.
The Reports are published by Market Matters in good faith based on the facts known to it at the time of their preparation and do not purport to contain all relevant information with respect to the financial products to which they relate. Although the Reports are based on information obtained from sources believed to be reliable, Market Matters does not make any representation or warranty that they are accurate, complete or up to date and Market Matters accepts no obligation to correct or update the information or opinions in the Reports.
If you rely on a Report, you do so at your own risk. Any projections are estimates only and may not be realised in the future. Except to the extent that liability under any law cannot be excluded, Market Matters disclaims liability for all loss or damage arising as a result of any opinion, advice, recommendation, representation or information expressly or impliedly published in or in relation to this report notwithstanding any error or omission including negligence.
To unsubscribe. Click Here