Subscribers questions (TLS, PL8, CYB, GXY, IVC)
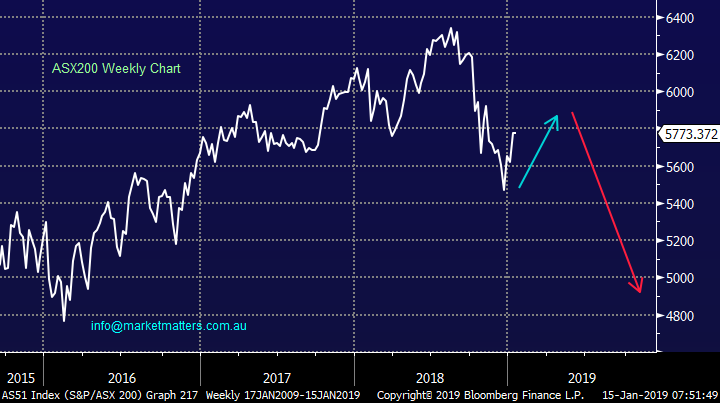
Yesterday in the face of adversity from global markets during our day the ASX200 held together strongly i.e. while the US S&P500 futures slipped close to 1% and the Hang Seng plunged closer to 1.5% the local stocks managed to close unchanged. Our influential banking sector closed solidly in the black and as we often say “the market doesn’t go down without the banks”.
Equities have clearly changed their glasses from December’s deep pessimism to today’s comparative optimism. The extremely poor economic data out of China in recent times is being taken almost positively as fund managers believe it will force China to be more flexible in trade talks with the US. They may be correct but the world’s second largest economy is known for playing a long game so this assumption may prove dangerous.
Overnight US stocks recovered from early losses to only close down around 0.5%, a generally quiet session with the futures implying the local market will open up almost 10-points.
Thanks for the questions over the Christmas / New Year’s break.
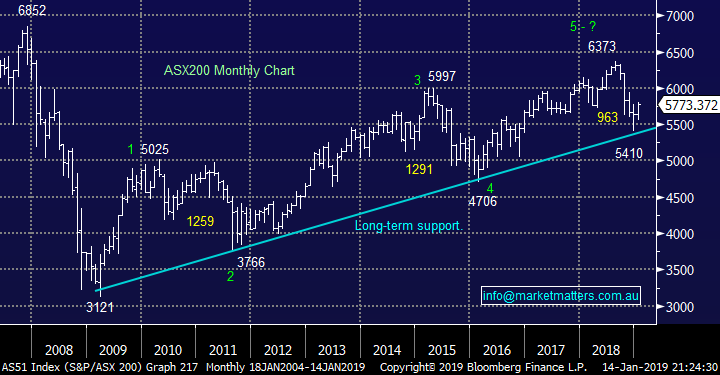
ASX200 Chart
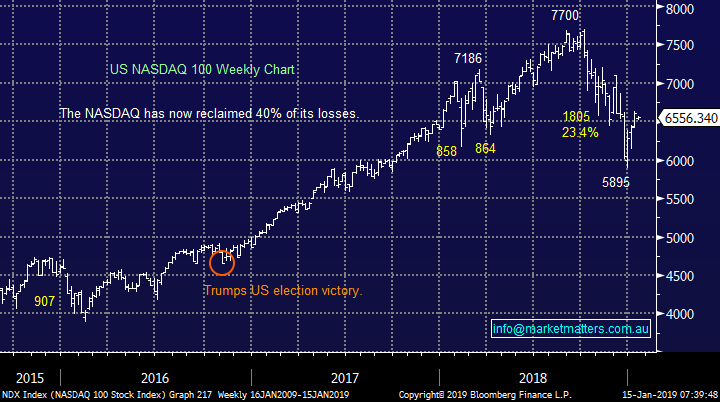
The growth / tech based NASDAQ has already reclaimed around 40% of its aggressive decline at the end of 2018.
We can see further gains in Q1-2 of this year with a number of weeks chopping primarily between 6500 and 7000 our current best guess.
US NASDAQ Index Chart
Question 1
“Hi James & MM Team, I like your roadmap charts of how you envisage markets unfold, can you show an updated one for the ASX200? - Regards, Stephen E.
Hi Stephen,
Thanks for an easy one to start the year! For the below to unfold we are probably going to need an Australian recession but that would be no great surprise when we consider property prices, US – China trade concerns, the risks from a new Australian government and BREXIT to name just a few macro / local economic worries unfolding before our eyes.
It’s important to remember that MM will invest through 2019 and 2020 with a more conservative stance due to our general view but it most definitely does not mean we will be inactive on both the buy and sell front as different sectors are almost guaranteed to enjoy periods in the sun e.g. gold stocks may take off if inflation raises its head globally.
ASX200 Chart
Question 2
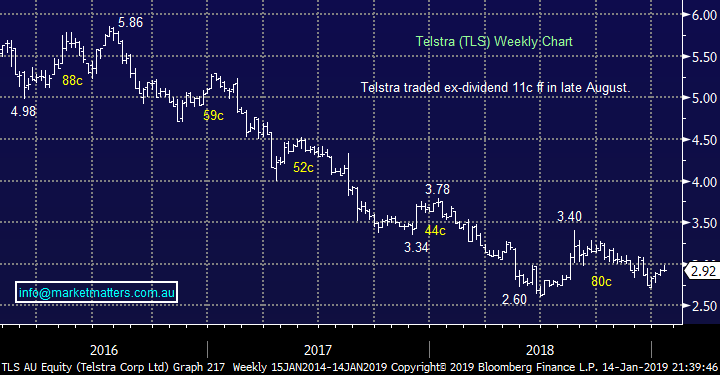
“Hi James & MM Team, hope you guys had a good break over the holidays. Noting your last report on Telstra, expectation is for the stock to outperform the ASX200 over the coming year & for a sell / reduce target of $3.50. Obviously, the TPG / Vodafone merger and recent talk around future NBN write-down is still on the horizon, which may provide some future up-side. However, some analysts seem to be predicting a cut to the annual dividend is likely (~17 cents). As such, is it worth revisiting the target price &/or weighting on TLS in the portfolio prior to the interim half year results are released on 14th February - or has this already been priced into the current lower share price?” - Regards, George B.
Hi George,
TLS is always a discussion point. Last year we thought the large Telco would trade between $3 and $4, not too far off as it oscillated between $3.78 and $2.60 while paying 22c fully franked in dividends. Below $3 we believe the previous abundance of bad news is priced into TLS while the company’s progress on costs and overall strategy moving forward is being ignored.
Bloomberg consensus is actually for a bigger reduction in the dividend than 17cps for 2019, with the market looking for 7.5cps paid in February and again in August – the same is expected in 2020 while consensus suggests a dividend of 22cps in 2021, however it’s hard to put much weight into calls that far out. We expect the dividend to be cut, but less so than the market now implies. At 17cps as you mention the stock will be yielding almost 6% fully franked which remains solid.
We expect TLS to range between $2.50 and $3.50 in 2019 and we may well be buyers / sellers at the respective extremes.
Telstra (ASX: TLS) Chart
Question 3
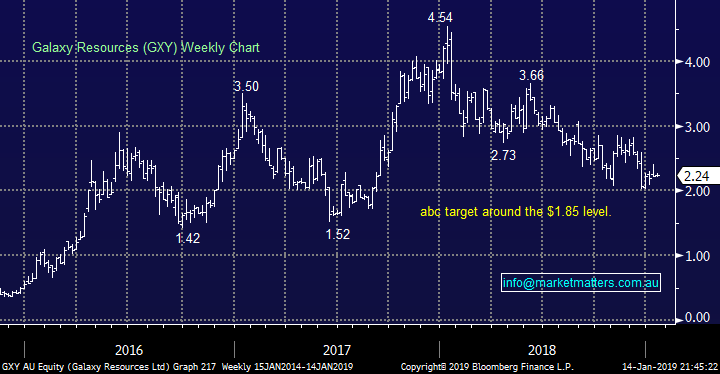
“Hi James. I have just recommenced trading in shares after 40 years of other business activities. I understand the general method of "short Sellers" but is it possible to identify them in the market place. Are they evident in the way orders are placed i.e. high quantities, large differences in market prices? My second question is I buy and sell a number of cheaper stocks and rely on small margins to make consistent profits dealing in 20,000 to 50,000 shares at a time. Quite often I see strings of small sales i.e. between 100 and 200 of these cheap shares being sold and after brokerage cannot result in a profit. What is happening?” – John C.
Hi John,
Welcome back!
1 Shorting stocks.
The most shorted stock out there today is GXY with 17% of its stock sold short and for reference a great free site to watch these positions evolve is Shortman below:
However in terms of day to day price action it’s impossible to know when certain sell orders are for shorting purposes or just a simple exit unless you’re the broker executing the trade.
2 Small parcels
The small parcels you are referring to are a mixture of things including VWAP orders and high frequency traders. For example, I can give an order to offload a line of stock targeting the volume weighted average price (VWAP) over the day, the computer will participate in the market over the day depending on price and volume, generally hitting the market will small orders to achieve that outcome.
In terms of commissions it depends what broker you use, however normally one commission charge is simply levelled at the end of the day on the total trade size irrespective of how many smaller lines are placed throughout the session – that’s certainly how we operate.
Galaxy Resources (ASX: GXY) Chart
Question 4
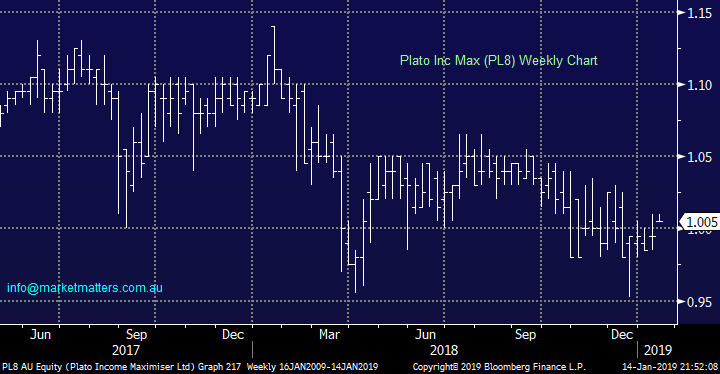
“Hi Can you give me your opinion on PL8, Plato income maximiser limited.” - Thanks Rennie.
Hi Rennie,
The listed investment PL8 is fairly new having been established in mid-2017 and since then, its performance has been mediocre. While it is expected to yield nearly 6% fully franked which is attractive, the total return relative to the benchmark is less stella since listing. Below is a quick snapshot of how I’d look at an LIC fairly quickly….
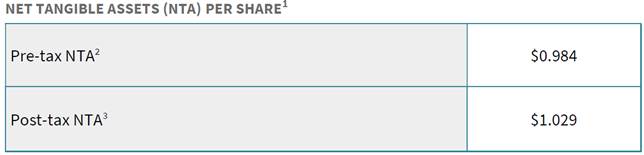
1. Price relative to NTA
When looking at a listed investment company (LIC) the first port of call is the value of their assets, or NTA as its commonly called. Does the LIC trade at a premium or discount to the value of its holdings? Right now, PL8 trades at or around NTA so no real premium or discount to be concerned with.
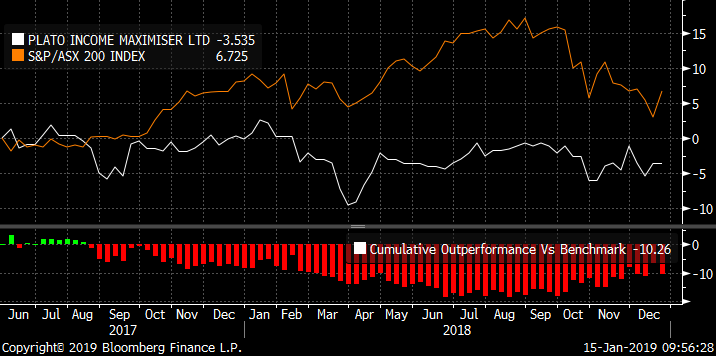
2. Performance
Then drill into performance of the fund and in the case of PL8, it’s not great. Since listing in May 2017 they’ve generally lagged the benchmark.
White line is PL8, orange line is the ASX 200 accumulation index
If these two aspects stack up I’d then dig into their holdings, fees, and volatility of returns, however in the case of PL8, I’m not that enthused by the above.
Plato Inc Max (PL8) Chart
Question 5
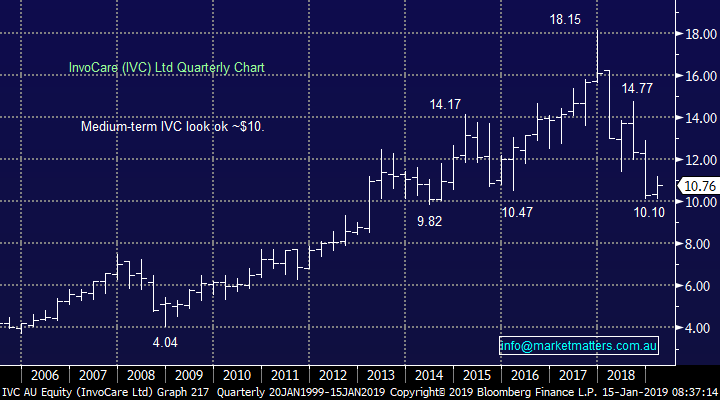
“Hi James, do you still like InvoCare (IVC) after its recent aggressive decline?” – Matt F.
The funeral home operator has had a tough few years as new competition has entered the fray at a time when there’s been lower growth in people falling off the perch – generally considered a good thing but not necessarily if you’re a funeral home!
From a valuation perspective, it’s now cheap relative to where it has traded historically, however I think the sector is changing and the ‘roll up’ strategy IVC were pursing has become more difficult. On a P/E of 20.3x its around 19% ‘cheap’ versus its 5 year average however its earnings momentum is weak – and paying 20x for a business with weak momentum is not for us as.
IVC earnings expectations (red) v share price (white)
That said, the stock should outperform in a bear market because of its revenue stability but while it looks ok around $10 our enthusiasm has waned of late, our ideal entry is now closer to $9.
MM is now neutral IVC.
InvoCare (ASX: IVC) Chart
Question 6
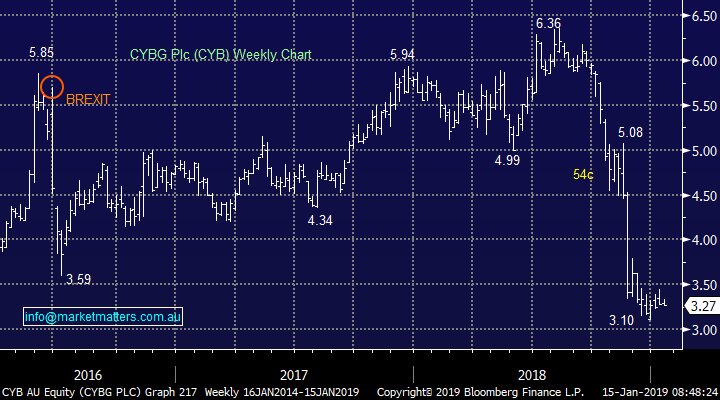
“Hi James & team, do you think Theresa Mays problems with BREXIT will cause another market plunge?” – Mark B.
Not particularly is my logical thought as its fully expected but while things look an absolute mess in the UK any real sniff of a second referendum could be taken very positively short-term.
However its likely to take a while for investors to again become confident in the UK and it’s probably best just left alone. CYB is a stock we’ve tracked / traded in the past however it seems all too hard at the moment.
MM is neutral CYB at present.
CYBG Plc (ASX: CYB) Chart
Overnight Market Matters Wrap
· Global markets were predominantly weaker overnight, as investors were concerned of a slowing global growth following weak Chinese trade data and the Brexit deal likely to suffer a large defeat in British Parliament tonight.
· US earnings began overnight, with the Citigroup in profit for 4Q18 – pushing the sector to outperform its peers overnight. – Locally we expect some strength in Macquarie Group (MQG).
· The March SPI Futures is indicating the ASX 200 to open marginally higher, towards the 5780 level this morning.
Have a great day!
James & the Market Matters Team
Disclosure
Market Matters may hold stocks mentioned in this report. Subscribers can view a full list of holdings on the website by clicking here. Positions are updated each Friday, or after the session when positions are traded.
Disclaimer
All figures contained from sources believed to be accurate. Market Matters does not make any representation of warranty as to the accuracy of the figures and disclaims any liability resulting from any inaccuracy. Prices as at 15/01/2019
Reports and other documents published on this website and email (‘Reports’) are authored by Market Matters and the reports represent the views of Market Matters. The MarketMatters Report is based on technical analysis of companies, commodities and the market in general. Technical analysis focuses on interpreting charts and other data to determine what the market sentiment about a particular financial product is, or will be. Unlike fundamental analysis, it does not involve a detailed review of the company’s financial position.
The Reports contain general, as opposed to personal, advice. That means they are prepared for multiple distributions without consideration of your investment objectives, financial situation and needs (‘Personal Circumstances’). Accordingly, any advice given is not a recommendation that a particular course of action is suitable for you and the advice is therefore not to be acted on as investment advice. You must assess whether or not any advice is appropriate for your Personal Circumstances before making any investment decisions. You can either make this assessment yourself, or if you require a personal recommendation, you can seek the assistance of a financial advisor. Market Matters or its author(s) accepts no responsibility for any losses or damages resulting from decisions made from or because of information within this publication. Investing and trading in financial products are always risky, so you should do your own research before buying or selling a financial product.
The Reports are published by Market Matters in good faith based on the facts known to it at the time of their preparation and do not purport to contain all relevant information with respect to the financial products to which they relate. Although the Reports are based on information obtained from sources believed to be reliable, Market Matters does not make any representation or warranty that they are accurate, complete or up to date and Market Matters accepts no obligation to correct or update the information or opinions in the Reports. Market Matters may publish content sourced from external content providers.
If you rely on a Report, you do so at your own risk. Past performance is not an indication of future performance. Any projections are estimates only and may not be realised in the future. Except to the extent that liability under any law cannot be excluded, Market Matters disclaims liability for all loss or damage arising as a result of any opinion, advice, recommendation, representation or information expressly or impliedly published in or in relation to this report notwithstanding any error or omission including negligence.


