Subscribers questions (SGP, TCL, SYD, CCL, MQG, MTS, JIN, WHC, XRO)
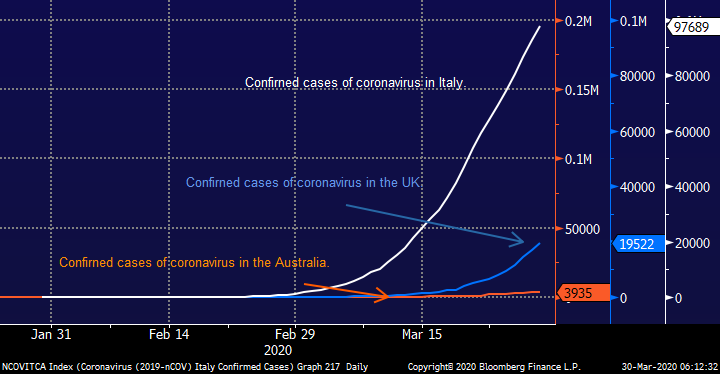
Australia and the rest of the world is now taking COVID-19 very seriously, locally life has changed beyond recognition as there are now only 4 acceptable reasons to leave our own homes while private gatherings have been reduced to just 2 people – it’s truly amazing how far things have progressed over just a few weeks. However, anybody who is complaining about these draconian measures should look at the statistics, similar aggressive measures in countries like Italy and the UK are starting to show improvement albeit from an awful scenario for Italy over recent weeks.
A couple of things concern me from a stock market perspective as we look through todays COVID-19 changes to our life:
1 – The US still feels unprepared for what’s coming in the next few weeks although Trump’s recent softened rhetoric certainly implies, they are slowly but surely getting a handle on the severity of things. Their current death toll is approaching 2400 with plenty of mathematical modelling suggesting an ultimate number between 100,000 and 200,000 is likely, unfortunately I still don’t feel their countries ready for this from either an infrastructure or social perspective.
2 – China supposedly only witnessed 3,300 deaths compared to Italy and Spain approaching 11,000 and 7,000 respectively. I know for a fact that the Chinese people don’t believe their own governments numbers hence we must now question their 4-6 weeks’ timeframe to come out the other side, especially as we’re now hearing the UK tell its citizens that they will not get back to “normal life” for up to 6-months, Scott Morrison is telling us the same, undoubtedly the next few weeks are likely to both determine and clarify the length and severity of how things unfold.
Australia is shutting down in such a comprehensive manner that it’s not going to be like switching a light back on to get things up and running again, but its not all bad news, as I said the statistics are showing that “lockdown” works and equities are already pricing in some huge economic damage from COVID-19, opportunities are presenting themselves for investors who recognise that life will undoubtedly be different post COVID-19. The key is clearly being able to ‘hobble through’ this next 3-6 months in a way that doesn’t cripple the economy’s ability to lift off again when the dust settles.
Remember countries like South Korea and Singapore who we do trust did get on top of this fairly quickly.
Coronavirus Global cases Chart
A we said above post COVID-19 will be different with corporate and consumer behaviour undoubtedly altered from 2019 as global trends evolve / simply change – identifying the beneficiaries moving forward is key to successful investing in the years ahead. We are confident that stocks will take off as the world wins the battle with the coronavirus but the big winners over the last decade are not necessarily going to maintain that position in the future.
Although our preferred scenario is the market will make another fresh low in 2020 our focus remains on repositioning the portfolio’s to take advantage of the recovery when it comes, in other words, we won’t hesitate to buy if a stocks (s) we like comes under pressure this week. This week’s notes will concentrate on our portfolio positioning across the 4 MM Portfolio’s, starting tomorrow morning with the Growth Portfolio.
MM is in accumulation phase.
ASX200 Index Chart
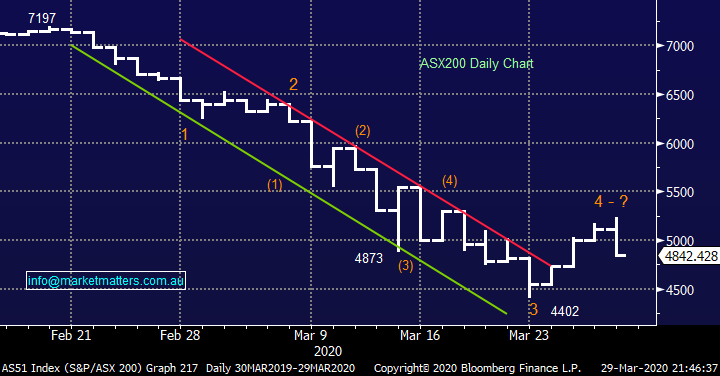
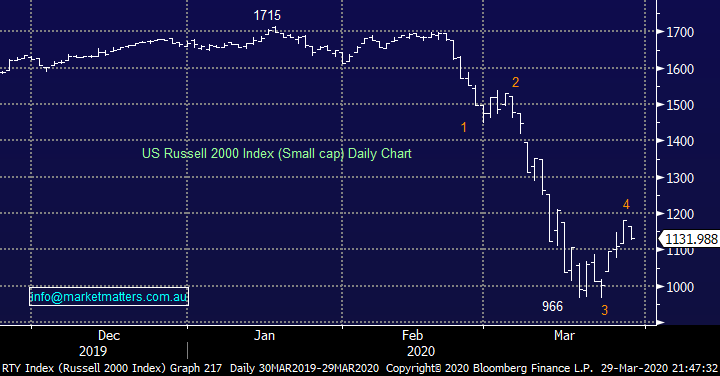
On Friday night US stocks gave up some of the weeks strong gains but we’re confident that the stock market is “looking for a low” although the picture is different across the respective indices with generally the bigger the better a reoccurring theme – this makes sense as there’s less perceived risk of failure from respective debt burdens as the income stream is largely turned off for many companies through no fault of their own.
MM is anticipating a choppy but quieter week – a big call at present!
Russell 2000 Index Chart
Question 1
“Hi Team, is there a way of simply buying the market. For instance, is there an ETF that replicates the market, or alternatively can you buy shares in XJO.” – Frederick R.
Hi Frederick,
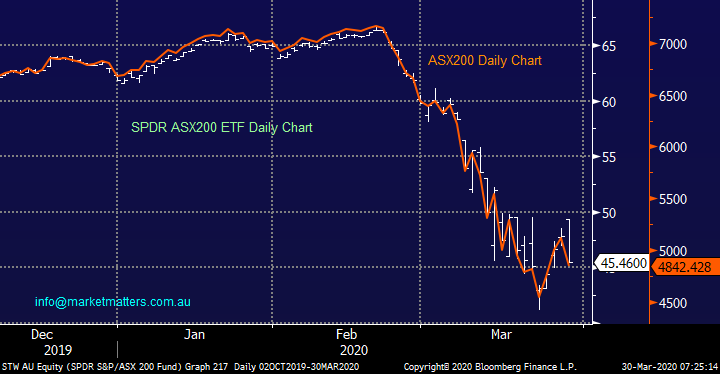
Yes, there are a number of index funds that track the ASX 200. The biggest is the SPDR ASX200 ETF (STW) while the cheapest is the Betashares A200 ETF (A200), both essentially mirror the ASX200 before fees.
MM likes the STW & A200 ETF’s that mirror the ASX200.
SPDR ASX200 ETF (STW) Chart
Question 2
“Hi James, appreciate your expert and timely analysis – wonder how you, Harry and the team can keep on top of it all. My first question is a request for an explanation of the various US Futures references in Monday 23 March afternoon report. I am keen to understand these better particularly as an indicator of likely market sentiment for the US market. One aspect is not clear to me is how the S&P E Mini Futures and Dow E Mini Futures (reported below to be +1.45% and +1.26%) relate to the later reference in your report: Overall, the ASX 200 fell -270pts / -5.62% today to close at 4456 - Dow Futures are trading down -821pts/-3.93%. Has the ASX 200 always followed the US Futures as closely as it seems to be doing lately? Secondly, would be interested in any views on why Stockland has fallen so sharply the last 2 trading sessions.” – Thanks Peter O.
Morning Peter,
Thanks for the kind words, it’s certainly been a testing time of late as the market moves more in a few hours than it usually does in a month, I’m sure later in the year we’ll probably be heard complaining how boring things have become!
Moving onto your question about US futures, the first reference is to how US futures closed during their day session whereas the later refers to how they are trading in their late / overnight market when we are trading - Indices are now basically 24-hour markets.
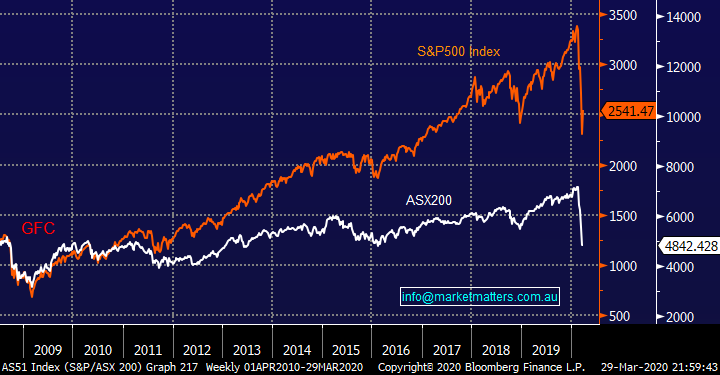
The chart below illustrates that we do have a reasonably large correlation to US stocks / futures, especially when they move significantly, and we are the major western indices that’s open and trading with full steam. Recently we’ve experienced a few sessions where the US futures have “locked” limit up & down in their late sessions meaning that investors / traders who want to trade in the US are often forced to use our market as a quasi-hedge before their daytime session commences, during these times we actually often magnify moves by US futures.
NB Locked limit up / down means the respective markets are not allowed to trade through these respective limits ~5% for a fixed period of time.
ASX200 v S&P500 Index Chart
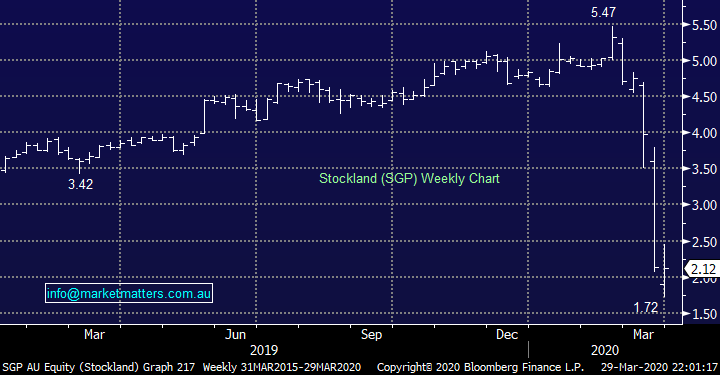
SGP have been hit very hard in recent weeks falling from ~$5.40 to a ~$1.80 low. They withdrew their FY20 guidance, most property stocks have, blaming uncertainties around COVID-19. SGP’s earnings (EBIT) are made up of 38% retail and 35% residential, obviously the retail component is under immense pressure while the residential component is a risk if the virus lingers, unemployment stays high and we enter a protracted recession, while that’s a possibility it’s not our thinking at the moment.
Gearing in SGP sits at a fairly conservative 26% and they have undrawn facilities of $850m with no debt to refinance this year. They will need to provide rent relief to tenants in their retail division while you’d expect some defaults in terms of lot settlements. It’s going to be a tough time for SGP however we’d argue this is being priced at current levels trading on a Est P/E of just 6x while yielding more than 12% unfranked.
That will change given earnings downgrades to come, however there is a lot of fat in those multiples.
MM is short term bullish SGP from current levels
Stockland (SGP) Chart
Question 3
“Hi, I have two questions.
1- The first is about Transurban & Sydney Airport. These are supposed to be Blue Chipper defensive stocks. When I look at their financials, they look terrible. Using Transurban as an example, their earnings are 1 cent and is dividend is 59 cents. All there dividends are much lower than their earnings, how do they sustain this. Also, their return on equity is low, their liabilities are 3.8 billion and assets 1.9. Why are they held in such high regards?
2 - What are your thoughts of Coca Cola as a defensive stock?”
Regards, Mark M.
Morning Mark,
A really good question and please forgive the longer answer, the simple comeback being that a Price / Earnings (P/E’s) multiple can be misleading when thinking about valuing infrastructure assets particularly toll roads.
Infrastructure assets are different to another business insofar as they are very expensive to build and in the case of a toll road, they are generally operated on a concession basis over a specific period of time before the asset is passed back to Government. So, the big cost to build the asset is accounted for over the life of the concession and this leads to a large annual (non-cash) depreciation expense. This effectively reduces the E in the P/E and makes the P/E look unattractive.
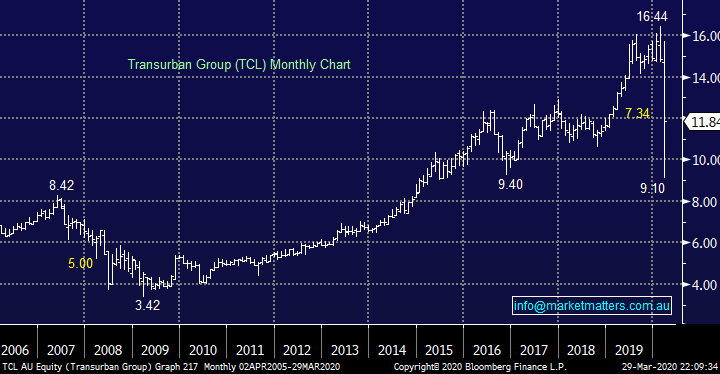
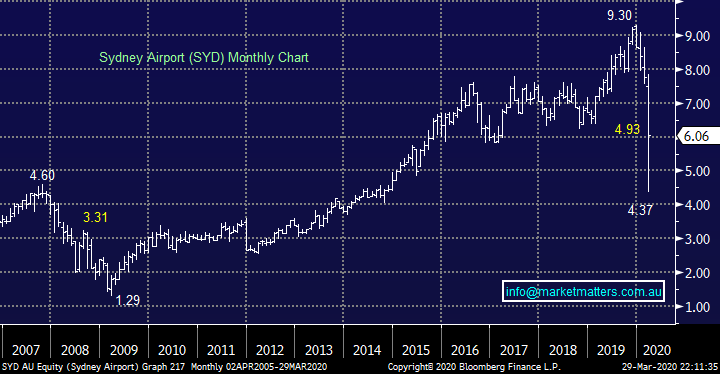
While not a silver bullet either when looking for an easy valuation metric for a business like Transurban (TCL) or Sydney Airports (SYD), its arguably better to use EV / EBITDA, which looks at enterprise value (which is market capitalisation + debt - cash, in other words, the total value of the company) / Earnings before interest, tax, depreciation and amortization. SYD trades on 17x EV/EBITDA versus an average of 21x while TCL trades on 23x EV/EBITDA versus an average of 28x
Ultimately when thinking about infrastructure assets, think about the cash flow they generate, the time the asset (s) will generate it for, the predictability and likely growth of the cash flow and their ability to underpin the asset with debt funding, which is what makes an infrastructure asset stack up. The reported earnings (E) are almost always significantly lower than this, hence the high P/E multiple. Both TCL and SYD carry high debt levels at a time when revenues will be hurt, more so for Sydney Airports. On the debt side, both look okay in terms of upcoming maturities.
Regarding return on assets, you are correct in saying that it is low, however offsetting that is stability / predictability. If you look at the return on assets for SYD for instance it’s about 3%, that is then geared (with debt funding) and we get a return on invested capital somewhere around 5-6%.
MM likes both SYD and TCL into weakness, with a preference for TCL
Transurban (TCL) Chart
Sydney Airports (SYD) Chart
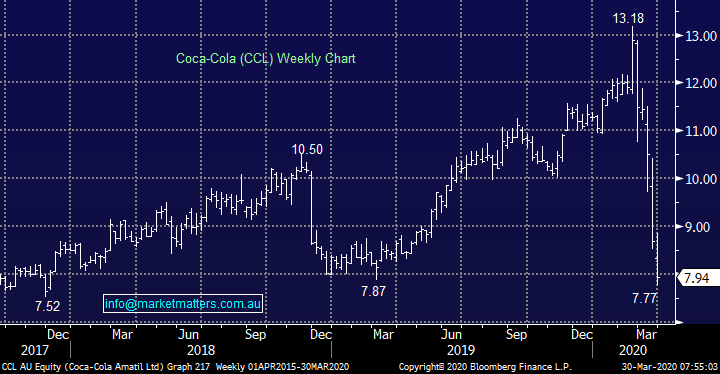
Coca Cola (CCL) has fallen largely in line with the market hence to us it’s not a defensive play in these uncertain times, but then again, many traditionally defensive style assets have been hit. We do see obvious support in CCL below $8 but MM is not a long-term fan of the business as we see diabetes becoming an increasing burden on the healthcare system, its already way ahead of smoking as a cost to the government hence increased taxes on soft drinks is just a matter of time in our opinion.
MM has no interest in CCL.
Coca Cola Amatil (CCL) Chart
Question 4
“I am at a loss to understand the recent trades/recommendations in Macquarie Bank. We have had "buy" recommendations 25/2/20 ($140) & 9/3/20 ($122) & a partial sell recommendation 27/3/20 ($87) for a 35% (approx.) loss. The sell recommendation is due to the "current volatility". Surely this "volatility" was evident in February & early March? Can you please clarify.” – Ian C.
Hi Ian,
I’m really glad you asked this head on question.
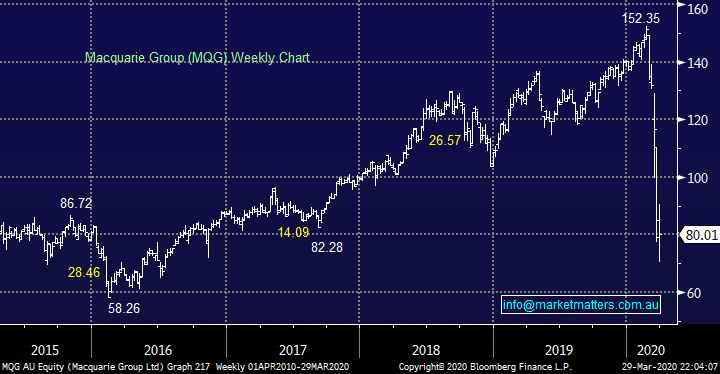
Firstly and importantly we don’t focus closely on whether MM is taking a loss or profit from a position, it’s more a case of whether this is the optimum stock / size that MM wants to hold at this point in time. We felt our position size in MQG was too large considering how COVID-19 had escalated further than we anticipated on a global scale. Acknowledging when you are wrong and taking losses is a vital part of successful investing. Over the coming days we’ll be writing about further changes across our portfolios as we look to improve the quality of our positioning across the board.
If in the next few days, we reallocate these funds into a stock we like at lower levels we will have added value / alpha to our portfolio – remember MGQ fell 11% from its early highs on Friday when we sold.
MM still likes MQG but with lower conviction
Macquarie Bank (MQG) Chart
Question 5
“Dear MM, A lot of your predictions are coming true. Good effort! The present situation seems to favour the supermarket trades. With people restricted in movements now, would MTS (IGA stores) benefit from this? Share price of MTS came down last few days, though up a bit before. What is your view of MTS short term?” – Gregory C,
Hi Gregory,
Firstly, thanks for the thumbs up, our main goal is to ensure MM adds value to our Portfolios to coincide with our general market calls.
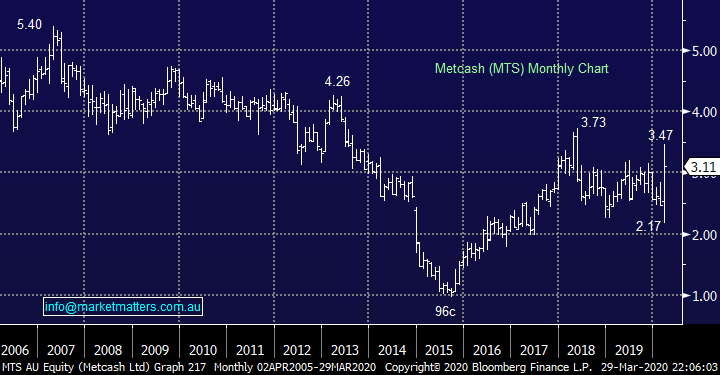
Metcash (MTS) through its convenient IGA stores is certainly well positioned to benefit from the COVID-19 pandemic but this is already reflected by the stocks appreciation in 2020 compared to most stocks who have simply plunged. Overall we feel MTS will underperform in 6-12 months’ time but short-term is clearly tricky, the longer the lockdown unfolds in Australia the better MTS is likely to perform - we took profit on our MTS position last week in the Income Portfolio because of these reasons i.e. we feel it’s time to look 6-12 months out.
MM feels the “easy money” with MTS is behind it.
Metcash (MTS) Chart
Question 6
“Just wanting a view on JIN it’s down 50% now. Should I cut my losses or hang tough. WHC has seen recent substantial shareholder buy ins (Lazard, prudential, vanguard and UBS) again I’ve held this all the way down. The substantial share buy ins must be a good sign? Do I stay in or go?” – Marvin C.
Hi Marvin,
Obviously, I cannot give any personal advice on these 2 stocks hence we have specifically conveyed MM’s thoughts on each at this point in time.
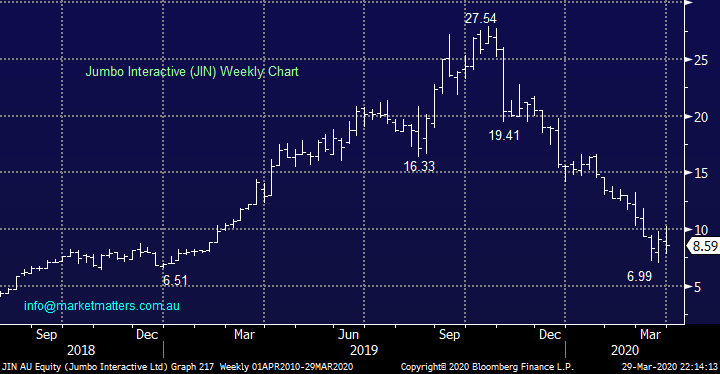
1 Jumbo Interactive (JIN) $8.59
JIN is a QLD based business that develops e-commerce and online retailing technology with a focus on on-line lotteries, clearly a growth area as we saw by the stocks surge through 2019. However, there are a few influences at play here with demand potentially increasing as casinos close but talk of banning the purchase of Lotto tickets with credit cards clearly a worry.
Overall, we believe the stock will be ok, but our concern is it’s not cheap trading on a P/E of 18.8x for 2020, not exciting compared to some of the bargains on offer after the market’s plunge.
MM is not interested in JIN at current levels.
Jumbo Interactive (JIN) Chart
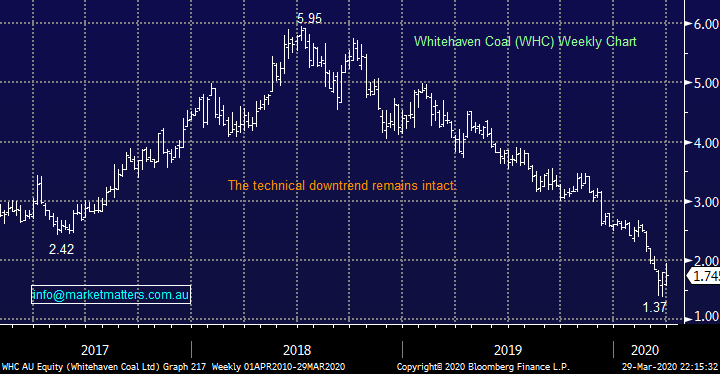
WHC has been under major pressure of late as the investor community moves aggressively away from fossil fuels, I think most of us would agree they’re not the future. From a valuation perspective WHC is relatively cheap and may easily bounce 20% in the blink of an eye but it’s not a stock we want to own long-term so looking for potential “bounces” makes no sense to us
MM has no interest in WHC.
Whitehaven Coal (WHC) Chart
Question 7
“Hi James, can you give me some idea of how you construct the MM Growth portfolio. There doesn’t seem to be a weighting to all sectors. I’m not being critical just trying to understand how best I can apply your portfolio to my own. I seem to be overweight resources and financials. Not really a good time to reduce weightings. Do you just buy something that looks good value and set the quantity at market weight/under/overweight? How do you find the market weight?” - Thank you, Marvin C.,
Morning Marvin,
Two good questions in one week, thanks! I have answered with a few simple bullet points:
1 – We are happy to be very overweight a sector if we feel it’s the place to be for the next 6-12 months e.g. Resources.
2 – We are happy to have zero exposure to a sector if we feel it’s set to underperform for the foreseeable future e.g. Real Estate.
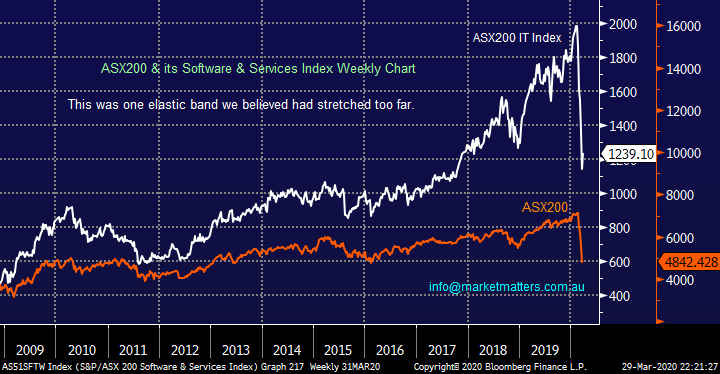
3 – We are comfortable switching from underweight to overweight sectors as they swing around over time e.g. we are now considering the IT sector after its given back much of its outperformance of the last decade, we had no exposure here before.
4 – in summary MM would rather have all of its eggs in a small basket and watch this basket carefully as opposed to follow traditional Portfolio Theory i.e. we are Active Investors.
ASX200 & ASX200 IT Sector Chart
Question 8
“Hi James, I enjoy your comments in the weekend publications. Could you please highlight the Market Weightings (%) on your Sector view please? Keep up your good work. Keep safe and healthy.” - Patrick Y.
Morning Patrick,
A question very similar to the previous one, it’s obviously an area of the service that needs some clarity, thanks for the heads up as we work on our website / IT offering, fingers crossed a new fresh MM service will be available early in the next Financial Year.
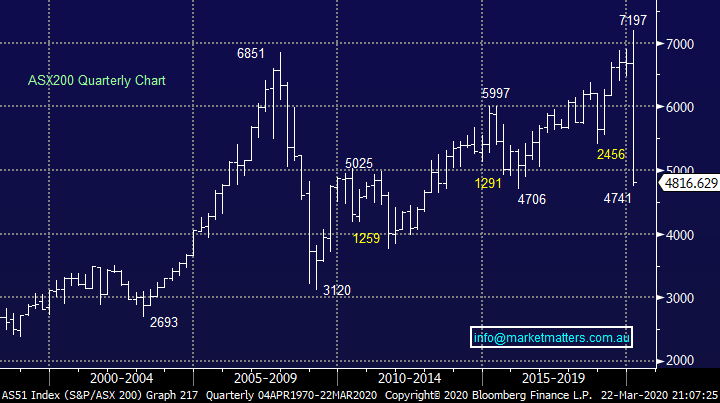
Over the course of this week, as we focus on our portfolio positioning across the MM Portfolios and write about them, I hope this question will be answered for you in a practical way.
ASX200 Chart
Question 9
“Hi James, this piece written by Mohamed El-Erian is an interesting read.....Don’t Read Too Much Into Stocks’ Sudden Rebound, by Mohamed A. El-Erian “ Investors should maintain caution instead of rushing back into risk.” : https://www.bloomberg.com/opinion/articles/2020-03-28/coronavirus-don-t-read-too-much-into-stocks-sudden-rebound “ - Kim B.
Hi Kim,
I actually have been listening / reading his pieces thoroughly over the last few weeks – he’s been largely on point.
The main takeout of what he’s saying now MM totally agrees with:
1 – When we start to beat COVID-19 equities will soar.
2 – Stocks that perform moving forward will look different to the post GFC bull market.
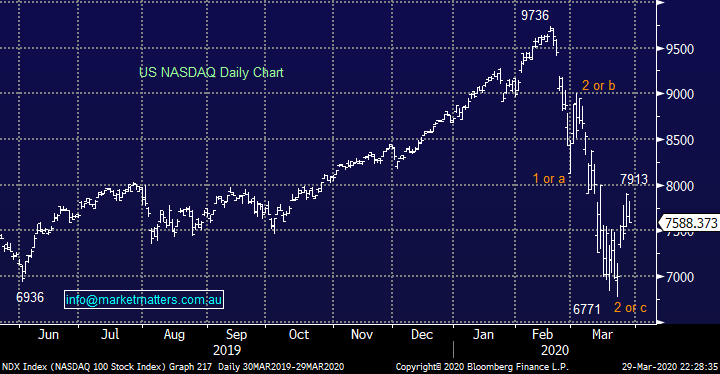
As you know we are 50-50 whether the likes of the US IT dominated NASADAQ have already made their 2020 lows, or whether one final look lower is about to unfold.
US NASDAQ Index Chart
Question 10
“More videos like today’s please. Also really enjoyed the video several months ago with guest from Bell Potter. This is a general question but to ask it I will give a specific example. When you recommend a relatively new stock, say XRO, do you look solely at its future potential? MM has XRO on its watch buying list despite a PE of 64, a d/e of 125, and a p/b of 27.” - Chris G.
Morning Chris,
Thanks, the Team at MM are keen to deliver more videos over these tricky times, it’s an excellent medium to deliver a specific message / view/
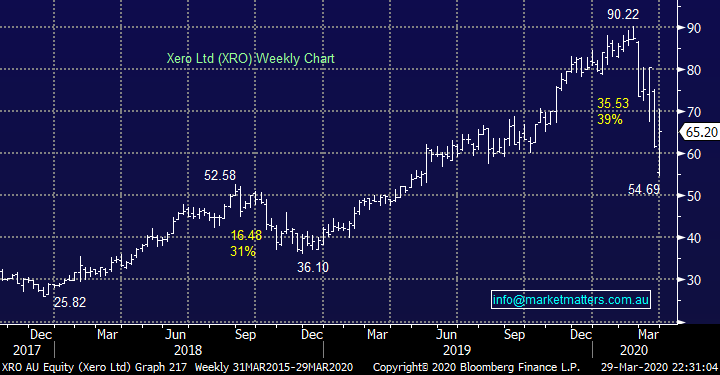
With regard to XRO its very much about both the now and future. As discussed above in the context of SYD and TCL, P/E’s are not always a relevant valuation tool, although they are simple and easy to comprehend. In terms of Xero, it’s all about number of users and the cost to acquire those users. XRO has net cash on its balance sheet and an excellent source of reoccurring revenue which is gold in today’s environment – with the stock having corrected 38% we believe value has now emerged after being too rich for much of the last 6-months.
We simply believe their online offering will continue to grow and in a few years’ time the stock will probably be trading above $100.
MM likes Xero (XRO).
Xero (XRO) Chart
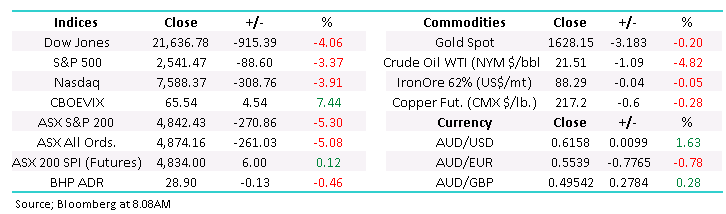
Overnight Market Matters Wrap
- The US equity markets recommenced its Coronavirus effect selloff, with the broader S&P 500 losing more than 25% from its peak in md-February, marking a new world record time to enter bear market territory.
- Friday’s battle was lost with the US Fed deploying its emergency lending programs however more ammo is likely needed to keep the US financial system afloat.
- Crude oil continues to slide, losing over 60% year to date as the current stockpile is overwhelming – hopefully we see some if this price action at our local bowser sometime soon to give us all some sort of relief!
- The June SPI Futures is indicating the ASX 200 to test the 4850 this morning, however with tougher rules in place set last night, the red sea seems more apparent.
Have a great day!
James & the Market Matters Team
Disclosure
Market Matters may hold stocks mentioned in this report. Subscribers can view a full list of holdings on the website by clicking here. Positions are updated each Friday, or after the session when positions are traded.
Disclaimer
All figures contained from sources believed to be accurate. All prices stated are based on the last close price at the time of writing unless otherwise noted. Market Matters does not make any representation of warranty as to the accuracy of the figures or prices and disclaims any liability resulting from any inaccuracy.
Reports and other documents published on this website and email (‘Reports’) are authored by Market Matters and the reports represent the views of Market Matters. The Market Matters Report is based on technical analysis of companies, commodities and the market in general. Technical analysis focuses on interpreting charts and other data to determine what the market sentiment about a particular financial product is, or will be. Unlike fundamental analysis, it does not involve a detailed review of the company’s financial position.
The Reports contain general, as opposed to personal, advice. That means they are prepared for multiple distributions without consideration of your investment objectives, financial situation and needs (‘Personal Circumstances’). Accordingly, any advice given is not a recommendation that a particular course of action is suitable for you and the advice is therefore not to be acted on as investment advice. You must assess whether or not any advice is appropriate for your Personal Circumstances before making any investment decisions. You can either make this assessment yourself, or if you require a personal recommendation, you can seek the assistance of a financial advisor. Market Matters or its author(s) accepts no responsibility for any losses or damages resulting from decisions made from or because of information within this publication. Investing and trading in financial products are always risky, so you should do your own research before buying or selling a financial product.
The Reports are published by Market Matters in good faith based on the facts known to it at the time of their preparation and do not purport to contain all relevant information with respect to the financial products to which they relate. Although the Reports are based on information obtained from sources believed to be reliable, Market Matters does not make any representation or warranty that they are accurate, complete or up to date and Market Matters accepts no obligation to correct or update the information or opinions in the Reports. Market Matters may publish content sourced from external content providers.
If you rely on a Report, you do so at your own risk. Past performance is not an indication of future performance. Any projections are estimates only and may not be realised in the future. Except to the extent that liability under any law cannot be excluded, Market Matters disclaims liability for all loss or damage arising as a result of any opinion, advice, recommendation, representation or information expressly or impliedly published in or in relation to this report notwithstanding any error or omission including negligence.


