Subscribers questions (SGP, CYB, WOW, TPG, TLS, SIQ, TGR, JBH)
The ASX200 is set to open down around 10-points on Monday, less than 1% away from fresh decade highs. With the exception of the usual bluster from President Trump, this time mainly around its future relations with the UK, market influencing news was relatively thin on the ground over the weekend.
One piece of data that did catch our eye at the end of last week was China’s Iron Ore imports falling 11.6% for the month of June as Beijing escalates its efforts to clean up their environment – as we know when the Chinese government targets a specific area / reform, they usually implement the plan with amazing efficiency – this is clearly a headwind for the likes of BHP, RIO and FMG.
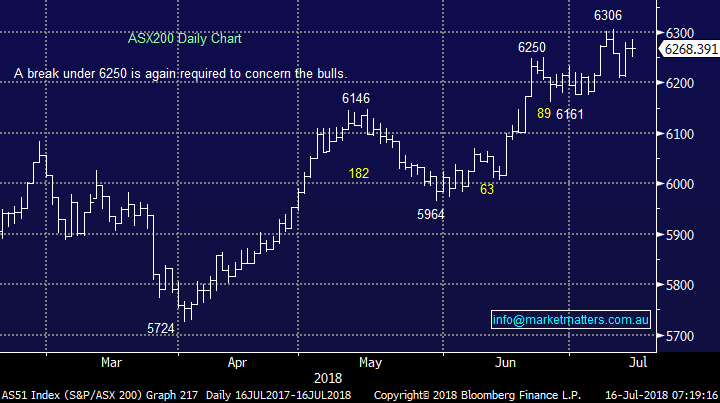
- We remain mildly short-term bullish the ASX200 while the index holds above 6250 but we remain in “sell mode” albeit in a patient manner.
However, I would note in the very short-term our “Gut Feel” thinks a correction back towards 6150 major support is likely – I appreciate a contradiction to the above line however markets are currently very choppy and often we find our ‘gut feel’ can offer better guidance than the current technical levels.
Thanks again for a healthy volume of questions particularly given school holidays are in full swing , as always please keep them coming but please excuse any brevity with today’s answers due to the sheer volume for a Monday morning.
ASX200 Chart
Question 1
“Good morning, not sure how much detail you are willing to go into, however you have recently mentioned that you are net sellers at the moment and moving to cash. In terms of the fund, can you give a guide on what percentage will be moved to cash allocation and how much will remain invested in company stocks?” – Thanks Tom N.
Hi Tom, the answer would have been a lot easier before the advent of ETF’s to protect / hedge / massage portfolio’s. Importantly, we write about our own portfolios meaning that any commentary is of a general nature only.
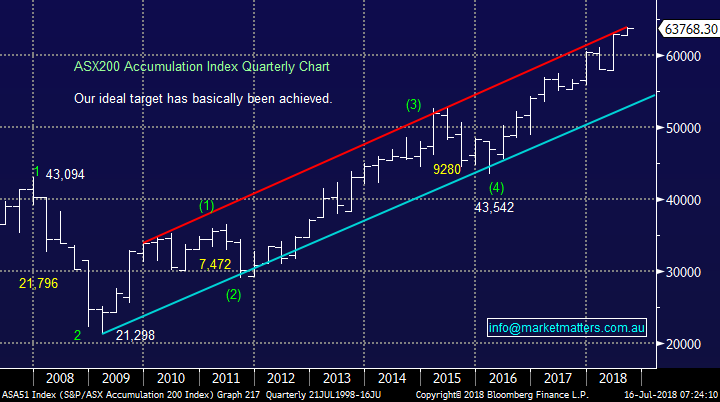
Looking historically, back in 2015 we moved to around 50% cash and remained underweight stocks until the week of the low in 2016 – note that degree of market timing unfortunately carries a little luck!
Currently in the MM Growth Portfolio we have 67% exposure to Australian stocks with 3% exposure to the $US, 5% in the BEAR ETF and 3% in the US BBUS strong Bear plus 22% in cash hence when the market is strong we are likely to underperform. If we subtract our short exposure of 8% but also consider that 3% of that is leveraged, we get a total short exposure of ~11%, meaning we are around 56% long at this point in time.
Moving forward we believe the Australian banks will outperform, especially against US stocks hence we are considering holding our 27% position in Australian banks and ideally increasing our BBUS (US Bear ETF) position into new highs. Our plan in broad terms is to hold stocks that we believe will outperform, particularly those paying sensible dividends while offsetting market risk through ETFs. At this stage, an equivalent of around 50% minimum cash allocation is likely but as touched on above its make up is expected to be a mix of cash and negative facing ETF’s as we search to add value (alpha) if / when a pullback does unfold.
ASX200 Accumulation Index Chart
Question 2
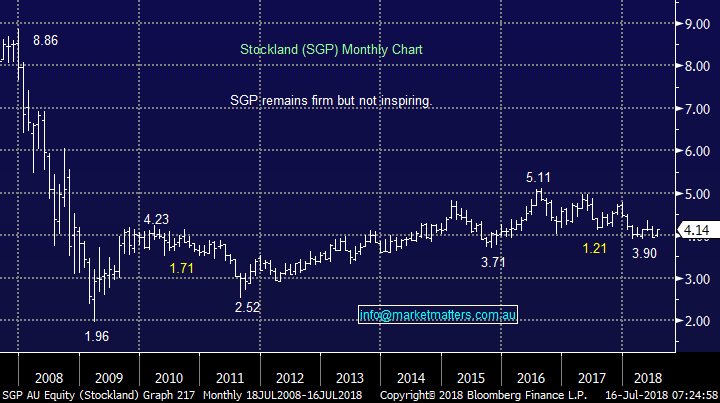
“Your thoughts on why SGP % trend was equal or above ASX200 for the three years to Dec 2017 and in the 6 months since then has fallen 20% below?" Chris G.
Hi Chris, there is no doubt SGP is suffering from negative sentiment surrounding the Retail, Residential and Retirement Living sectors currently playing out in Australia while increasing global interest rates are slowly but surely catching up on the “yield play” parts of the Australian market - a troublesome double whammy for stocks like SGP, outweighing its attractive dividend yield (6.9% forecasted for FY19) and the fact its trading at a 4% discount to NTA.
- In the US while the S&P500 has rallied over 65% in the last 5-years their property sector is unchanged – rising interest rates is not property’s friend.
- The Australian property sector is up over 10% this year with SGP the standout underperformer – we have no interest in the sector at this stage in the cycle.
Individually SGP is a concern short-term with a mild earnings upgrade early this month failing to excite investors, technically continued drift back under $3.90 would not surprise.
Stockland (SGP) Chart
Question 3
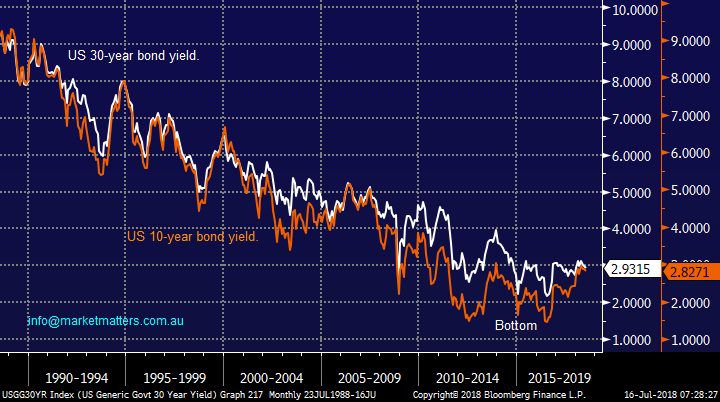
“Greeting MM Team, can you offer any advice with respect to gaining exposure (directly or indirectly) to 10-year and 30-year US Govt. Bonds?” – Scott T.
Hi Scott, the most efficient way we find simply buy / sell the futures contract of either of the respective bonds but over the last decade the 10-years have become the main trading / investing vehicle hence we would tend to look there – the below chart shows their correlation on a yield perspective is extremely close.
- Remember as interest rates rise bond prices fall i.e. inverse relationship.
Alternatively investors can consider bond ETF’s but careful research is required to ensure the respective vehicle chosen can reflect your particular view on bonds / interest rates moving forward and remember to check the FX exposure.
https://en.wikipedia.org/wiki/List_of_Australian_exchange-traded_funds
US 10 & 30-year Bond Chart
Question 4
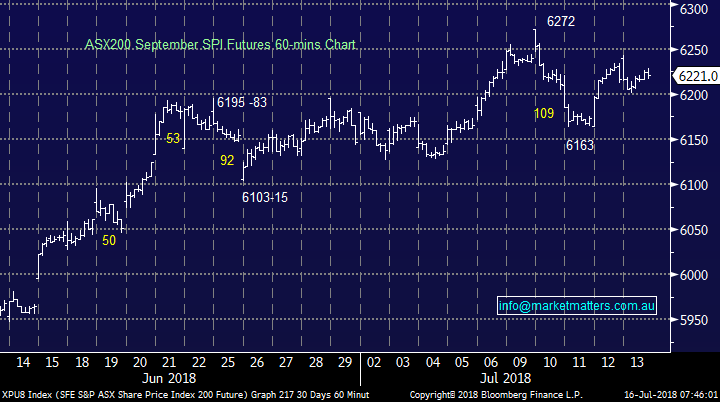
“Hi MM, third day that positive futures have not resulted in a matching rise in the market. Where’s the selling pressure coming from and is this just profit taking?” – David H (sent July 11th).
Hi David, that’s obviously a question which we can unfortunately only have an opinion on, not the actual answer.
We feel fund managers allocated their “spare” dollars into local stocks before the school holidays which kicked stocks sharply higher at the months start. Hence the intra-day moves are now more reflective of what traders think comes next, as opposed to the present.
- The SPI currently often fades its overnight “gap” because its looking forward to the next 24-48 hours, not back at yesterday’s activity which is already priced in.
ASX200 September SPI futures Chart
Question 5
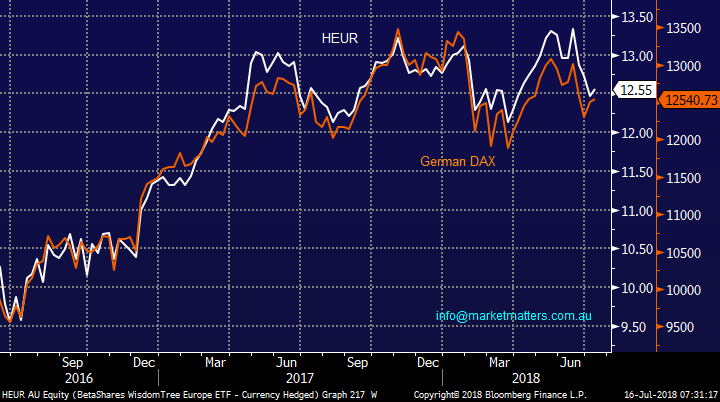
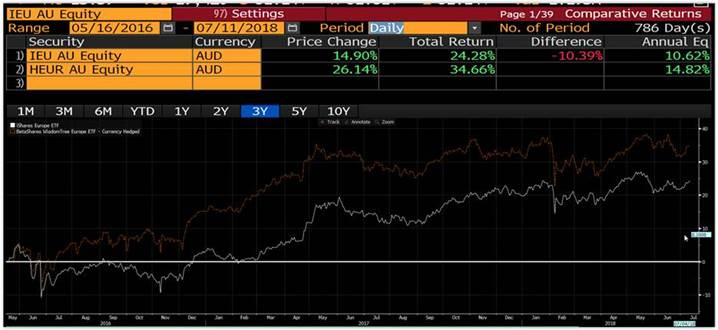
“Hi Market Matters Team, what is the easiest/most efficient method, for an Aussie investor to buy DAX exposure? Would you take any pro-Dax exposure Hedged / Unhedged?” – Best Regards, Matt C.
Hi Matt, we like the BetaShares WisdomTree Europe ETF (HEUR) – this is a currency hedged ETF, with the weightings heavier on the dividend stocks across the Eurozone.
Country allocation:
- France 29.3%
- Germany 24.9%
- Spain 15%
The chart below shows the HEUR tracking the German DAX closely. The other ETF we’ve used in the past is the IEU from iShares which tracks the top 350 companies in Europe, however the HEUR has outperformed over the past 3 years.
BetaShares WisdomTree Europe (HEUR) ETF v German DAX Chart
Question 6
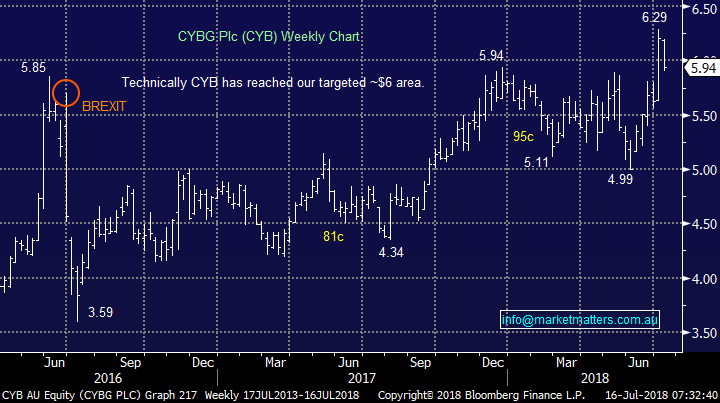
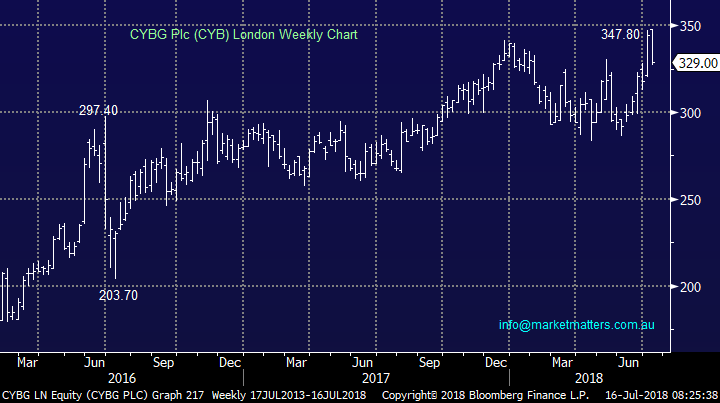
“Good morning James and MM team, Last Friday, I sold out of CYB.AX around $6.26 with my entry price being $5.71 back in Christmas 2017 so from an investment holding period point of view, the return of 10% (inclusive of 0% franking dividend) is OK. After hitting a new multi-year high of $6.29 the stock has retreated around 6% towards the 10 days moving average. Would you agree that $5.90 becomes the new support level for the stock in the medium term because there’s 2 major events happening around for this stock. First being internal which is the merger with Virgin Money pending shareholders’ approval. Second being the continuous uncertainty around Brexit talks and Theresa May have now lost more than a third of her sitting cabinet. How will these 2 major events influence the stock in the medium term and what levels are MM looking at for a potential re-entry into the stock.”- Thanks – regards, Tianlei J.
Hi Tianlei, your correct there’s certainly a lot of external influences on CYB at present which is likely to create some short-term volatility in the stock. We like the Virgin Money deal and we may consider re-entering into weakness – the stock’s already corrected almost 6% from the months high.
- We will consider re-entering if the stock trades back down below 300GBP in the UK, around a 14% correction. – see second chart.
CYBG Plc (CYB) UK & Australia Chart
Question 7
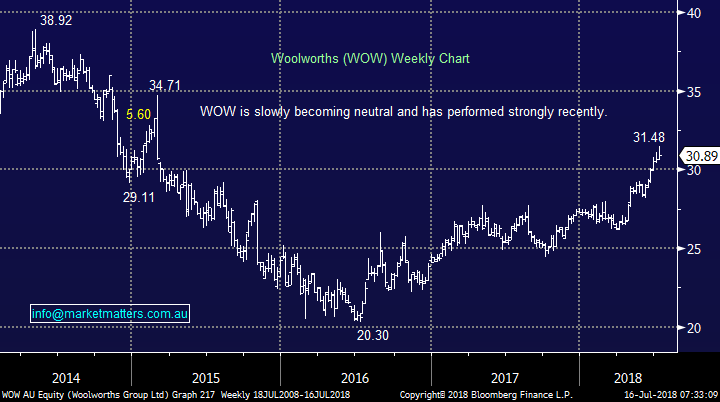
“Hi. A while back you commented that WOW was heading down to $20. Since then it’s gone up. I sold some calls which are now well in the money. I could buy them back at the end of the month IF I thought they were going to the moon, which they appear to be doing. They are due for a comment on as it’s been very, very quiet where they are concerned.” - Thanks Lincoln C.
Hi Lincoln, your correct WOW has been a tricky stock for MM over the last 4-years.
- When it was trading around $35 in 2014 we called it down towards $20 – a tick.
- In 2016 we positioned ourselves to buy below $20 – too fussy and a miss.
- When the stock failed (initially) close to $28 in 2017 we thought it was again headed back towards $20, clearly wrong.
We feel monies have chased into both WOW and WES as relative “safe” places to buy in a fairly rich market.
- We are neutral at present expecting rotation between $29.50 and $32.50 but this not a high conviction opinion.
Woolworths (WOW) Chart
Question 8
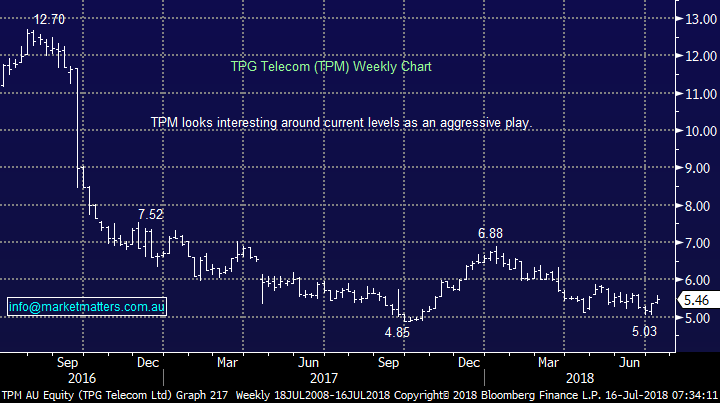
“TPG I have a position in TPG @$6. Luckily my stops were under $5 as it has recovered over the past week. I bought post your 20/03/2018 afternoon report as I did not have TLS and liked the TPG story. My question now is to cut and run and take the small loss or hang in there. Perhaps just keep a tighter stop should its recovery reverse. I know also have TLS at $2.71” – Bruno F.
Hi Bruno, we like TPM as an aggressive play / trade around current levels – our initial target is ~$5.80 but $6.80 would not surprise.
- Similarly we still believe TLS will outperform the ASX200 over the next 12-months.
TPG Telecom (TPM) Chart
Question 9
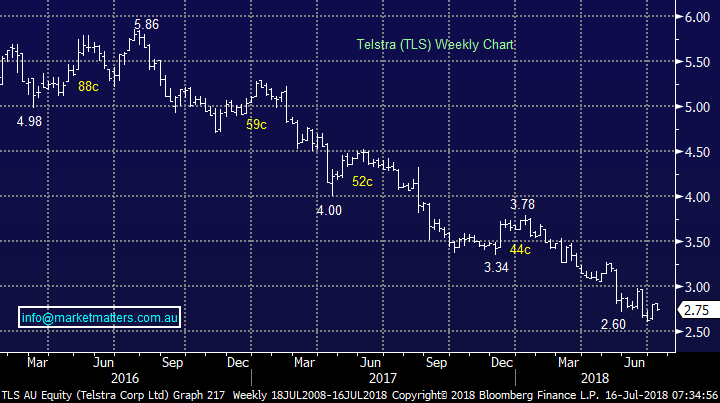
“Are you sure Telstra outperform Bernstein $14 seems a bridge too far” – Mark K.
Hi Mark, Berstein is an overseas research house and they were quoting Telstra in terms of their ADR price. Currently in the US, TLS trades in the over the counter market as an American Depository Receipt (ADR) at $US10.19. By calling it to $US14, they are predicting a ~40% rally in share price.
We do think TLS will outperform the ASX200 over the next 12-months however we are not expecting a rally as strong as Berstein – we are sellers above $3.50 while buyers of weakness assuming no fresh negative news – there’s certainly been a decent volume of that in the last few years.
Telstra (TLS) Chart
Question 10
“Hi James, Harry and the Team, I was wondering, if at all possible, if you could find me a ticket in the Shaw and Partners Box/ Lounge for the Manly / Melbourne game at Lotto land Brookvale on this weekend?” - Sincerely Matthew K.
Hi Matthew, sorry I’m late with this reply but you never know as we often say “if you don’t ask you never get!”. I did go to the game on Saturday night, as did Harry and we watched a second string Storm team pip us by 1pt. A least the beer was cold and the seats were warm. Maybe another game!
Question 11
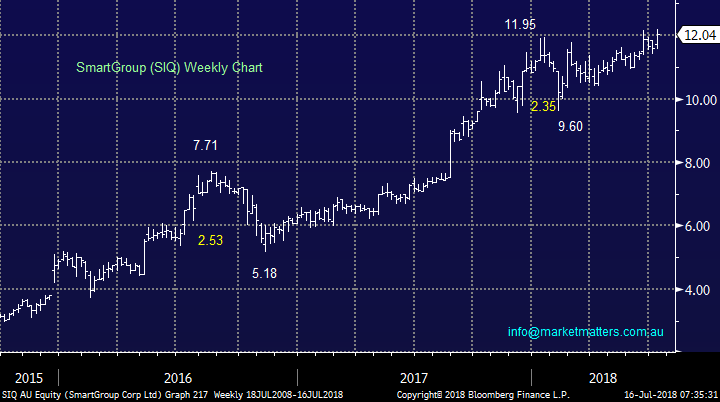
“Hi MM, do you have any views on Smart Group as a growth stock. Don’t have it in my portfolio and was wondering at what price would it be attractive” – Mike D.
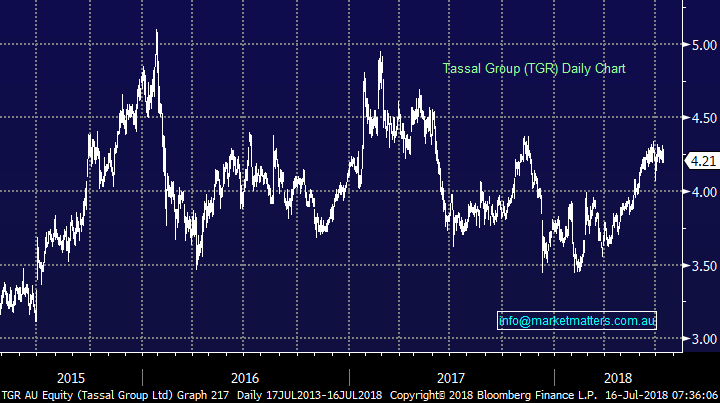
“Hi MM Team, could I get both a technical & fundamental view on Smartgroup (SIQ) & Tassal (TGR) plus are they on your radar / watchlist? – Thanks Tim C.
Hi Mike / Tim.
Smartgroup (SIQ) is one of Australia’s largest providers of lease offerings / salary packages for the government, health and corporate sectors. Both the company and stock have performed strongly but it’s certainly not in the cheap basket at present and from a risk / reward perspective we prefer to look for weakness to consider accumulating the stock.
- Technically we believe SIQ is now vulnerable to a decent correction back below $10 i.e. we are currently neutral / negative.
Smartgroup (SIQ) Chart
Tassal (TGR) is neutral to MM at present with no major trends / opportunities over the last 2-years.
Tassal (TGR) Chart
Question 12
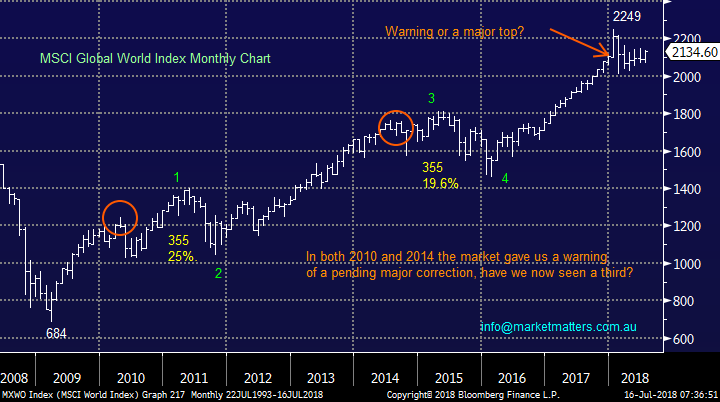
“Hi James Just read your morning report about the inverted yield curve and the possibility of an impending market downturn. One thought that occurs to me is that a crash is unlikely due to the billions of dollars continually being poured into the stock market via superannuation and 401 k plans. The money has to go somewhere and the stock market is really the only place it can go. Any thoughts about that?” – Geoff R.
Hi Geoff, I totally understand your comments and it probably explains why stock market bottoms tend to rally strongly once they have been established but tops roll over slowly. The other important consideration is interest rates. You make mention of stocks being the only place to invest, however bond yields in the US have now started to become ‘relatively’ more attractive. The S&P 500 yields 1.82% while a risk free US 10 year bond will pay 2.83%. The yield on the 10 year was as low at ~1.40% at the lows, which made stocks more attractive from a relative sense at that time, however as rates rise that attraction becomes less obvious – part of the reason why interest rates are so important.
Looking at the stock market, the 2 pullbacks of ~20% since 2009 illustrate corrections do occur, even with apparent ongoing increasing demand for stocks.
MSCI World Index Chart
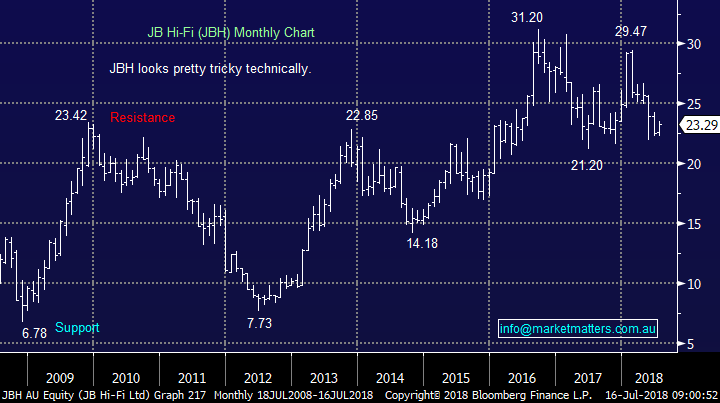
Question 13
“Team, enjoy the daily notes. Question - what is your view on JBH? A couple of points I pick up on. It is hated. It has given NPAT guidance, has EPS therefore of c$2 so 5.77% dividend yield based on historical payout. PE ratio on FY19 consensus of 11.0 & down 30% from its high. Typically correlates to global comp Best Buy but if you overlay share price and PE charts in Bloomberg the disconnect has now never been wider for JBH. The short interest is a record yet JBH has flagged potential buy back or returns to shareholders.” – Rod F.
Hi Rod, you’r on the money with its short position which has increased to over 18%, only Syrah Resources (SYR) is more shorted.
We are neutral JBH with our concern over household debt weighing on our view for the whole sector. We can see some volatility / sharp bounces in JBH for the reasons you have mentioned above but it feels like some bad numbers maybe coming around the corner.
JB HI-FI (JBH) Chart
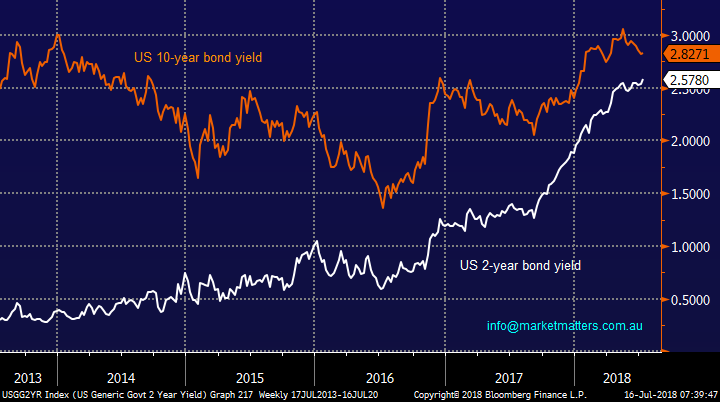
Question 14
“Hi James, Many thanks for your explanation of the inverted bond yield curve in Friday's morning report. I find this type of information extremely valuable and provides extra value to the subscription.” - Regards, John D.
Hi John,
We appreciate the feedback, one loud and clear message MM picked up from our recent subscriber survey was more educational content would be appreciated and the topical US yield curve clearly fits the bill.
As the below chart illustrates the gap between the US 2-year and 10-year yields has been narrowing significantly in 2018. Historically when they invert and the 2-year rate surpasses the 10year it’s a sign of a looming recession i.e. the Fed has tightened rates too fast / hard.
At MM we feel the likelihood is when they cross an equity market pullback is likely to be self-fulfilling as many fund managers watch the indicator extremely closely.
US 2-10-year yield curve Chart
Overnight Market Matters Wrap
· The US equity markets closed marginally higher last Friday, as little to no news headlines on the current ‘trade war’ situation helped the indices end their sessions in positive territory.
· It was noted however, that the current situation reduced US consumer confidence levels, leaving the US$ mixed against its peers.
· BHP is expected to underperform the broader market this morning, after ending its US session down an equivalent 0.65% from Australia’s previous close towards the $33.10 level.
· The September SPI Futures is indicating the ASX 200 to open with little change this morning, testing the 6270 level.
Have a great day!
James & the Market Matters Team
Disclosure
Market Matters may hold stocks mentioned in this report. Subscribers can view a full list of holdings on the website by clicking here. Positions are updated each Friday, or after the session when positions are traded.
Disclaimer
All figures contained from sources believed to be accurate. Market Matters does not make any representation of warranty as to the accuracy of the figures and disclaims any liability resulting from any inaccuracy. Prices as at 16/07/2018
Reports and other documents published on this website and email (‘Reports’) are authored by Market Matters and the reports represent the views of Market Matters. The MarketMatters Report is based on technical analysis of companies, commodities and the market in general. Technical analysis focuses on interpreting charts and other data to determine what the market sentiment about a particular financial product is, or will be. Unlike fundamental analysis, it does not involve a detailed review of the company’s financial position.
The Reports contain general, as opposed to personal, advice. That means they are prepared for multiple distributions without consideration of your investment objectives, financial situation and needs (‘Personal Circumstances’). Accordingly, any advice given is not a recommendation that a particular course of action is suitable for you and the advice is therefore not to be acted on as investment advice. You must assess whether or not any advice is appropriate for your Personal Circumstances before making any investment decisions. You can either make this assessment yourself, or if you require a personal recommendation, you can seek the assistance of a financial advisor. Market Matters or its author(s) accepts no responsibility for any losses or damages resulting from decisions made from or because of information within this publication. Investing and trading in financial products are always risky, so you should do your own research before buying or selling a financial product.
The Reports are published by Market Matters in good faith based on the facts known to it at the time of their preparation and do not purport to contain all relevant information with respect to the financial products to which they relate. Although the Reports are based on information obtained from sources believed to be reliable, Market Matters does not make any representation or warranty that they are accurate, complete or up to date and Market Matters accepts no obligation to correct or update the information or opinions in the Reports. Market Matters may publish content sourced from external content providers.
If you rely on a Report, you do so at your own risk. Past performance is not an indication of future performance. Any projections are estimates only and may not be realised in the future. Except to the extent that liability under any law cannot be excluded, Market Matters disclaims liability for all loss or damage arising as a result of any opinion, advice, recommendation, representation or information expressly or impliedly published in or in relation to this report notwithstanding any error or omission including negligence.
To unsubscribe. Click Here


