Subscribers questions (MXWO, EVN, RRL, ABP, PLS, ORE, SYR, NBI, 700 HK, ALX, TCL, IPH, LNK, BUB, NCM, STO, NST, SIQ, BBOZ)
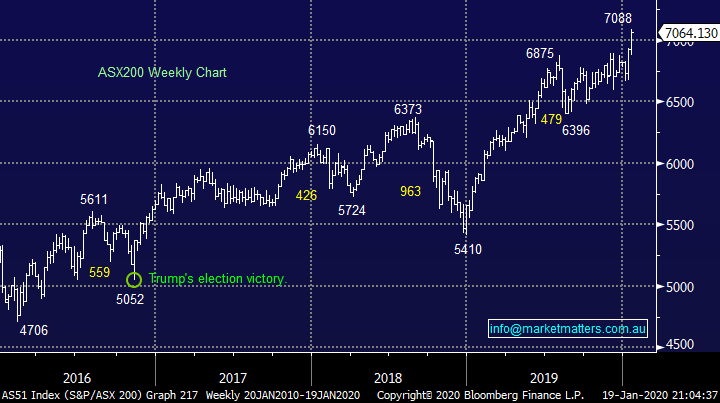
The ASX200 continues to rally higher with almost increased momentum and the psychological 7000 level is already well and truly in the rear-view mirror. As we enter reporting season volatility on the stock level is likely to become elevated but at this stage with official interest rates flagged to hit 0.25% by mid-year the tailwinds for equities remain in place – equities remain a far more appealing asset class than fixed interest at this point in time.
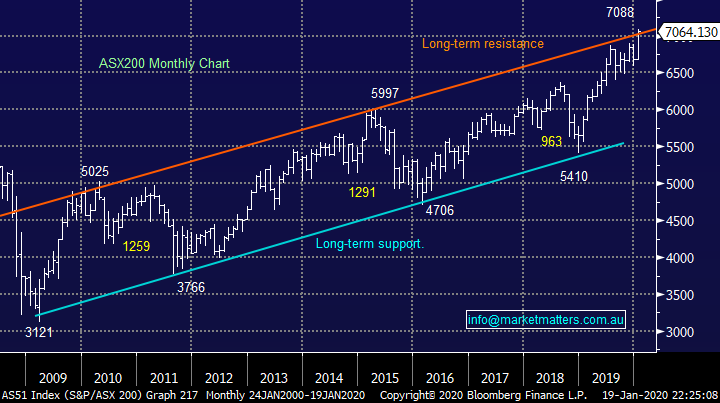
The current P/E (valuation) expansion unfolding in the stock market is largely liquidity driven making it a very tricky job to put a fair value target on the index hence we will continue to look at specific stocks as we remain basically fully committed to the market. As we can see below the market provides a decent correction every year and presently it feels to MM the next time investors will become nervous will be triggered by bond yields.
MM remains bullish the ASX200 while it can hold above 6930.
On Saturday morning the SPI futures were pointing to an opening up another +0.5% as BHP surged through $41 implying the resources are set for a day in the sun.
Thanks again for the questions, again I’m delighted by the volume / interest as we commence 2020, the Year of the Rat is looming next weekend in the Chinese calendar, it feels like its going to a fascinating time in financial markets.
ASX200 Index Chart
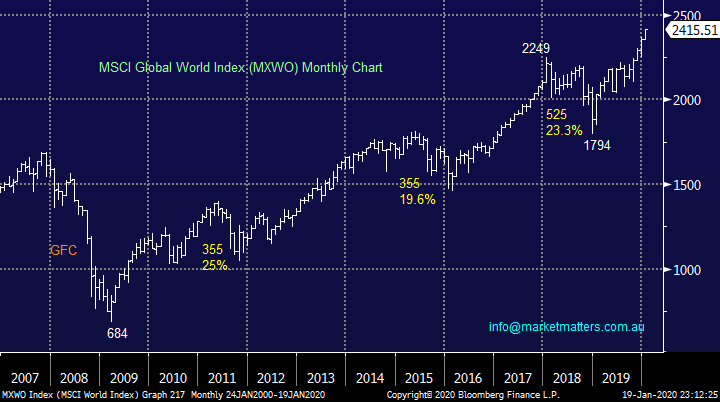
As we all (hopefully) know global equities are surging to fresh all-time highs and investors should be mindful that statistically selling markets in the relatively early throws of a break out to the upside is not an ideal time to be fading the move and as we can see below the post GFC tops were all formed during periods of diminishing upside momentum with early 2018 arguably the most tricky turn to foresee.
At this stage stock market gains remain very focused in the perceived top quality large end of town, the US market now boasts 3 trillion companies in $US (Apple, Microsoft & Google) and these same companies plus Amazon make up an incredible 15% of the entire S&P500. History tells us its not until the market starts chasing the small end of town do indices usually start to become vulnerable.
MSCI Global World Index (MXWO) Chart
Question 1
“With recent world volatility I'm looking for a Gold investment that pays a dividend and is fairly priced. I note EVN may be in this category? Any advice?” – Mike C.
Hi Mike,
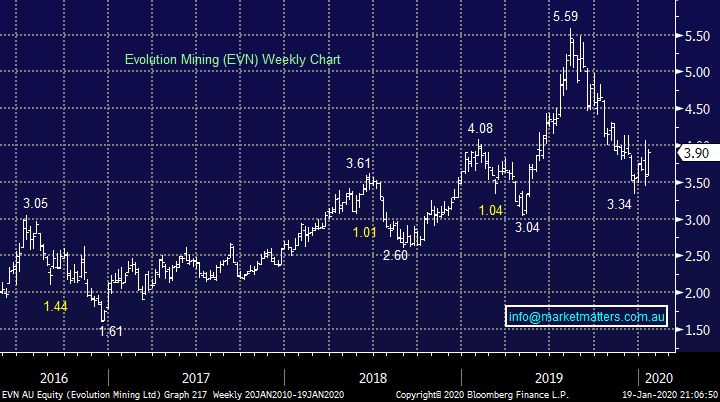
MM owns EVN in its Growth Portfolio but it’s been a fairly bumpy ride as can be seen below, we went long after it had corrected over 15% only to see the shares fall substantially further illustrating that the gold sector itself is a very volatile sector.
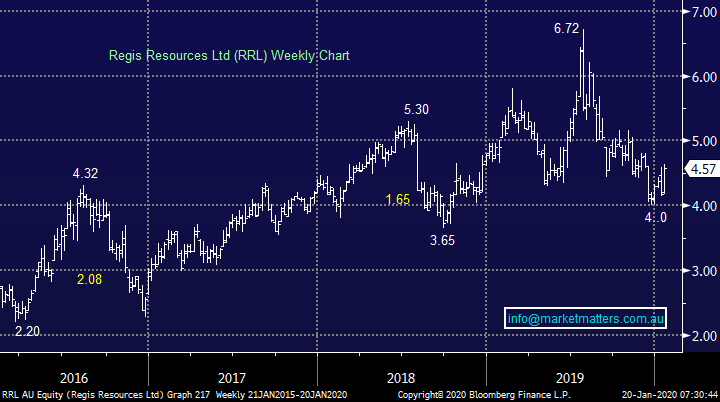
EVN is estimated to yield ~2.7% fully franked over the next 12-months while say Regis Resources (RRL) is at 3.5% while the heavyweight Newcrest’s (NCM) yield is far more meagre. In the past we’ve regarded the gold sector as an active play looking for capital gain but now like the core of the resources sector, they do offer some relatively healthy yield, especially compared to cash.
History tells us to buy gold stocks when they look heavy and that’s certainly now, as a yield play I’m not convinced but both EVN and RRL look ok at current levels but we must watch bond yields carefully, when they do eventually turn up gold stocks might come under some initial pressure.
Evolution Mining (EVN) Chart
Regis Resources (RRL) Chart
Question 2
“Hi Just a question for your next report. I’m looking at Abacus (ABP) as an income play as an alternative to a term deposit. From my reading, they have changed their business strategy and appears appealing. I suspect there may be not large capital gains, but the yield looks attractive. I’m interested in your thoughts.” -Thanks Chris F.
Hi Chris,
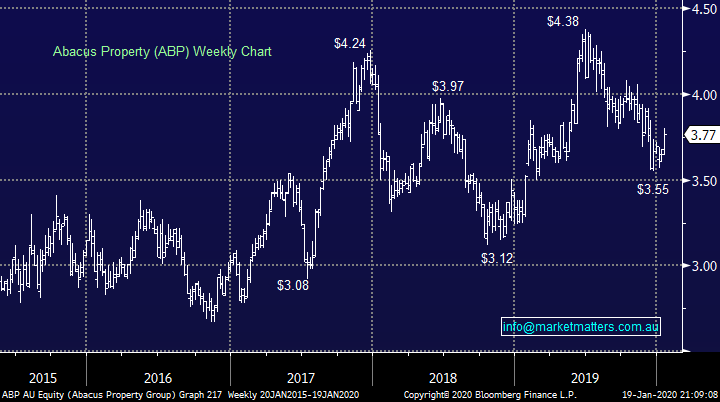
Property group ABP is forecast to yield just over 5% unfranked over the next 12-months, certainly attractive in today’s environment. We do hold Abacus Property (ABP) in the MM Income Portfolio and your right Chris, they have made a conscious change progressively over the past few years from being a diversified REIT to being more focussed in self-storage and office assets. In 2016 they had ~50% of their funds in storage and office and today they hold around 80% of their assets across these areas. They still hold some retail assets however they’ve become a lot more negative on this part of the market in recent times, and it’s an area they’re unlikely to focus on in the future.
They’ve made a few recent acquisitions having bought 99 Walker Street in North Sydney at the end of last year for $311m, which is their largest asset to date, buying it on a cap rate of 5% (in other words, it generates a yield of 5%). Their office exposure should provide base line yield while self-storage is where they can differentiate / add value. In the longer term, I’m less bullish on office versus self-storage. Thinking more broadly, and Hamish Douglas from Magellan is good at doing this, as virtual reality becomes more mainstream, it’s easy to see less demand for traditional office buildings in expensive CBD locations whereas self-storage will benefit from the shift towards smaller higher density residential footprints. Market Matters income portfolio: https://www.marketmatters.com.au/new-income-portfolio-csv/
MM remains bullish on ABP for income
Abacus Property (ABP) Chart
Question 3
“Hi guys, hope you had a great Xmas and hope the New Year is great. My question involves choosing a suitable group of Hybrids to replace my Term Deposits. The best I get now is 2.10% at present, but I am sure when it is renewed in 6 months, this will diminish. I realise you can't offer specific advice, but some sort of indication of what the best Hybrid is or? investment to replace TD.” – Geoff.
Hi Geoff,
I covered some questions on Hybrids in the Income Note last Wednesday. To recap, when thinking about a hybrid security we need to understand the drivers of returns. 1. The issuer, how secure are they? Most investors stay in the bigger bank hybrids which are much the same, and that security issue is less relevant. 2. Type of security. There are generally two types, a tier 1 security or a tier 2 security. Tier 2 is safer; more debt like with less convertibility, so they pay lower rates while Tier 1’s are what the banks have generally been issuing given higher capital requirements. To keep things simple, tier 1 securities are the most common, so comparing these is probably most relevant & 3. Duration, the longer the time to first call date, the higher the yield should be, more time for things to go wrong.
Here’s the most attractive hybrids as of today with mixed durations. Shorter dated, all things being equal mean safer, less volatility.
Short Term (1.9 years): WBCPG $104.49, yield to first call date of 3.43%
Medium Term (4.3 years): CBAPH $103.78, yield to first call date of 3.82%
Long Term (~6-7 years): AMPPB $100.50, yield to first call date of 5.54%, MQGPD $106.96, yield to first call date of 4.17%, CBAPI $101.38, yield to first call date of 4.11%
For a full hybrid pricing sheet thanks to the Shaw & Partners Income Team – click here
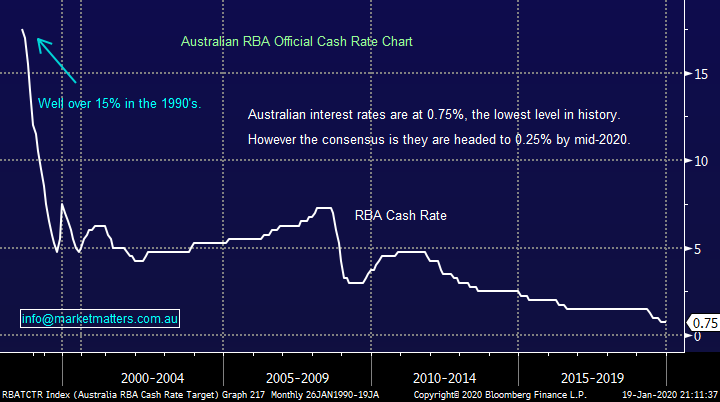
RBA Official Cash Rate Chart
Question 4
“Would be interested in your current view of the lithium mining space such as PLS, ORE, AJM, GXY etc. Any value here they've all fallen a long way in the last two years but seem to be on the uptick now.” - Cheers, Shannon N.
“Could you please provide some feedback on the move in lithium and graphite stocks such as SYR, PLS and GXY. Is this the beginning of something or just a pump and dump” – thanks Arthur H.
“Hey James, I’m not a lithium man but the below may contradict your report this morning for those that are waiting to trade.” - Cheers mate : https://investorintel.com/sectors/cleantech/cleantech-intel/the-ev-downturn-looks-to-be-over-as-china-ev-sales-rebound-in-december-2019-and-subsidies-look-safe-for-2020/
Hi Guys,
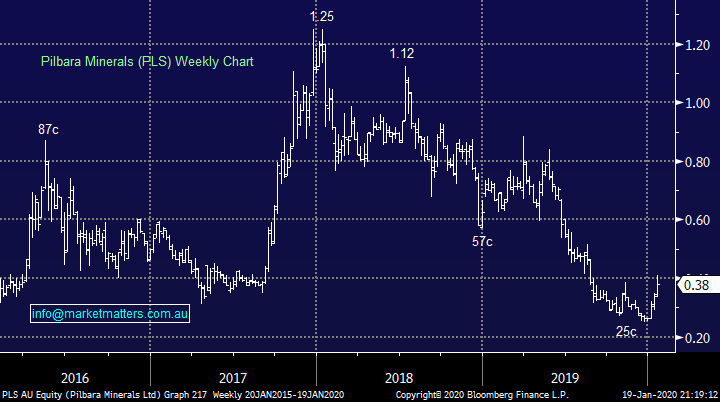
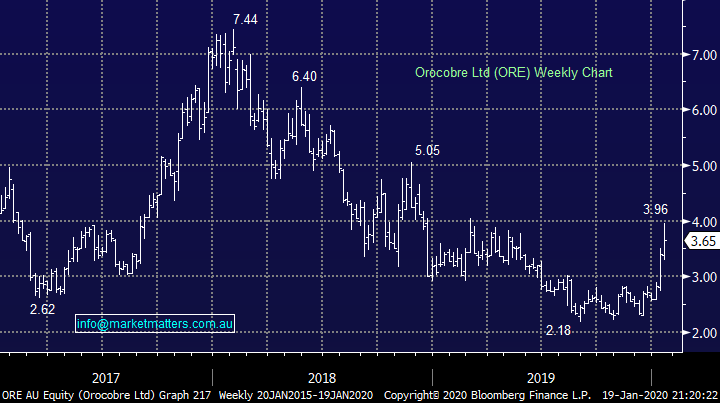
Lithium stocks have certainly enjoyed a return to the winners circle over the last few weeks albeit from an extremely low base, an enormous short position in a number of the names is likely to have magnified the upside squeeze e.g. Orocobre (ORE) 13.8% and Pilbara (PLS) 7.9%. Importantly these shorts illustrate the professional traders are still bearish many names in the sector.
The link in the 3rd question above certainly makes some interesting bullish reading although a few months doesn’t make a trend i.e. a number of industries have enjoyed a pickup in activity since the US – China resolution on trade. Electric vehicle (EV) stocks have soared led by Tesla in recent weeks and we feel they may be a better way to play the economic evolution because the last few years illustrated how easily the supply tap can be turned on for lithium.
At this stage I stick with our conclusion in last Wednesdays International Report: “However, for the shorter-term traders I’m sure 2020 will provide some solid risk / reward trading opportunities in the likes of PLS and ORE but it’s tricky here following their recent pop higher.”
ORE has already fallen almost 12% from last week’s high, arguably a good time to jump on board for the bulls.
Pilbara Minerals (PLS) Chart
Orocobre (ORE) Chart
Question 5
“Hi there James and the team, what does it mean when a company or individual becomes a substantial shareholder of an equity and then a few days or a week later cease to become a substantial shareholder? The example I'm looking at is Syrah (SYR). Credit Suisse purchased 24th December 2019 21,372,259 shares and appear to have sold them on the 3rd January 2020. Does this have any meaning other than quick profit taking or the like?” – Kim B.
Hi Kim,
A substantial shareholder notice is lodged when a holder has more than 5% of the company, while they cease to be a substantial holder with less than 5%, and a notice is also lodged. The notices are valid but more valid when it’s not an investment bank lodging them. Ultimately, an investment bank like Credit Suisse can be holding on behalf of others and reporting for a number of underlying entities that have agreements in place with CS.
In short, worth keeping an eye on however when it’s an investment bank, it holds less relevance. Below are current top holders of SYR according to Bloomberg. Aussie Super, the last time they bought was in July of last year when the company raised capital. Credit Suisse still hold 4.73% of the company, so when they ceased to be a substantial holder, they did not sell all shares, simply reduced below the 5% threshold.
Top 5 holders in SYR
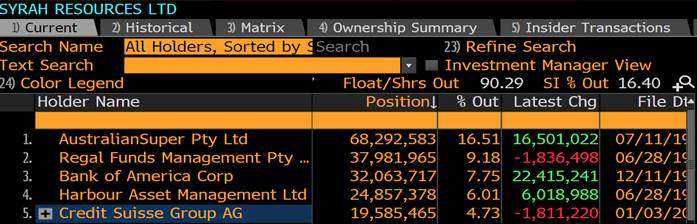
Source: Bloomberg
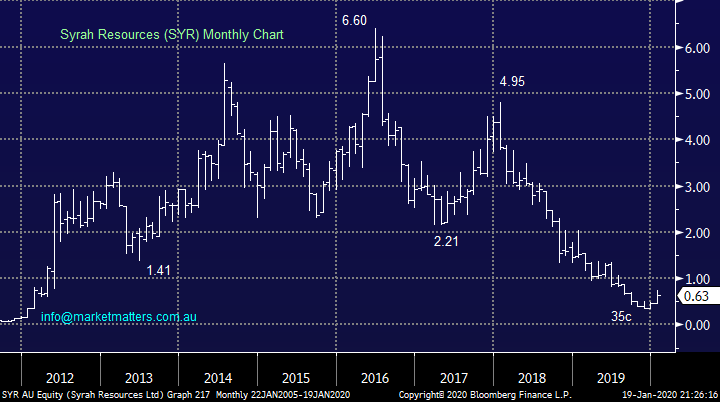
Syrah Resources (SYR) Chart
Question 6
“Hi James, welcome back! Hope you had a good break. A while back there was mention of NBI conducting another issue early this year, however I have received nothing from them relating to this. Do you have an update?” - Many thanks, Rob M.
Hi Rob,
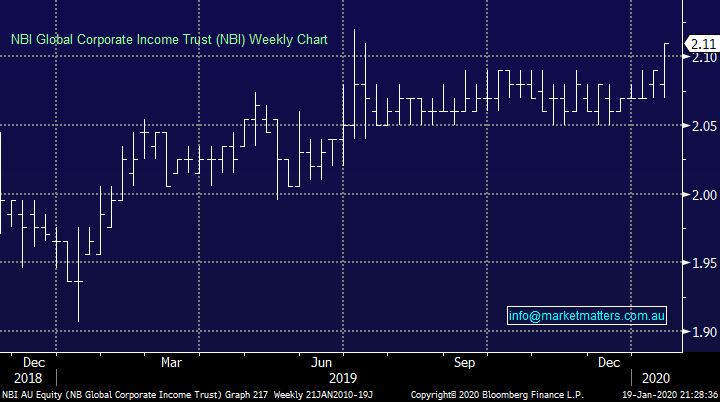
NBI This is an international bond fund we hold in the income portfolio and on the 22nd November last year they put out an announcement saying they were looking to raise more money in the new year. From what I understand, this is still happening, and new units would be offered to existing holders at NTA backing which currently sits at $2.07. In these types of deals there’s also a short fall facility that we can generally tap into where non-unit holders can buy in. For now, we think the issue will go ahead however we’ll update when more information comes out. The trust closed Friday at $2.11, 4c above reported NTA of $2.07.
NBI Global Corporate Income Trust (NBI) Chart
Question 7
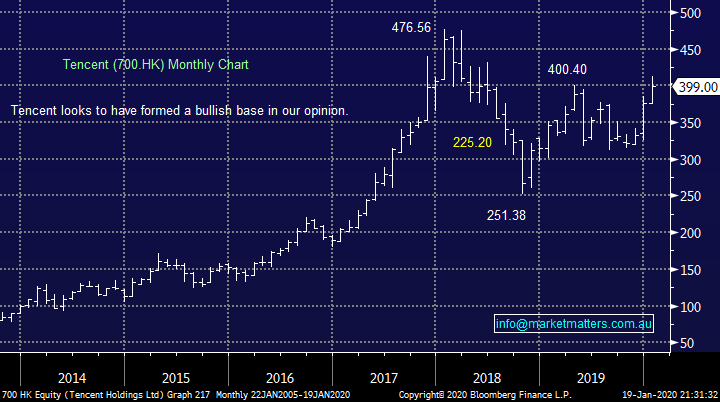
“Hi there, can someone please recommend the best broker to buy HK stocks. I looked at banks they all seem expensive. Me prefer buying option is to buy small amounts regularly. I use stake for US stocks and that's perfect.” - Regards Emily LT.
Morning Emily,
Interactive brokers are probably the most cost effective place to transact internationally. Through my team Shaw & Partners we do have an international desk although our minimum charge of $125 per trade may be restrictive for smaller trade sizes. Happy to discuss.
Tencent (700 HK) Chart
Question 8
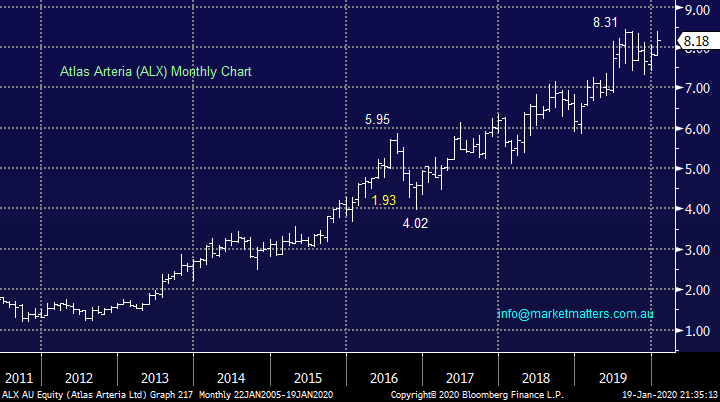
“Hi James. There seems to be a bit of hype around ATLAS ARTERIA which has gone up 10% in the past 30 days. Has the horse already bolted or is this one to take a punt on (sorry about the pun).” – Tony A.
Hi Tony,
Atlas Arteria (ALX) is an infrastructure developer and operator building the likes of road, bridges and tunnels. The stocks currently in the expensive corner but its forecast to yield 3.8% unfranked, the matrix that is the main focus for a huge number of local investors.
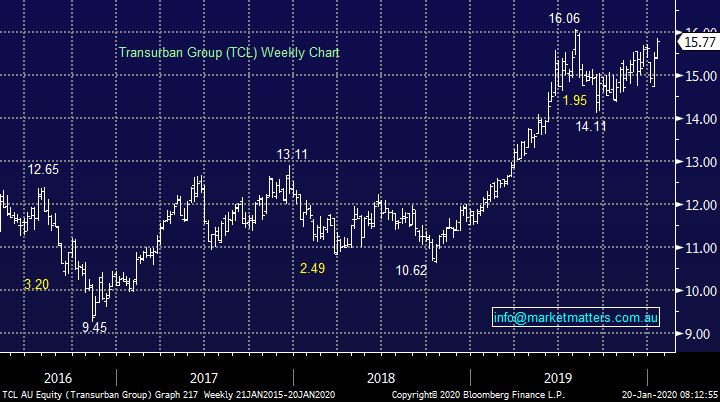
We are short-term bullish ALX similar to Transurban (TCL) which we discussed in the Weekend Report and in both cases we will tighten up stops if we see fresh all-time highs in 2020 i.e. let it run while reducing the risk.
Atlas Arteria (ALX) Chart
Transurban (TCL) Chart
Question 9
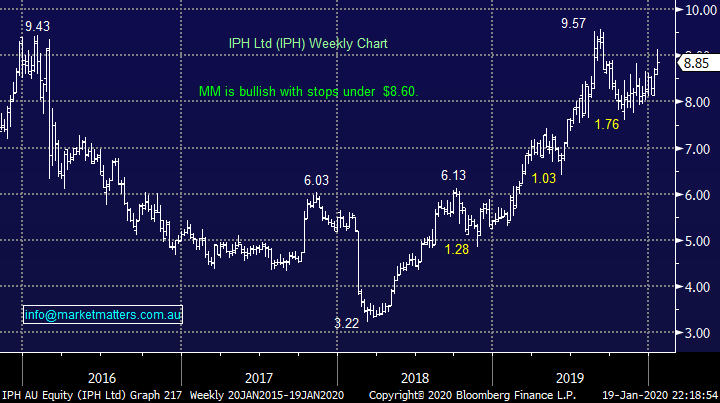
“Good evening. What are your thoughts/ insights on IPH & LNK? IPH has had a very good run- is it sustainable?” - Thanks Jenni V.
Morning Jenni,
Arguably the question investors are asking with the whole market, as most subscribers know our broad brush answer is its sustainable for now:
1 – IPH is an intellectual property company that MM likes with an eventual target ~$10, we would run stops on longs below $8.50.
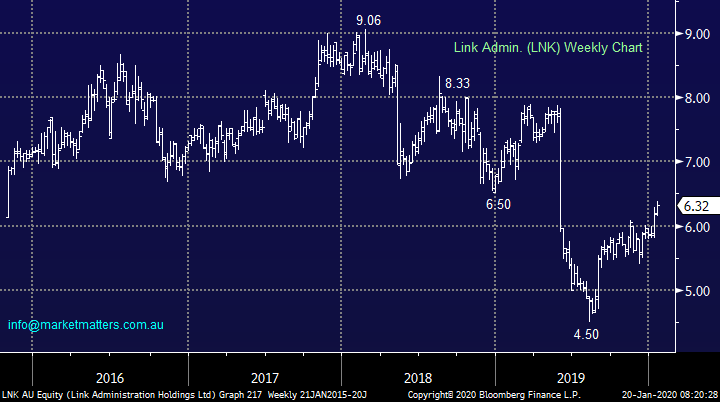
2 – Link Admin. (LNK) is a fund administrator in Australia and the UK hence it enjoyed the BREXIT resolution. MM likes LNK with stops below $5.90.
IPH Ltd (IPH) Chart
Link Admin (LNK) Chart
Question 10
“Hi MM Team, glad to see you back with more solid commentary in 2020 after a well-earned rest. Goat milk infant formula supplier BUB (Bubs Aust) has experienced a slow price slide since a mid-2019 high of $1.60 to a current price around $0.95, possibly due to the mid-2019 news that China wants its own firms to supply a higher percentage of infant formula locally. However, BUB’s figures seem ok, China’s by no means its only market, and it seems to have found some support at around $0.95. A broker I use for fundamental value assessments values BUB currently at $1.09, while Citi had a recent PT of $1.40 while Bell Potter rates BUB a ‘Buy’. Would you see BUB as ripe for a 10% rise to say $1.05 in the lead up to their interim report on 27 Feb?” - Rgds, Gil.
Morning Gil,
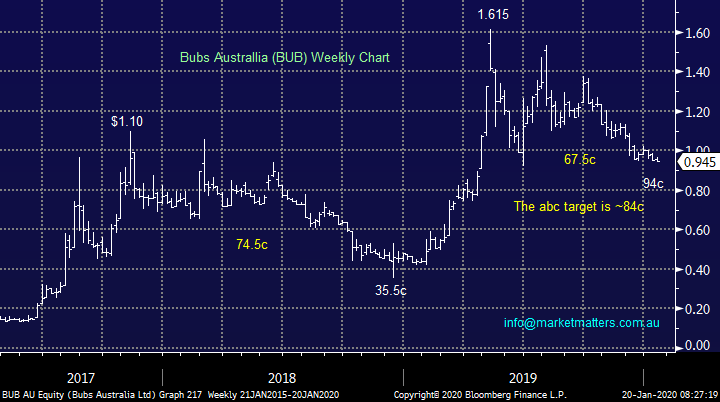
BUB is certainly a volatile stock like much of the space, even major player a2 Milk has experienced a rollercoaster ride over the last few years.
We regard BUB as an attractive almost trading stock although its $529m market cap would argue with this view. In terms of their performance around earnings releases, it is typically volatile with bigger downside moves the day after results than upside moves. In 2017 they added +3.03% following their 1H numbers while they were also up the day after results in second half 2018, by just +0.70%, however on 4 other occasions the stock was down -4.86%, -12.63%, -5.08% & -4.45% the day after results implying that it’s best to wait till earnings are released, asses, then buy. Given this track record I doubt they will run up into their results, the chart also supports this view.
At this stage MM would look at BUB from a risk / reward perspective i.e. buy a panic spike under 90c with stops initially below 75c, however we would wait till they report on the 2nd March
Bubs Australia (BUB) Chart
Question 11
“I’m an investor not a trader but concerned about downside protection as this bull market heads higher. Should investors have stop losses in place for all shares or only those they are trading? Markets when they turn it can be very fast e.g. Dec 2018. Finding stocks that fit certain characteristics requires a screening tool. Have you come across an organisation/website that provides a great screening tool for ASX listed shares?” – Regards Marvin C.
Morning Marvin,
Tools that can bought over the shelf perse in our opinion generally aren’t worth the $$, if somebody had the keys to pandoras box why would they sell them?
At MM we blend the 2 thoughts you have above, we are likely to buy the BBOZ bearish ASX200 ETF when we become nervous on the next ~5% for the market while individual stocks / companies will always be evaluated on their individual merits.
ASX200 Index Chart
Question 12
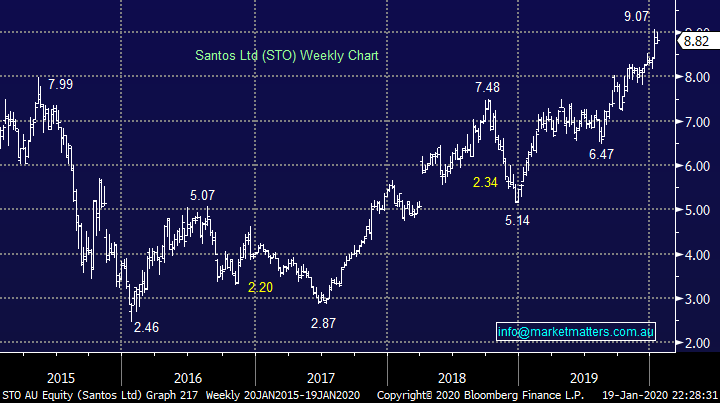
“Hi James and M&M, I am considering buying shares in NCM and would like to know if M&M are long on NCM or intend to sell into a spike? Also, can you give your view on Santos (STO) it has performed well in 2019 and would appreciate your thought for 2020.” - Love your work, Tony.
Morning Tony,
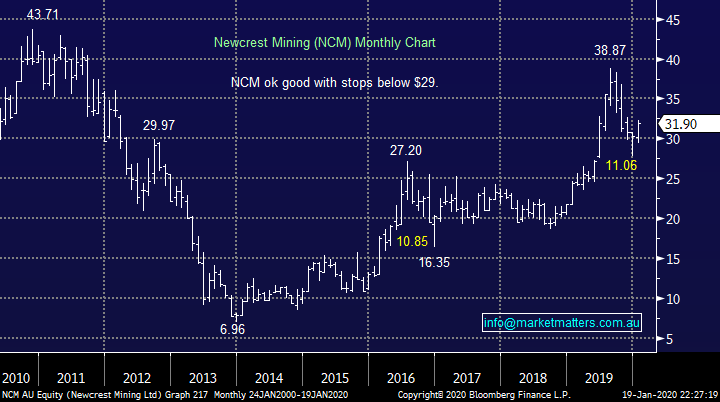
NCM does indeed reside in our portfolio, at this stage we are happy to hold the position especially as gold continues to advance nicely however we are constantly evaluating and definitely won’t rule out liquidating the position into an aggressive spike higher.
NB One of our core views for 2020 is the $US moves lower, historically very bullish for the gold and oil price.
Newcrest Mining (NCM) Chart
Santos (STO) looks good and we remain positive, a break back under $8.20 would concern.
Santos (STO) Chart
Question 13
“Hi James & The Team, I came across an article about the Fed and its balance sheet interventions – ‘its ‘QE-Not QE’ operations’. It appears to be a very well researched article and the concerns identified, if they turn out to be true, are very worrying. ‘The Fed’s position is they must continue inflating a valuation bubble despite the inherent, and understood, risks of doing so. However, with no alternative to “emergency measures,” the Fed is trapped in their own process. The longer they continue their monetary interventions, the more impossible it becomes for the Fed to extricate itself without causing the crash they want to avoid.”
Could you give your take and prognosis on this issue.? : https://realinvestmentadvice.com/macroview-has-the-fed-trapped-itself/
Thank you, Kind regards John H.
Morning John,
I couldn’t agree more, a very real predicament the Fed faces which we touched on in our recent Weekend Report, they are undoubtedly walking a very tricky tightrope but the problem for investors is they might continue with their current trajectory for years. Many experienced players have missed out on a substantial portion of the post GFC rally as they’ve worried around a number of underlying fundamental issues but while the Feds / Central Banks are stoking the fire tailwinds remain and we could go much higher.
This is one of the many reasons why we adopt Technical Analysis as one of our investment tools, it allows us to quantify risk / reward and potential major risk areas for market turns.
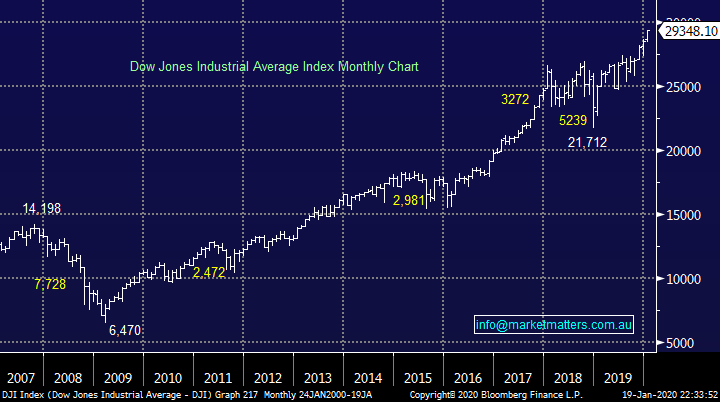
Interestingly, papers over the weekend had articles (aside from bashing Scott Morrison) on the markets best start to the year since 1987…I hope this is not lost on readers…markets rally hard into market tops!
Dow Jones Industrial Average Index Chart
Question 14
“Good Evening James & team, Does Northern Star share purchase plan ("SPP") is good buy?” - Have a nice weekend, Regards Yi.
Morning Yi,
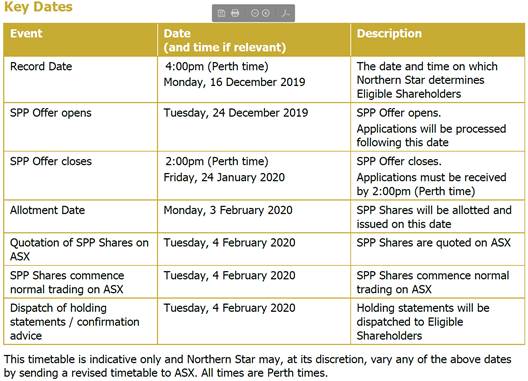
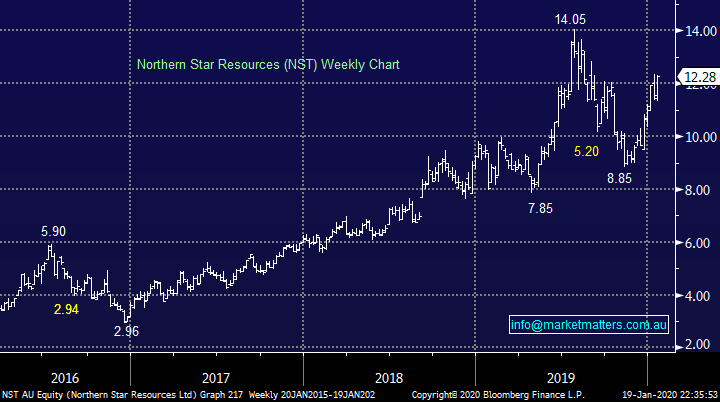
The Share Purchase Plan (SPP) closes 24th January 2020 and the deal looks to be a no-brainer, although we would expect some significant scale back. To recap, new shares to existing holders are being offered at $9.00 versus $12.28 close on Friday. The raise is to fund their purchase of ~50% of a really good asset (with Saracens) called The Super Pit in Kalgoorlie which they are buying from Newmont. Both NST and SAR management have got great credentials in the region and know the asset well. Key dates below.
Northern Star Resources (NST) Chart
Question 15
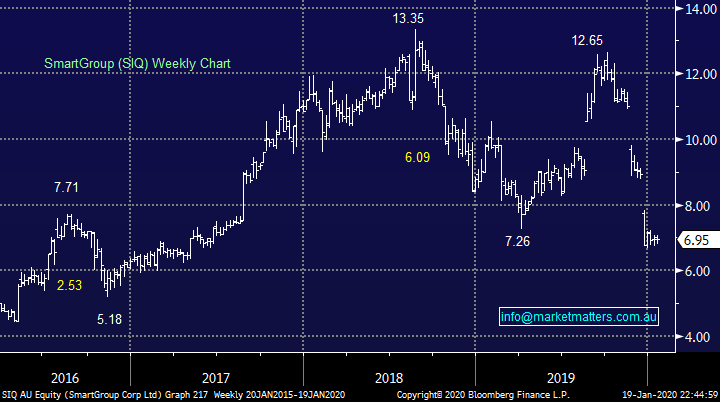
“Hi James, could you make comment on Monday about SIQ? It's not done well during the last 2-months and half yearly review is due mid Feb.” - Nick A
Morning Nick,
Salary packaging business SmartGroup (SIQ) has endured an awful few years but its currently relatively cheap and tempting as an aggressive income play, we are considering switching from Woodside (WPL) in the Income Portfolio into Smart Group (SIQ). More info to come on this.
SmartGroup (SIQ) Chart
Question 16
“Dear Team, the major influence on currencies is the % differential, correct? How do you reconcile "We believe the RBA will now almost be forced to cut rates twice this year taking the official cash rate down to an unprecedented 0.25%" with "MM believes the $A is forming an important low, our medium-term target remains the 80c region." I refer to the AUD/USD relationship.” - Regards, Paul B.
Morning Paul,
It’s a matter of what’s “built into the market” the $A has bounced 3c / 4.5% from its 2019 low even while economists look for 2 cuts this year, remember markets look at least 6-months ahead.
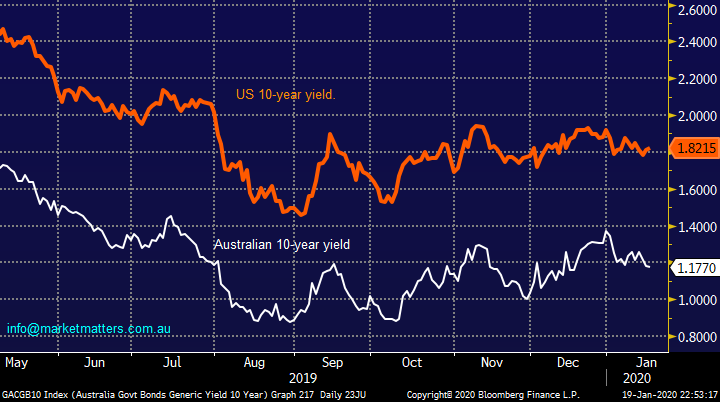
The differential between the respective countries 10-year bond yields is more important when valuing the currency and as we can see from the second chart this has remained constant for around 6-months.
Australian Dollar ($A) Chart
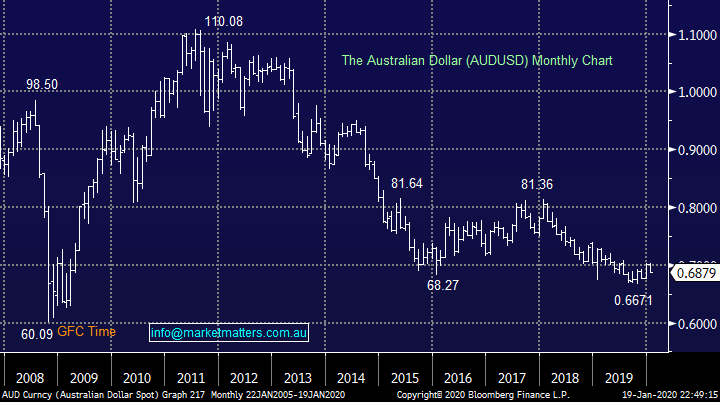
Australian & US 10-year Bond Yield Chart
Question 17
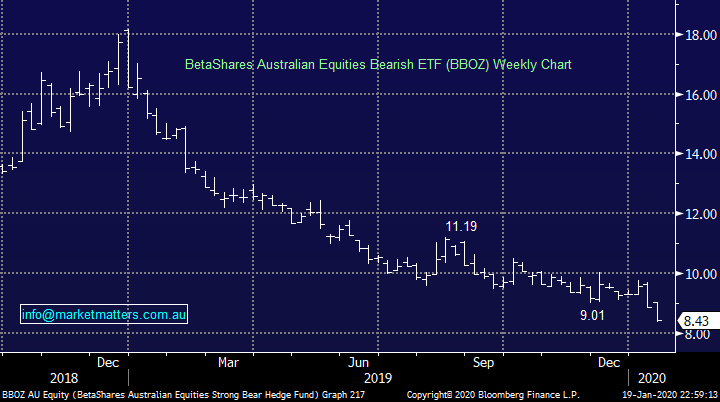
“How do I invest in the International Equities portfolio whose assets aren’t available on the ASX & similarly the Global ETF portfolio, again the assets not available on the ASX. I can buy BNKS. IEM. AUDS. GDX ok Is BBOZ approaching the buy range again?” – Brian S.
Morning Brian,
To buy these overseas assets you might be best served looking for a traditional broker or larger platform provider, there are some great alternatives available but if your struggling drop me a personal email and I will assist.
Also at this stage we are happily on the fence with the BBOZ.
BetaShares Australian Equities Bearish ETF (BBOZ) Chart
Overnight Market Matters Wrap
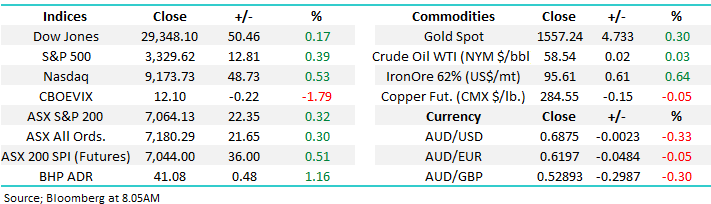
- US equities marched into further all-time highs last Friday and as earnings from US banks gave hope that the economy is strong while consumer sentiment and housing data also helped with sentiment, while US-China trade tensions seem to have eased with the signing of a deal after months of negotiations.
- Although the US is closed tonight for Martin Luther King Day, fourth quarter earnings continue this week with 58 of the S&P 500 companies due to report.
- On the commodities front, Nickel was the stand-out performer on the LME, rising ~1% along with iron. BHP is expected to outperform the broader market after ending its session up an equivalent of 1.16% from Australia’s previous close, testing the $41.08 level this morning.
- The March SPI Futures is indicating the ASX 200 to open 46 points lower, attempting to hit another all-time high of 7110 this morning.
Have a great day!
James & the Market Matters Team
Disclosure
Market Matters may hold stocks mentioned in this report. Subscribers can view a full list of holdings on the website by clicking here. Positions are updated each Friday, or after the session when positions are traded.
Disclaimer
All figures contained from sources believed to be accurate. All prices stated are based on the last close price at the time of writing unless otherwise noted. Market Matters does not make any representation of warranty as to the accuracy of the figures or prices and disclaims any liability resulting from any inaccuracy.
Reports and other documents published on this website and email (‘Reports’) are authored by Market Matters and the reports represent the views of Market Matters. The Market Matters Report is based on technical analysis of companies, commodities and the market in general. Technical analysis focuses on interpreting charts and other data to determine what the market sentiment about a particular financial product is or will be. Unlike fundamental analysis, it does not involve a detailed review of the company’s financial position.
The Reports contain general, as opposed to personal, advice. That means they are prepared for multiple distributions without consideration of your investment objectives, financial situation and needs (‘Personal Circumstances’). Accordingly, any advice given is not a recommendation that a particular course of action is suitable for you and the advice is therefore not to be acted on as investment advice. You must assess whether or not any advice is appropriate for your Personal Circumstances before making any investment decisions. You can either make this assessment yourself, or if you require a personal recommendation, you can seek the assistance of a financial advisor. Market Matters or its author(s) accepts no responsibility for any losses or damages resulting from decisions made from or because of information within this publication. Investing and trading in financial products are always risky, so you should do your own research before buying or selling a financial product.
The Reports are published by Market Matters in good faith based on the facts known to it at the time of their preparation and do not purport to contain all relevant information with respect to the financial products to which they relate. Although the Reports are based on information obtained from sources believed to be reliable, Market Matters does not make any representation or warranty that they are accurate, complete or up to date and Market Matters accepts no obligation to correct or update the information or opinions in the Reports. Market Matters may publish content sourced from external content providers.
If you rely on a Report, you do so at your own risk. Past performance is not an indication of future performance. Any projections are estimates only and may not be realised in the future. Except to the extent that liability under any law cannot be excluded, Market Matters disclaims liability for all loss or damage arising as a result of any opinion, advice, recommendation, representation or information expressly or impliedly published in or in relation to this report notwithstanding any error or omission including negligence.


