Subscribers questions (MXWO, ETHI, NEA, CSR, JHX, FOR, AUDS, ILU, WZR, TBF US, WSA, DCG, RCR, API, CBA, DBA US)
As we discussed in the Weekend Report the current markets rhythm is being dictated by the shocking news flow around the spread of Coronavirus. This morning the death toll has hit 82 with the confirmed infections approaching 3000 but the largest news of all is the virus can be passed between humans before symptoms are evident making it far harder to contain – remember an astounding 5 million people have already left Wuhan for New Year’s Eve celebrations, that’s a large number of potential incubators.
Extrapolations are running rife with one I read this morning estimating close to 60,000 infections and 1500 deaths but this is all speculation however its scientifically likely to take 4-6 months to produce any cure / preventive drugs. What is a definite is we are going to see at least a short-term hit to anything China facing e.g. the number of visitors to Macau is already down by a whopping 80% bad news for casinos and travel but healthcare stocks are in demand.
However once things are under control don’t underestimate how aggressive China could be to kick start their economy.
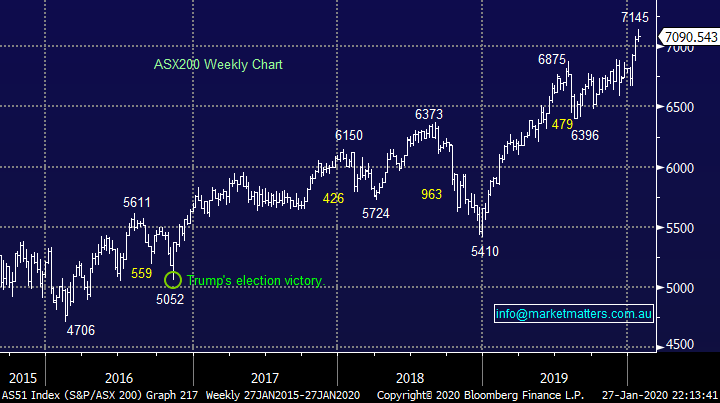
MM remains bullish the ASX200 while it can hold above 6930.
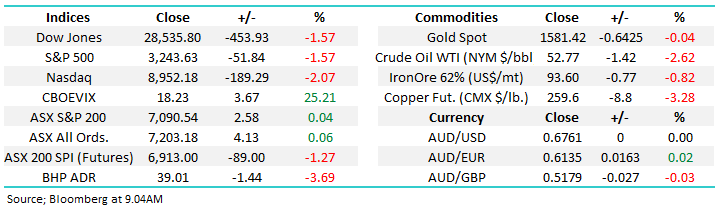
Overnight US and European stocks tumbled as expected with the Dow closing down over 450-points while the SPI futures are calling the ASX200 to fall around 90-points on the opening led by anything China facing e.g. BHP Group (BHP) fell 3.7% in the US.
Thanks again for the questions today, another record number please excuse the occasional brevity!
ASX200 Index Chart
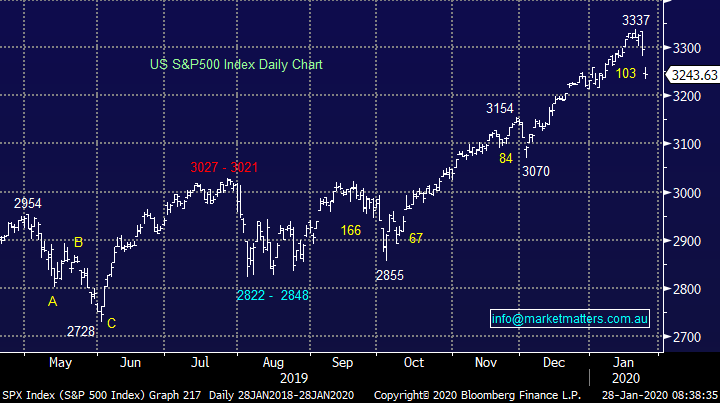
US indices are suddenly almost down for the year but remember our preferred scenario yesterday – we are looking to buy the S&P500 around the 3175 area. Hence don’t panic, things are unfolding according to plan, so far at least:
MM is looking to start buying / accumulating stocks, tweaking our portfolios, if / when the US equities fall another 2-3%.
US S&P500 Index Chart
Question 1
“How do I invest in the International Equities portfolio whose assets aren’t available on the ASX & similarly the Global ETF portfolio, again the assets not available on the ASX. I can buy BNKS. IEM. AUDS. GDX ok Is BBOZ approaching the buy range again?” – Brian S.
Hi Brian,
There are 2 ways that investors usually gain access to offshore assets / equities:
1 – Larger online brokers usually offer this facility. Interactive Brokers probably the largest
2 – Retail stockbrokers should also be in the position to give a retail client access to invest in these areas. We have an international desk at Shaw & Partners which facilitates international investing.
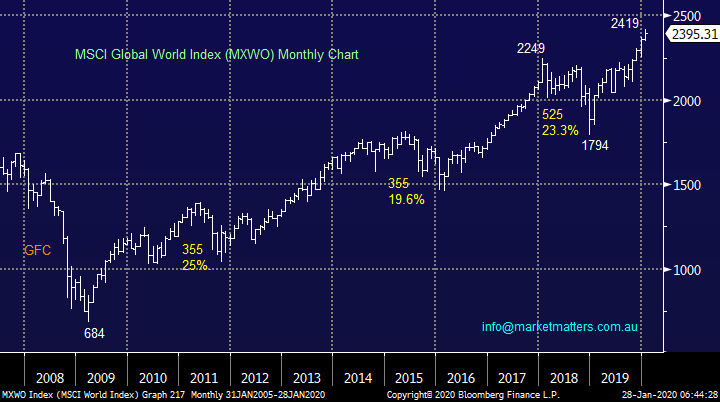
MSCI World Index (MXWO) Chart
Question 2
Can you suggest a suitable: *Ethical Global ETF *Ethical Australian ETF for me to look at investing in, taking a long-term view or do you have a report on this available? (I appreciate that you can't recommend anything)” - Thanks Simon R.
Hi Simon,
I certainly understand your feelings and with an increasing number of investors feeling the same way I’m glad to see the volume and quality of the offerings continue to increase. One consideration however is that your ethical position might be different to what is covered in the ETFs.
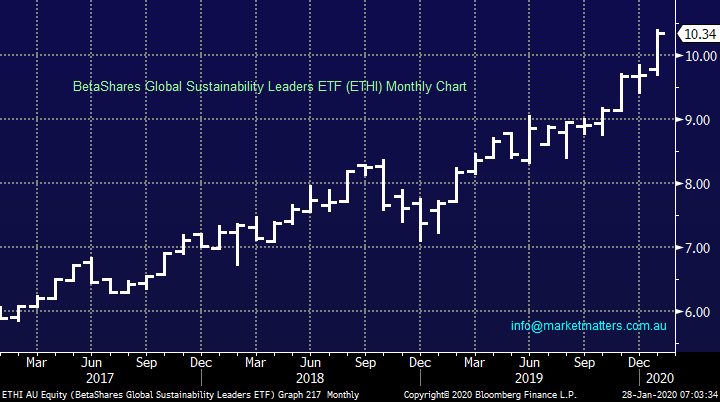
The largest option traded locally is the BetaShares Global Sustainability Leaders ETF (ETHI) which currently has market cap of almost $540m however it has Mastercard and Visa as 2 of the 3 top holdings, credit cards perhaps may not fit your ethical stance.
BetaShares Global Sustainability Leaders ETF (ETHI) Chart
Question 3
“Dear Market Matters Team, I was interested to see if you had a view on any of the aerial mapping companies such as Nearmap Limited (NEA) or the recently listed Aerometrex Limited (AMX). Nearmap looks to have had a large pull back in the middle of last year and tracking sideways at the moment. Could there be a rerating if good news comes from its US expansion or has that already been priced into the stock?” – Cheers Paul A.
Hi Paul,
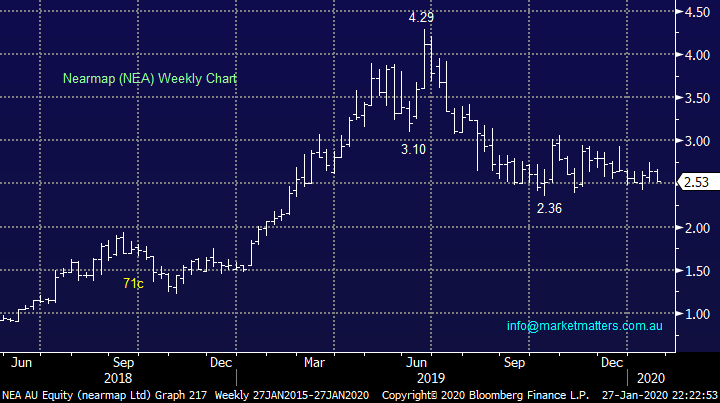
NEA is a $1.1bn business which continues to carry a short position of over 12% making it the 7th most shorted stock in the ASX, very rarely an attractive indicator. The markets concerned around the company’s future growth as competition increases from the likes of AMX which you mentioned in the question hence NEA is not one for us at this stage:
MM is neutral / bearish NEA.
The newly floated AMX is harder to gauge and we would rather put this one in the wait and see category.
Nearmap Ltd (NEA) Chart
Question 4
“What do you mean by “sky” is it a TV presentation / interview? Too late now but may be interesting to know the station” - Regards, David B.
Morning David,
I was referring Sky News; I often do a cross of two for Sky News during the week focussing on business issues. Last week it was covering the BHP result and then on the new Westpac Chairman. Today I’ll be on CNBC at 4pm on Capital Connection Hosted by Matthew Taylor at the Singapore Exchange (SGX) and Hadley Gamble at Abu Dhabi Global Market (ADGM), I’ll be in the Sydney CBD Studio. Foxtel channel 644 I believe.
Question 5
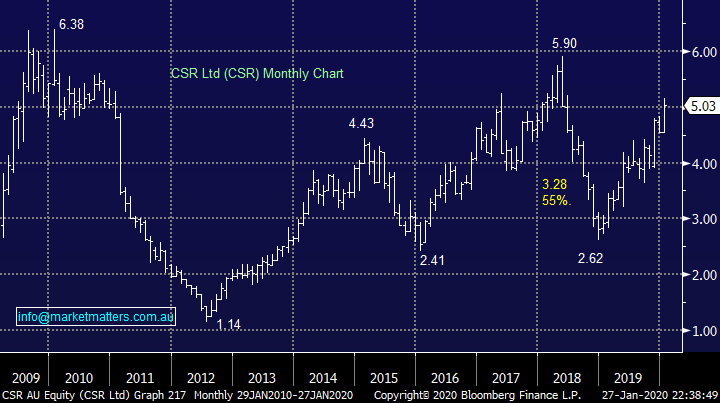
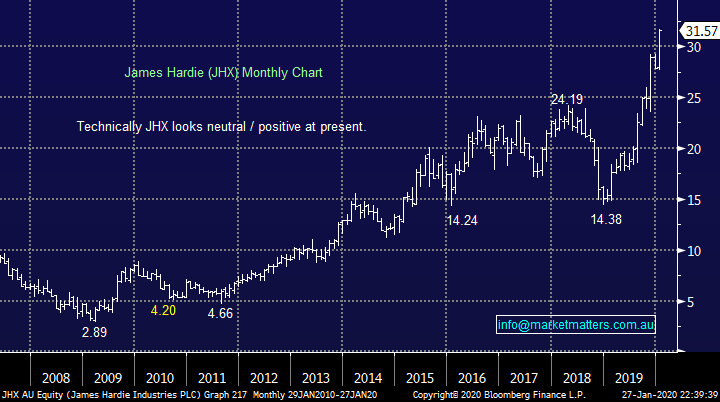
“What is your view on the near-term opportunities with building materials? is it time to switch from CSR to JHX?” – Gregory C.
Hi Gregory,
In the Weekend Report we touched on our current positive feeling towards the building stocks led by Boral (BLD), in line with our holding in the Growth Portfolio if we were considering switching from CSR we see better risk / reward and value in Boral (BLD) at this point in time.
CSR Ltd (CSR) Chart
James Hardie (JHX) Chart
Question 6
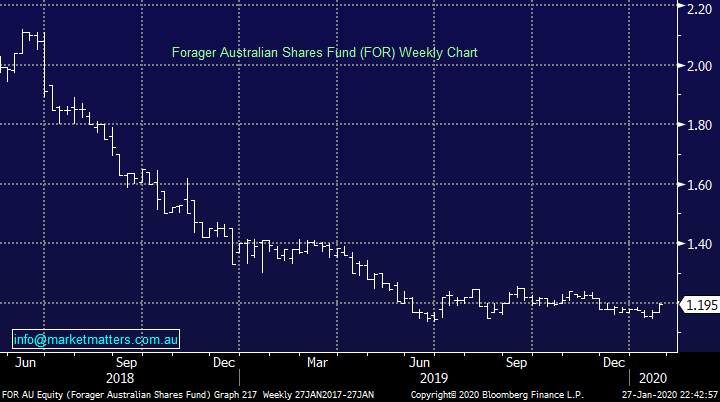
“Hi Guys I was wondering if you have any knowledge on Forager funds International and Australian fund (FOR) I have funds invested with them and they have not done well since 2018 and 2019 and trying to decide if I should exit these 2 funds ,the international fund is bouncing back so far this year but I am concerned it might be time to get out do you have an opinion I understand this is not your area but your advise would be appreciated.” - Kind Regards Ted R.
Morning Ted,
While we can only provide general comments here, I have kept across Steve Johnson’s Forager Funds since he commenced, simply because he went from the newsletter business into funds management. He has two funds, a local fund and an international fund. The local fund is listed under code FOR and has had a terrible few years, essentially halving in value. That said, FOR is a deep value manager, they search out often distressed businesses that are trading on very cheap valuations. They’ve had a few of their investments go belly up while a number have performed poorly. The international fund has done better in the last quarter of 2019 than the Aussie fund, although signs suggest some improvement across both of them. Ultimately, Forager Funds have a specific style that is not currently working. There was a good article in the AFR over the weekend on Hamish Douglas and a quote from that article is relevant here:
"I'm somewhat critical of our industry," he says. "Everything works for a period until it doesn't work." This has led to blame shifting on account of investment style, as most investors tend to be value or growth-oriented and stick to those disciplines. When it's not working for you there's all these excuses: value's out of favour, don't worry this will come back, and literally, they're waiting for the one-in-10-year event where that may come back, but the world keeps evolving and adapting. You have to evolve and adapt with it."
At MM we are big believers in playing what’s in front of us, and our approach is reflective of that.
Forager Australian Shares Fund (FOR) Chart
Question 7
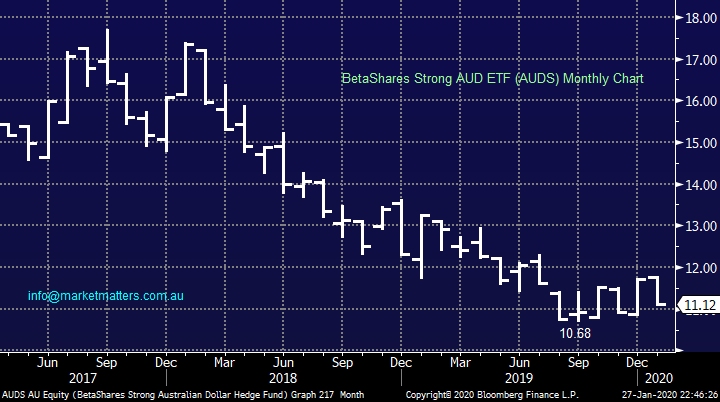
“What's your preferred ETF/s (and maybe other techniques) to trade based on rising A$ vs. USD?” – Thanks David B.
Morning David,
Our preferred ETF is the one we hold in the MM ETF Portfolio, illustrated below.
NB This is a leveraged “play” which is conveniently traded on the ASX.
BetaShares Strong AUD ETF (AUDS) Chart
Question 8
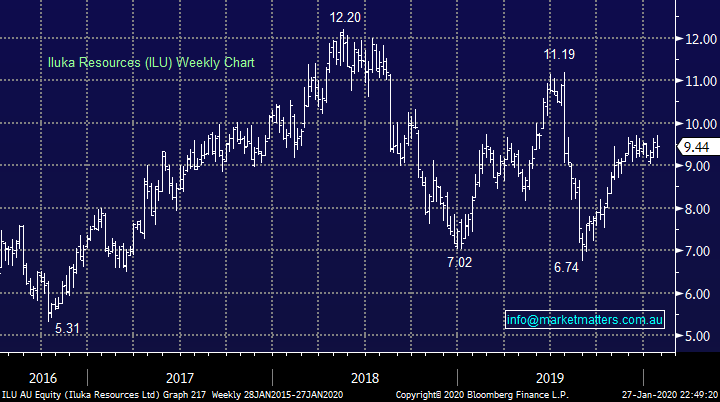
“G’Day James Co, For Monday. Wondering if it is time to have another look at Iluka ILU?” - Best regards Ron & Anita.
Hi Ron & Anita,
Mineral sands operator ILU has rallied nicely from its almost panic like sell-off in mid-2019 leaving us interested in the stock but ideally ~5% lower, very realistic in today’s environment.
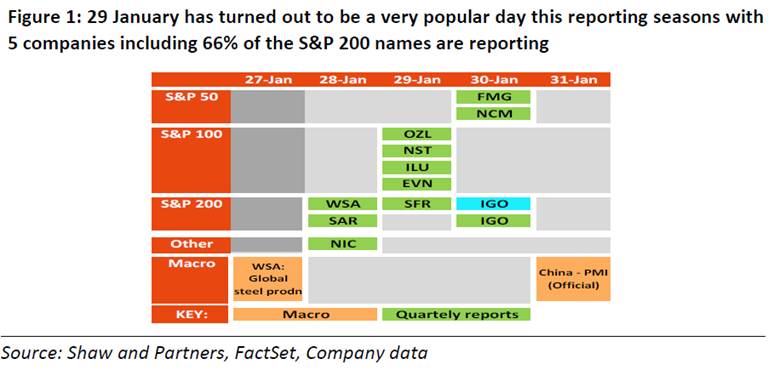
They report quarterly numbers tomorrow so more detail to come then. WSA out today and looks okay on first read through.
MM likes ILU, ideally sub $9.
Iluka (ILU) Chart
Question 9
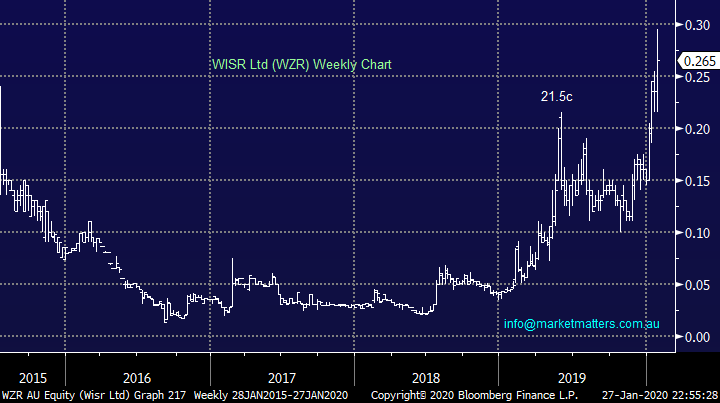
“Hi guys, I'm keen to get your opinions on WISR (WZR). As has been mentioned in some of market matters previous reports the recent placement has been massively oversubscribed, and the stock has good momentum. Is this a buy at current prices or is there a better technical entry level?” - Cheers, Mitch N.
Hi Mitch,
New lender on the block WZR has been soaring since early 2019, not surprising as the company lent almost $55m in H1 of 2020 FY almost doubling the previous corresponding period. We feel WZR is well placed in the personal lending market moving forward but it’s tricky to value at this stage hence we would be using technicals to quantify the risk / reward.
We were involved (through Shaw) in the recent placement and received around 11% of bid amounts, it’s was extremely well bid.
MM likes WZR with stops under 20c.
WISR Ltd (WZR) Chart
Question 10
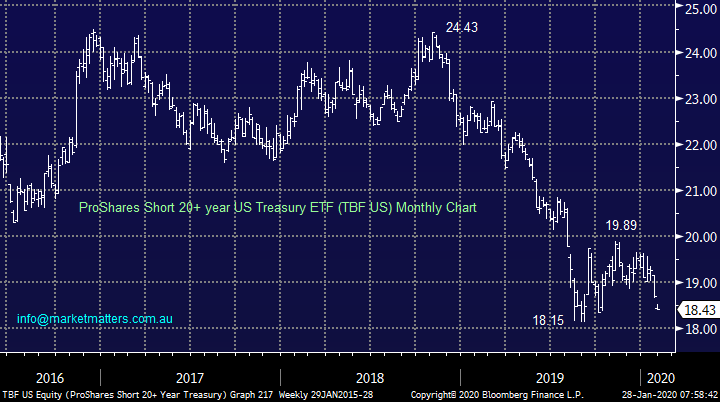
“Hi, James and team, is there an ASX listed instrument that I can use which will increase in value as interest rates rise around the world and at home.” - Thanks Daniel C.
Morning Daniel,
MM is considering using the ProShares TBF ETF as discussed in our latest Weekend Report to “play” this very same view.
We are looking to buy the TBF US around the $US18 area.
ProShares Short 20+ year US Treasury ETF (TBF US) Chart
Question 11
“Hi James and M&M, where can I get a list of the Australian Reporting Season 2020?” - Thank you, Tony.
Morning Tony,
We’ll send out a reporting calendar shortly, while I’ll also be running Direct from The Desk during reporting season which is a quick recording covering stocks that have / are reporting that day. Its included in the morning note on most days (time permitting). We’ll also have the usual up scaled coverage of company results during the period in the afternoon note.
Question 12
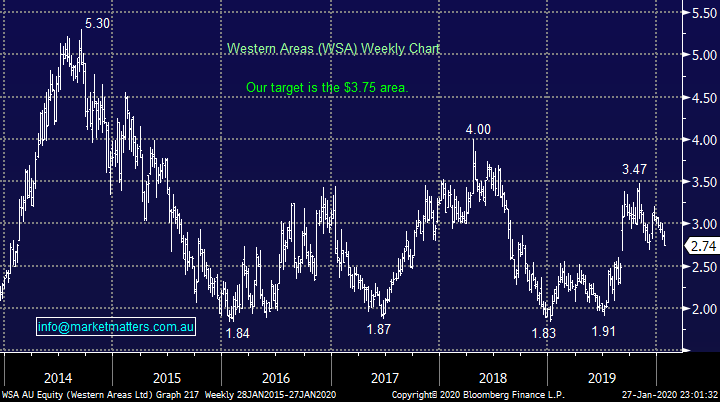
“Hi MM, what is your thoughts on averaging WSA at $2.70 - $2.80?” - Thank you, Aaron W.
Morning Aaron,
We like WSA into weakness, but our ideal averaging area is closer to $2.50, again definitely possible with the unfolding coronavirus panic. WSA has reported quarterly numbers this morning.
MM likes WSA around the $2.50 area.
Western Areas (WSA) Chart
Question 13
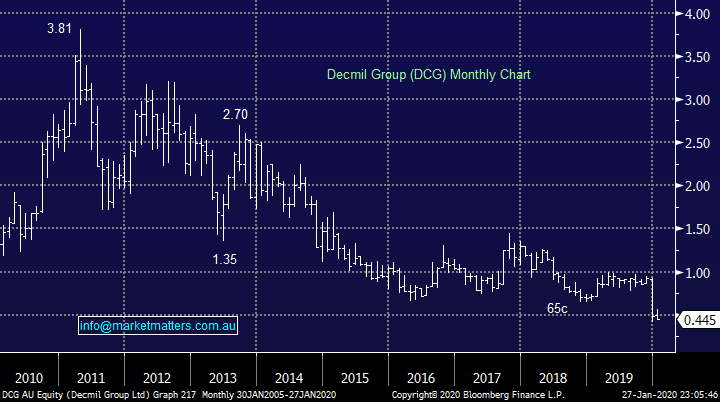
“Can I have your thoughts on Decmil (DCG) please. These share price has come off a long way recently & it currently trades on a P/E of approx. 7 times. I noticed a couple of Directors have recently been buying shares at these lower prices.” - Thanks Ian C.
Morning Ian,
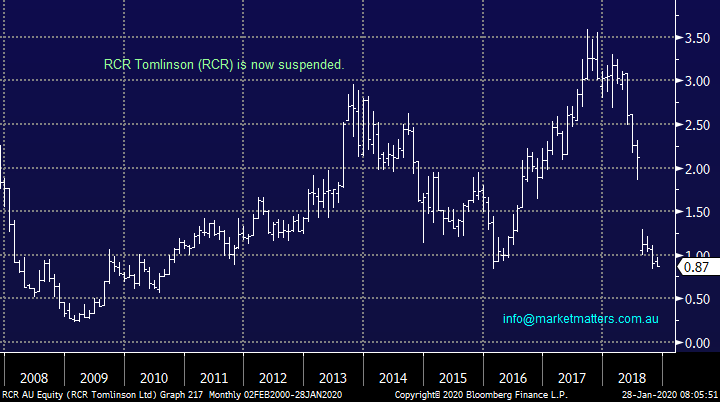
Mining services business DCG has been hammered recently leading to some bargain hunting by directors but we’re not talking on a massive scale. The company has had issues with a solar project which probably reminds some people of RCR Tomlinson’s collapse from grace, to us DCG is simply in the too hard basket at this point in time.
Decmil Group (DCG) Chart
RCR Tomlinson (RCR) Chart
Question 14
“Hi Market Matters, Thanks for your service - it’s great and I really enjoy it! One small question however, where do you get your figures from for the daily ASX "Mover & Losers” - the figures are often wildly inaccurate, as today; you have Pilbara (PLS) as an 8% gain to 38c when it was actually a 1.35% loss to 36c. Such inaccuracy is a bit troubling and I have noticed similar things in the past so perhaps your source for the figures should be changed.” - All the best, Brett K.
Hi Brett,
Yes, twice this week the afternoon report has picked up and published the incorrect table for the movers and losers’ section of the note. Quite frankly, it’s unacceptable and not the standard we set for ourselves. We get feeds from Bloomberg and in these instances the feeds were not properly checked. On a brighter note, we are well into the development of a new IT structure for Market Matters which will help to alleviate these sorts of instances, however checking still very important in our work as always.
Question 15
“Hi James, would you please consider putting the day and date on the top of the email as I do not always get a chance to read it on the day when it comes. This would let me know what day you are referring too. What is your opinion of API please?” – Thanks / Cheers Rick.
Morning Rick,
The date and time is printed on the email when you receive it (in your outlook / Gmail etc.), however we will look to make this more prominent. As I mentioned above, our reports, site etc is currently going through a major upgrade hence all feedback with an eye on improvements is very timely.
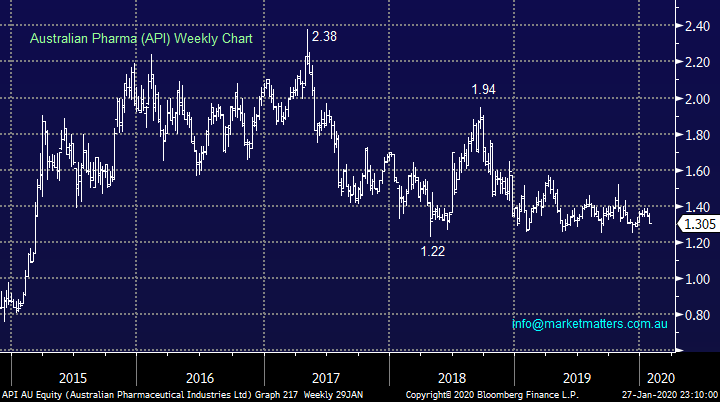
API which owns the Priceline chain has been struggling from a trading perspective recently and no significant improvement looks likely short-term – technically we can see API challenge at least the $1 area.
MM has no interest in API.
Australian Pharma (API) Chart
Question 16
“James, thanks for your weekend report - glad you enjoyed the Tennis, I’m showing a 9% profit on CBA, but I see you consider this a hold. If you get the chance could you advise what you think it can rise to as it seems to me that it has struggled a bit to stay over the $84 mark. So, my thinking was capitalise - let it settle and buy back in at lower levels.” - Cheers Mike D.
Morning Mike,
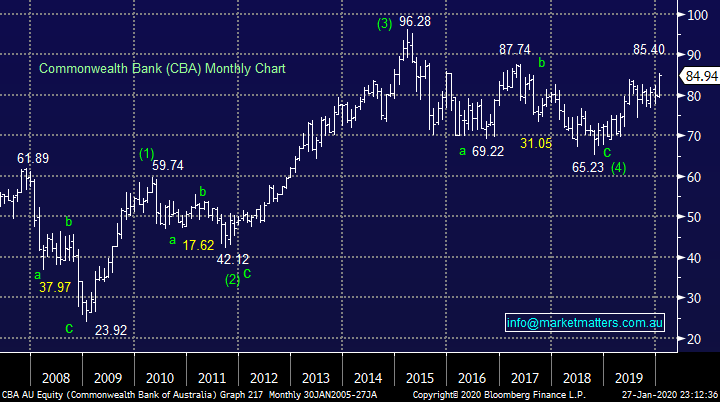
This reminds me of a line in the Weekend Report: “If I were a trader, I would be taking $$ but as an investor there’s not many alternatives hence the market probably has further to run even if some consolidation is overdue.”
I can see CBA challenging $100 in the years ahead while paying a solid dividend on its travels but a few % pullback would not surprise, it all depends where you are in terms of the investor / trader scale, which is ultimately a decision for you.
Commonwealth Bank (CBA) Chart
Question 17
“Hello James, having trouble working out the BBG I realise it’s an index, but how do you invest in it, is there an ETF or other code to use.” - regards Richard R.
Morning Richard,
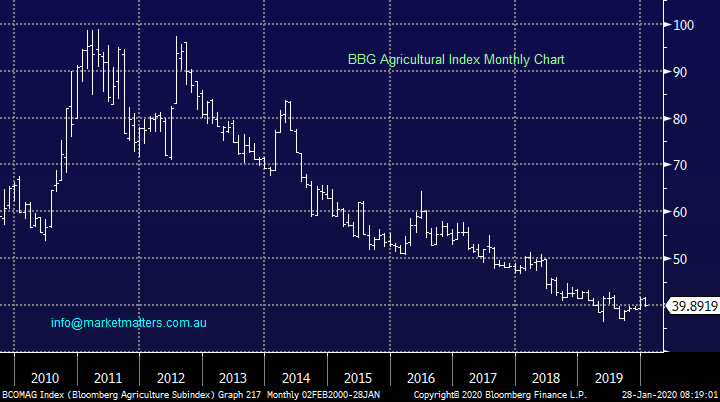
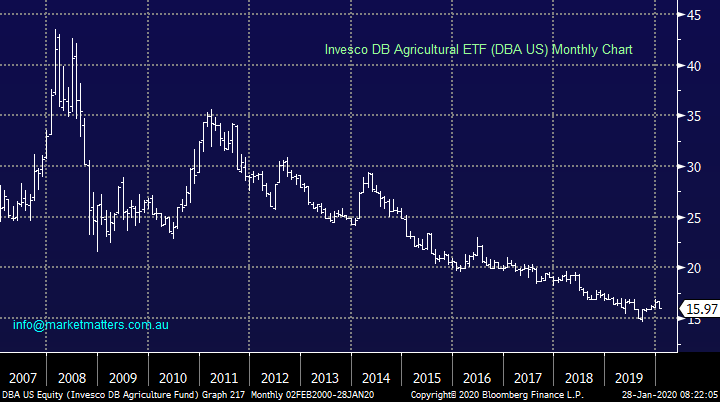
The BBG can be mapped using the Invesco DB Agricultural ETF (DBA US) a position we are considering for the MM global Macro ETF Portfolio.
BBG Agricultural Index Chart
Invesco DB Agricultural ETF (DBA US) Chart
Have a great day!
James & the Market Matters Team
Overnight Market Matters Wrap
- A global sell off was experienced since Friday evening, as global growth was a key concern on the current coronavirus epidemic.
- While the energy and commodities were the main assets being hit, the ‘safe haven’ assets took to centre stage and gold rallied to US$1582.99/oz.
- BHP is expected to underperform the broader market after ending its US session off an equivalent of 3.60% from Australia’s previous close, to test the $39.00 level.
- The March SPI Futures is indicating the ASX 200 to catch up with the global risk off and lose 108 points this morning, towards the 6980 level.
Have a great day!
James & the Market Matters Team
Disclosure
Market Matters may hold stocks mentioned in this report. Subscribers can view a full list of holdings on the website by clicking here. Positions are updated each Friday, or after the session when positions are traded.
Disclaimer
All figures contained from sources believed to be accurate. All prices stated are based on the last close price at the time of writing unless otherwise noted. Market Matters does not make any representation of warranty as to the accuracy of the figures or prices and disclaims any liability resulting from any inaccuracy.
Reports and other documents published on this website and email (‘Reports’) are authored by Market Matters and the reports represent the views of Market Matters. The Market Matters Report is based on technical analysis of companies, commodities and the market in general. Technical analysis focuses on interpreting charts and other data to determine what the market sentiment about a particular financial product is or will be. Unlike fundamental analysis, it does not involve a detailed review of the company’s financial position.
The Reports contain general, as opposed to personal, advice. That means they are prepared for multiple distributions without consideration of your investment objectives, financial situation and needs (‘Personal Circumstances’). Accordingly, any advice given is not a recommendation that a particular course of action is suitable for you and the advice is therefore not to be acted on as investment advice. You must assess whether or not any advice is appropriate for your Personal Circumstances before making any investment decisions. You can either make this assessment yourself, or if you require a personal recommendation, you can seek the assistance of a financial advisor. Market Matters or its author(s) accepts no responsibility for any losses or damages resulting from decisions made from or because of information within this publication. Investing and trading in financial products are always risky, so you should do your own research before buying or selling a financial product.
The Reports are published by Market Matters in good faith based on the facts known to it at the time of their preparation and do not purport to contain all relevant information with respect to the financial products to which they relate. Although the Reports are based on information obtained from sources believed to be reliable, Market Matters does not make any representation or warranty that they are accurate, complete or up to date and Market Matters accepts no obligation to correct or update the information or opinions in the Reports. Market Matters may publish content sourced from external content providers.
If you rely on a Report, you do so at your own risk. Past performance is not an indication of future performance. Any projections are estimates only and may not be realised in the future. Except to the extent that liability under any law cannot be excluded, Market Matters disclaims liability for all loss or damage arising as a result of any opinion, advice, recommendation, representation or information expressly or impliedly published in or in relation to this report notwithstanding any error or omission including negligence.


