Subscribers questions (MOY, CSL, PAC, NCM, ILU, GUD, JHG)
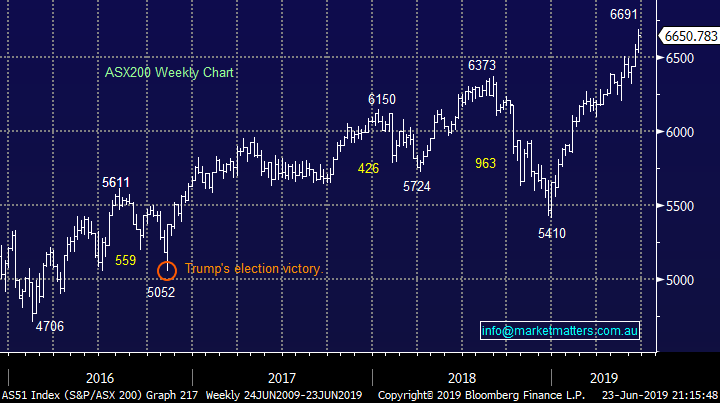
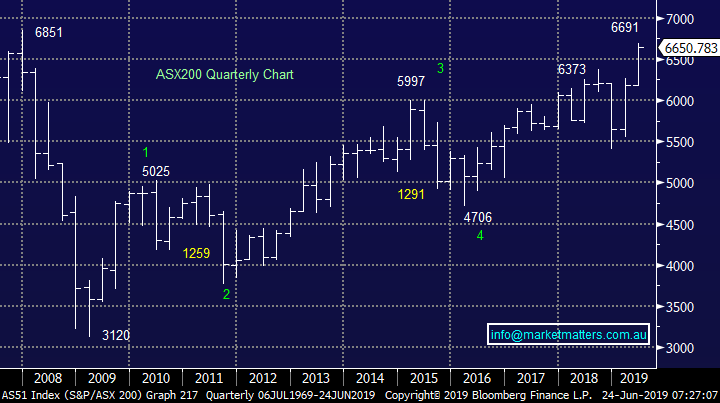
The ASX200’s explosive rally from its panic December low is becoming in danger of getting a name tag, the almost 1300-point / 23.7% rally in just 6-months has the greatest momentum of all the post GFC rallies except the initial snap back from the 2009 March 3121 low – markets do love to move in the direction of least resistance, or as we often say the path of most pain. As we all know the current market has been driven higher by tumbling bond yields and until this market realignment gives any signs of abating the bullish rally looks likely to continue but with both an RBA cash rate of 0.75% and QE for 2020 rapidly becoming built into stock prices we must begin to consider what’s the next tailwind which could push an already rich market higher still.
Over the weekend the news was relatively thin on the ground which is not surprising with this week’s G20 meeting, or should I say Trump – XI head to head, only a few days away. The likelihood of a quick resolution feels low but once he’s flexed his muscles the US President has been known to reach a surprisingly quick resolution e.g. US – Mexico trade earlier this month. Like most people we do expect a positive outcome to eventually be reached but we must caution that equities don’t appear to be factoring in any risk of a full blown trade war.
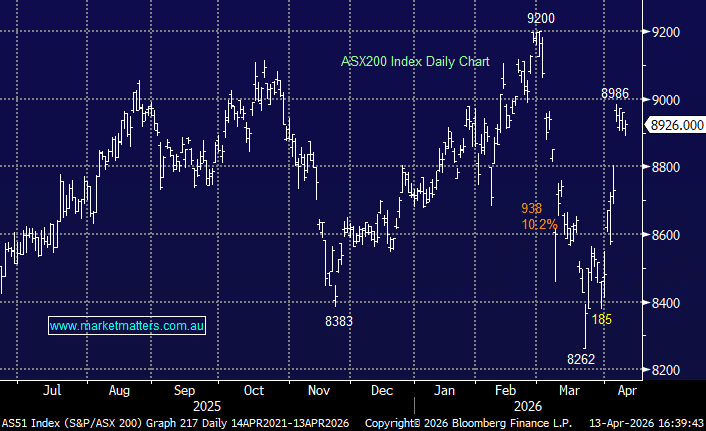
MM remains bullish the ASX200 while it can remain above the 6580 area although overseas indices are rapidly approaching our target area.
Thanks again for the great questions this week which was sprinkled with some much appreciated praise.
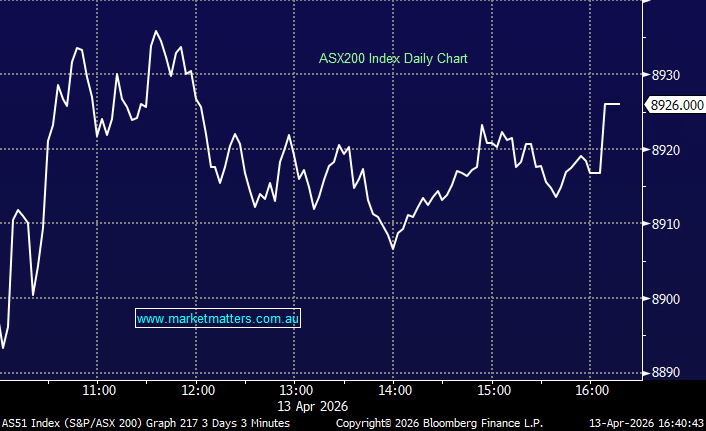
ASX200 Index Chart
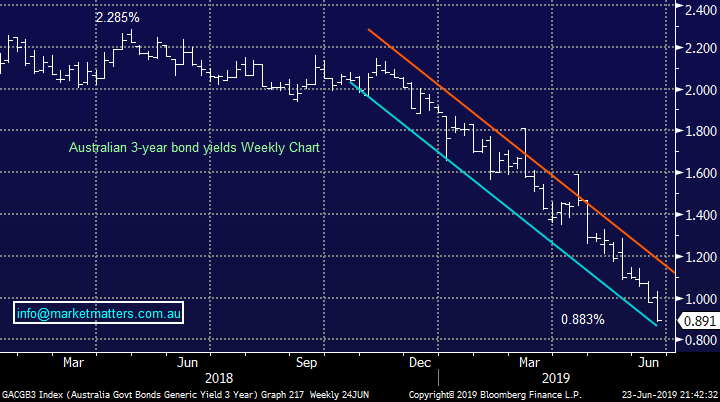
The below chart has been updated from last week and it again illustrates perfectly the greater than 50% decline in Australian 3-year bond yields since November 2018, a tremendous example of a market caught incorrectly positioned around a major macro theme thus leading to a rapid and painful adjustment for those on the “wrong foot” as prices search for a fresh level of equilibrium - all the worries were around rate increases back in late 2018, we’ve certainly experienced a major 180 degree turnaround over the last 6-months.
Prior to the latest dive in yields the 3-years were trading around 2% for ~1 ½ years, now the million dollar question is how far will they fall as they are already significantly below the RBA 1.25% cash rate.
MM expects the ASX200 to remain firm until the below downtrend is complete.
Australian 3-year bond yields Chart
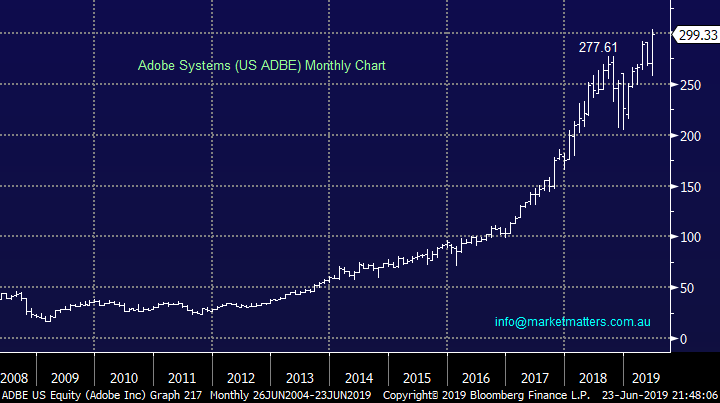
Last week Adobe (US ADBE) was the best performing stock of the world’s largest 100 stocks as it surged over 9% to fresh all-time highs. When such a high profile major market player with a market cap. of $US146bn can rally like a classic Australian “gold speccy” the path of least resistance clearly remains to the upside, investors should not underestimate how far some individual stocks can advance in the current environment.
While stocks are rapidly approaching our target area we should not be surprised if some pop significantly higher similar to Bingo (BIN) and Emeco Holdings (EHL) last week.
Adobe (US ADBE) Chart
Question 1
“Good morning James and MM Team, Firstly thanks for your reports, alerts and assistance it's been very beneficial to our SMSF. With the positive outlook on the gold sector over the next 12-months, could you give me your thoughts on one of the smaller players in the field, Millennium Minerals. (MOY)” - Cheers, Pete G.
Morning Peter,
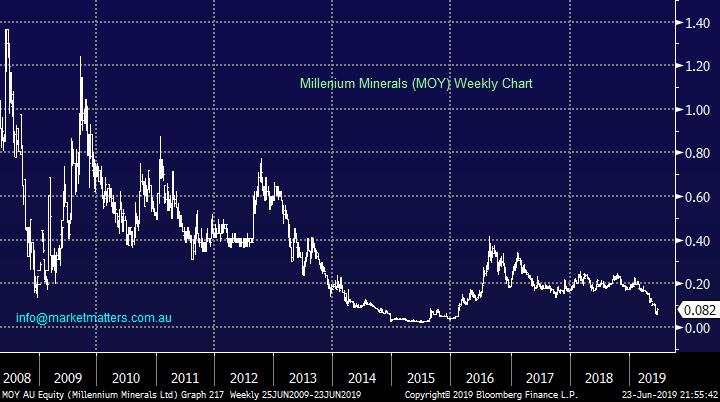
Thanks for thumbs up! Millennium Minerals (MOY) is a very small player in the gold sector with a market cap of just $73m compared to say Newcrest (NCM) at $24.6bn. Our concerns with the stock are on 2 levels:
1 – Earlier in year the company announced a meaningful increase in its gold reserves at their Nullagine site in WA’s Pilbara region, taking Est production up by ~25% at a cost of $A1300-$1375, this compares favourably to Fridays close by gold above $A2000 BUT the stock has still fallen substantially in 2019.
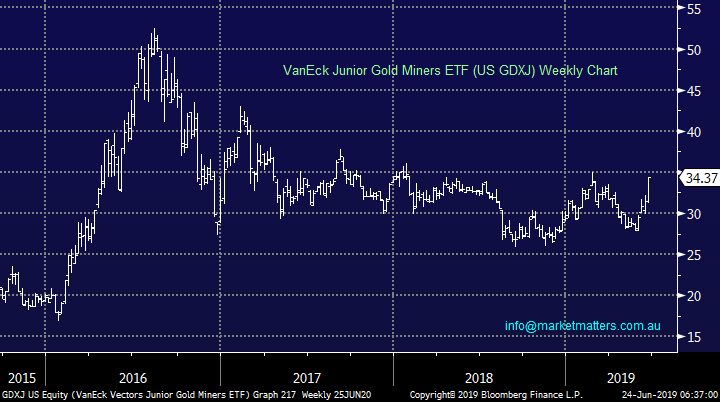
2 – While the junior small cap end of town has been major underperformers globally they are still up in 2019 as illustrated by the VanEck Junior Golds ETF but again MOY has underperformed and actually fallen.
When a stock cannot rally on positive news we generally stay away, we are bullish the gold sector into 2020 but prefer the larger end of town until further notice.
MM is neutral MOY preferring alternative ways of gaining exposure to gold.
Millennium Minerals (MOY) Chart
VanEck Junior Gold Miners ETF Chart
Question 2
“Hi Guys, any comments on CSL’s announcement last week?” - Cheers Nici B.
Hi Nici,
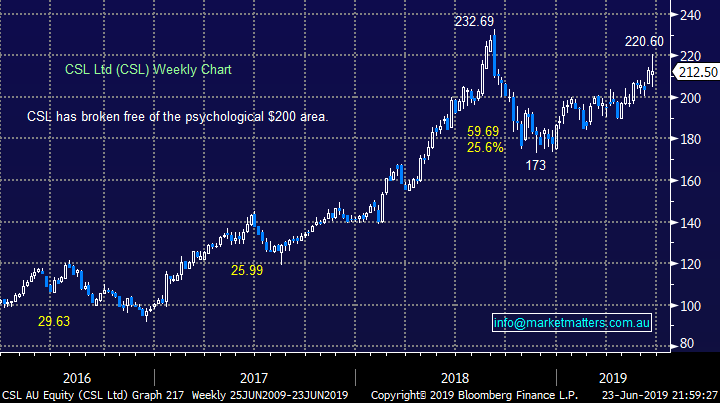
CSL fell just over 3% on Friday following a warning around lower sales in the short-term, however the biotech shares did still close basically unchanged for the week – we like many found the almost $7 drop was fairly eye catching. With the stock trading on a bullish P/E for 2019 of 34.9x it will be interesting to see how the blood plasma giant trades in the weeks ahead.
The announcement was around China where CSL is now the largest supplier of imported human albumin in the country with sales of over $500 million in FY 2018. The company’s changed how they handle things in China basically taking everything in house, the transition is expected to result in lower reported albumin sales in FY 2020 but sales of albumin in China are forecast to return to a more normalised level in FY 2021 i.e. no big deal as the share price implied.
MM is neutral CSL at current levels.
CSL Ltd (CSL) Chart
Question 3
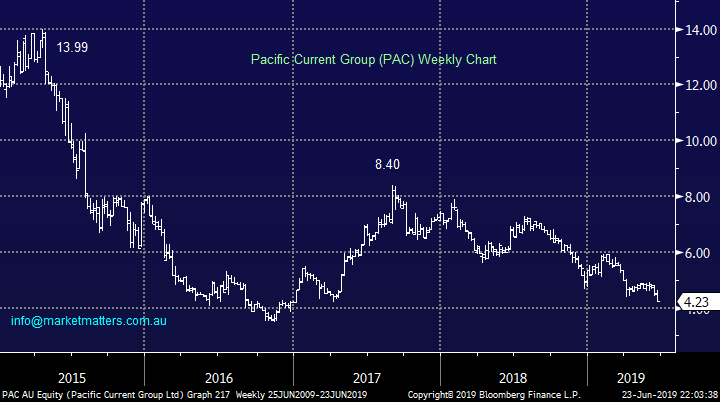
“For Mondays report. I am a long term holder of Pacific Current Group (PAC) which has performed very poorly over recent years. A number of brokers have price targets in excess of $8.00 but the share price continues to fall on no news. Would be pleased to get your thoughts on the company. Thank you” – Ian C.
Hi Ian,
PAC is a relatively small, or boutique, asset management business with a market cap. of just over $200m, while the market has rallied strongly from its 2015/6 lows PAC has fallen by over 70%, clearly a disappointing performance. The business invests in global asset management via its investment in Aurora Trust, which manages the Company’s interest in over 20 boutiques in Australia and internationally using classic equities, alternative asset classes and private equity. All of its different boutiques manage assets for institutional and individual clients around the world.
Unfortunately when a stock falls on no apparent news the reason regularly follows not far behind creating that “ahhh moment, now I understand”.
Technically PAC looks very average installing no confidence in the asset management company and fundamentally it’s hard to value.
MM has no interest in PAC at this point in time.
Pacific Current Group (PAC) Chart
Question 4
“Do you guys have a current recommendation on managed fund(s) for a medium/long term income portfolio?” – Thanks Manuel B.
Hi Manuel,
A very topical question as bond yields plunge. Dividends are a critical aspect of investing, especially in Australia where the index’s yield is so high, plus we have franking credits e.g. since the GFC the ASX200 has doubled but when we include dividends its more than tripled to fresh all-time highs.
In the first instance, it may be worthwhile looking at the MM Income Fund. The objective of the Market Matters Active Income SMA is to provide a high level of regular tax-effective income with lower volatility than the underlying share market. This is achieved by actively managing a portfolio of high yielding equities combined with ASX listed income securities that offer diversification benefits to both Australian equities and cash or term deposits:
At the end of May we were delighted to announce that our Income Portfolio was outperforming the benchmark by +3.63% but please note past performance is no guarantee of future performance.
https://www.marketmatters.com.au/news/sma/
There is now a number of alternative quality income products available in the market today and if you have some specific needs please don’t hesitate to email me personally.
ASX200 Accumulation Chart
Question 5
“Hi MM Team, Question for Monday please. Of the 18 stocks you hold in the Growth portfolio, you currently have 17 of them as buys. For somebody tweaking or starting a new portfolio, in what order would you rate them as best buys please.” – Regards Neil W.
Hi Neil,
A particularly good question if a touch daunting by its comprehensiveness. By definition if we still hold a stock it should be termed a buy however a number are approaching levels where we are considering taking profit arguably making them a hold, it’s a tricky relatively “grey area”.
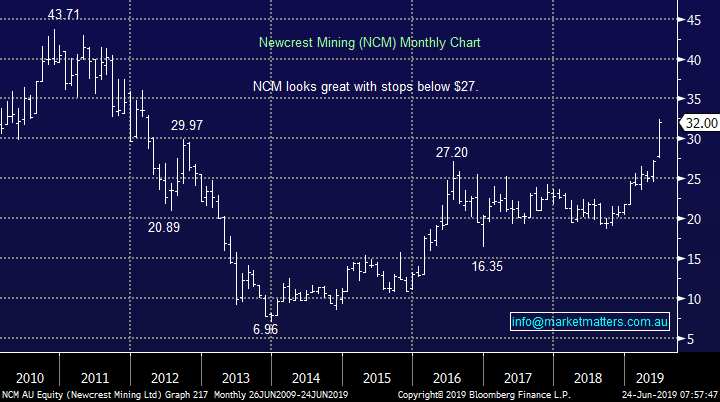
However to answer your question, as we should, our favourite buys in the MM Growth Portfolio at today’s levels and in order are the 4 banks, Orica (ORI), Costa Group (CGC), Pact Holdings (PGH) and Orocobre (ORE) plus of course the gold sector which we are considering buying in the near future. By definition this list includes a few of our worst performers because they have not yet delivered like say Bingo (BIN) and Iluka (ILU).
MM is looking to gain some gold exposure
Newcrest Mining (NCM) Chart
Question 6
“HI James, For next Monday, could you give a refresher on what you think will happen to the different sectors in early June. At the moment I am liking some techs. Will it be short lived?” - Nick A.
Hi Nick,
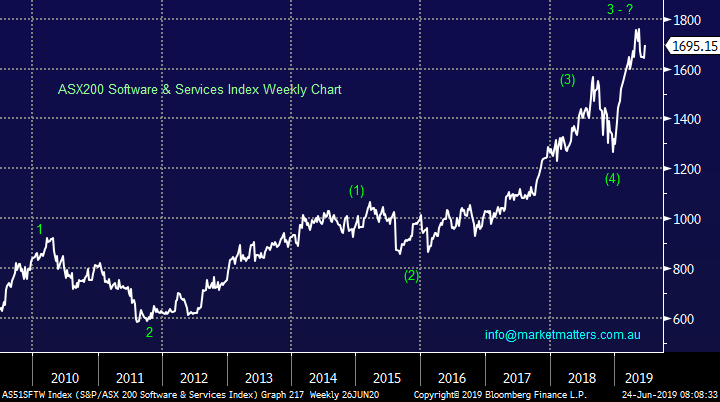
Another question which could take all morning but it’s fascinating as its focuses on our macro / market views for the next financial year. The IT space has enjoyed a phenomenal run in 2019 which eclipsed our bullish view when we went long back in November however markets are cyclical and we believe this “risk on” trade is becoming extremely mature. Our view is portfolio’s should be tweaked to a more defensive stance with the new financial year only a few days away:
Increase – defensive stocks with sustainable earnings and yield like Telstra plus golds and cash.
Decrease – high beta aggressive positions like the tech space plus general market exposure.
MM believes the next 6-months will see outperformance by more defensive portfolios.
ASX200 Software & Services Index Chart
Question 7
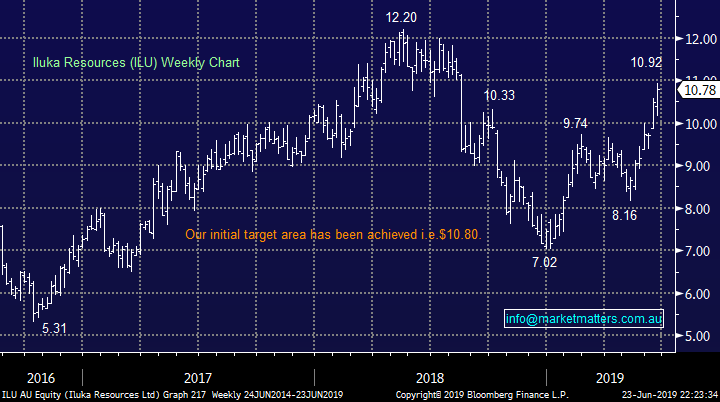
“Hi, since you recommended Iluka Resources (ILU) I’m up 22% what is your view on this or what’s your target?" - Cheers Daniel O.
Hi Daniel,
ILU has reached our initial ~$10.80 area putting our position now up over 25%, shame it’s not always that easy! We are now watching the shares carefully to see if the stock can exceed our expectations like BIN or whether this is an example of “it’s time to take the $$ and run”.
MM is remaining long ILU but watching carefully.
Iluka Resources (ILU) Chart
Question 8
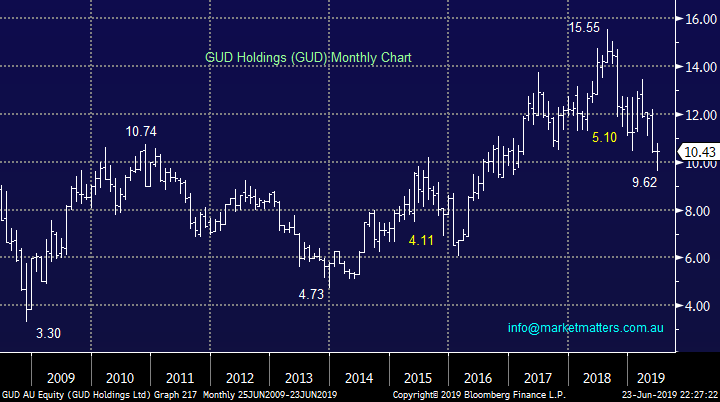
“Good morning MM. A question regarding GUD Holdings. Currently they are trading under $10 having fallen from a recent high of $13.17 in March. Is the fall purely driven by falling new car sales or is there something else at play “under the bonnet”. They do pay a reasonable FF dividend of around 4.2%. I hold the stock and am wondering if I should take advantage of the softer price and buy some more.” – Graeme D.
Morning Graeme,
GUD have obviously bounced since we received your question but I still have them yielding over 5% fully franked, even more attractive than your 4.2% on the surface although a 85% payout ratio is of slight concern, as is insiders owning less than 1% of the business i.e. management has very little skin in the game.
Unfortunately the company has experienced both company and broker downgrades in 2018/9 leading to extremely poor share performance. The underlying issue for the water and automotive conglomerate is that when one part of the business performs another generally lags leading to frustration for shareholders. The disappointing profit report in January saw the stock get smacked although it did show some green shoots of growth with revenue continuing to increase, noticeably in the automotive side of the business. However, concerns about the slow-down in the water area of the business plus the decrease in operating cash flow is still weighing on the market.
MM is now neutral to slightly bullish GUD on a risk / reward basis.
GUD Holdings (GUD) Chart
Question 10
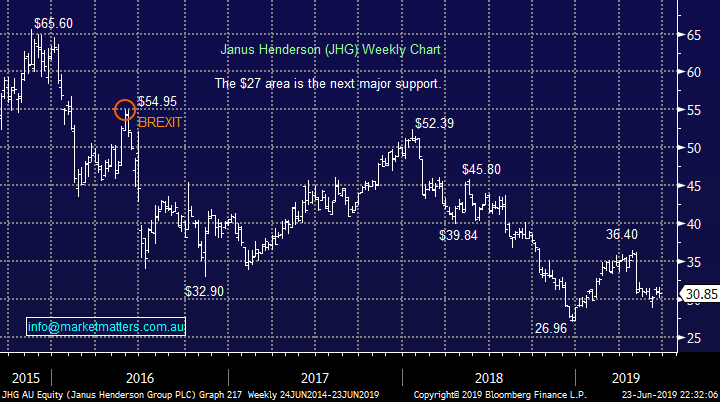
“Hi there Just wondering if you consider JHG a reasonable buy at the moment. Thank you" - Regards John.
Hi John,
JHG continues to frustrate us at MM and I’m reticent to advocate buying our weakest performer pain over the last year but the stocks undoubtedly cheap trading on an Est P/E for 2019 of 8.6x and its even now yielding well over 6% although its unfranked.
If the UK could finally sort out the shemozzle called BREXIT we would likely see an improvement in sentiment towards JHG but that still feels like a big if today.
MM is optimistic JHG while it can hold the $30 area.
Janus Henderson (JHG) Chart
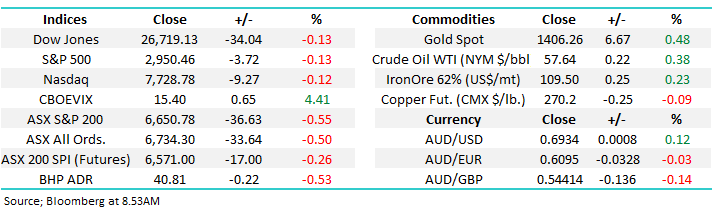
Overnight Market Matters Wrap
· The US closed marginally lower last Friday (after the Dow and broader S&P 500 hit a record high) as fears grew that increasing US-Iranian tensions could escalate into a major Middle East conflict and the ongoing concerns on US-China trade war.
· With the defensive names outshining most, gold hit a 6-year high, while crude oil lifted further, heading towards US$58/bbl. due to US-Iranian tensions.
· BHP is expected to underperform the broader market after ending its US session down an equivalent of -0.53% from Australia’s previous close.
· The September SPI Futures is indicating the ASX 200 to open with little change this morning, hovering around the 6650 level this morning.
Have a great day!
James & the Market Matters Team
Disclosure
Market Matters may hold stocks mentioned in this report. Subscribers can view a full list of holdings on the website by clicking here. Positions are updated each Friday, or after the session when positions are traded.
Disclaimer
All figures contained from sources believed to be accurate. Market Matters does not make any representation of warranty as to the accuracy of the figures and disclaims any liability resulting from any inaccuracy. Prices as at 24/06/2019
Reports and other documents published on this website and email (‘Reports’) are authored by Market Matters and the reports represent the views of Market Matters. The MarketMatters Report is based on technical analysis of companies, commodities and the market in general. Technical analysis focuses on interpreting charts and other data to determine what the market sentiment about a particular financial product is, or will be. Unlike fundamental analysis, it does not involve a detailed review of the company’s financial position.
The Reports contain general, as opposed to personal, advice. That means they are prepared for multiple distributions without consideration of your investment objectives, financial situation and needs (‘Personal Circumstances’). Accordingly, any advice given is not a recommendation that a particular course of action is suitable for you and the advice is therefore not to be acted on as investment advice. You must assess whether or not any advice is appropriate for your Personal Circumstances before making any investment decisions. You can either make this assessment yourself, or if you require a personal recommendation, you can seek the assistance of a financial advisor. Market Matters or its author(s) accepts no responsibility for any losses or damages resulting from decisions made from or because of information within this publication. Investing and trading in financial products are always risky, so you should do your own research before buying or selling a financial product.
The Reports are published by Market Matters in good faith based on the facts known to it at the time of their preparation and do not purport to contain all relevant information with respect to the financial products to which they relate. Although the Reports are based on information obtained from sources believed to be reliable, Market Matters does not make any representation or warranty that they are accurate, complete or up to date and Market Matters accepts no obligation to correct or update the information or opinions in the Reports. Market Matters may publish content sourced from external content providers.
If you rely on a Report, you do so at your own risk. Past performance is not an indication of future performance. Any projections are estimates only and may not be realised in the future. Except to the extent that liability under any law cannot be excluded, Market Matters disclaims liability for all loss or damage arising as a result of any opinion, advice, recommendation, representation or information expressly or impliedly published in or in relation to this report notwithstanding any error or omission including negligence.