Subscribers questions (KGN, NXT, CBA, MQG, ALU, FMG, PET, AUDS)
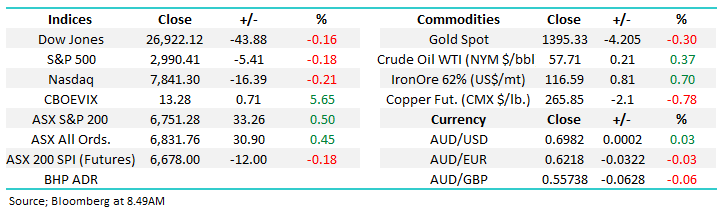
The ASX200 has enjoyed a solid start to the new 2019/20 financial year rallying 133-points / 2% last week, largely assisted by the RBA cutting interest rates down to an unprecedented 1%. The hunt for yield has intensified of late as many conservative investors are being forced from fixed interest as their returns become almost non-existent e.g. CBA term deposit rates have fallen below 2% while their shares still pay 6.94% grossed for franking. The current flock to stocks in search of yield feels likely to continue unless the recession word becomes entrenched in the day to day news.
Over the weekend the Australian property market continues to recover nicely and many pundits are already saying the low has come and gone. The statistics have turned big time with this weekend auction clearance rate at 78.2%, up from 52.6% the same time last year, a whopping 48.7% improvement – although volumes are low! We have undoubtedly witnessed 3 major reasons for optimism returning to the buyers corner:
1 – Interest rates have been cut by 0.5% in the last 2-months, with more promised if required by our dormant economy – the most competitive mortgage rates are now closer to 3% than 4%, pretty enticing for the borrower.
2 – The recent loosening of restrictions on borrowers by APRA has removed the shackles for many keen buyers – I read a paper overnight quoting borrowers are being allowed to “super-size” mortgages, an impressive headline although it’s still stricter than a few years ago.
3 – The surprise Liberal election victory has made many people more confident in our economic prospects, illustrated to a degree by a strong share market.
An improving property markets helps many sectors of the ASX200 but those assuming we will get another 1 or 2 rate cuts over the next 12-18 months may be getting ahead of themselves. In our opinion if the RBA watches property prices reignite the central bank will sit back and wait, not continue to cut.
At MM we remain in “sell mode” for our Growth Portfolio but not in an aggressive manner with our cash level already elevated to 23%. Also we are considering a few stock “switches” that we feel will make the portfolio more defensive in nature.
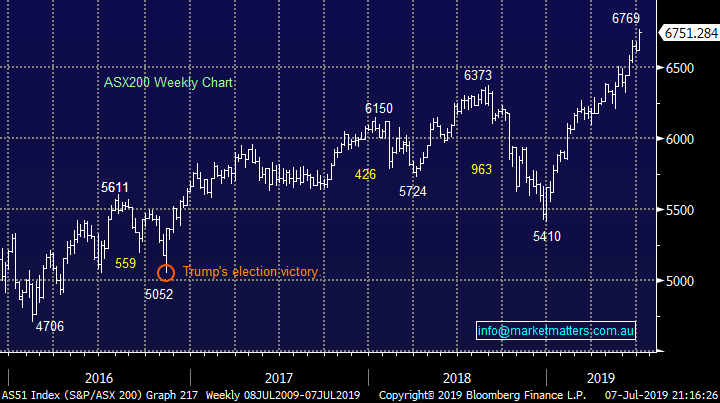
MM remains mildly bullish the ASX200 while it can remain above the 6680 area although US indices have basically reached our target area.
Thanks again for the excellent questions, just a quick note we cannot offer / will not offer personal advice hence its easier for MM if subscribers simply ask our opinion on a particular stock / sector as opposed to being specific around an actual holding.
ASX200 Index Chart
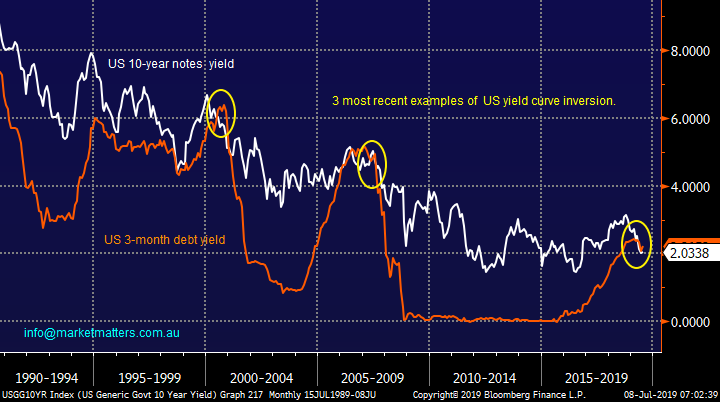
In late 2018 as equities plummeted we were being bombarded in the press about inverting yield curves but ironically as we sit here in mid-2019 and the phenomenon’s become more pronounced it’s not really being discussed on main street – an inverted US yield-curve occurs when long-term debt has a lower yield than short-term debt.
Hence as the chart below illustrates the US yield curve has inverted for the 3rd time in 20-years as we see US 10-year notes yielding less than 3-month debt. However the huge catch is this economic position forecasts generally end is recession:
“An inverted yield curve is an interest rate environment in which long-term debt instruments have a lower yield than short-term debt instruments of the same credit quality. This type of yield curve is the rarest of the three main curve types and is considered to be a predictor of economic recession”.
US 10-year and 3-month yields Chart
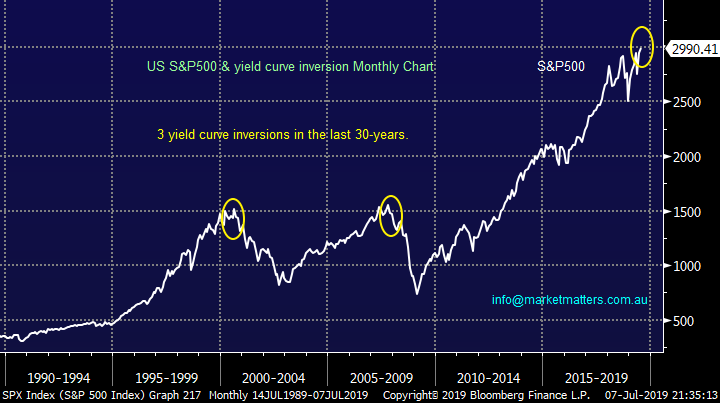
The link to equity markets is pronounced and painful, stock markets do not enjoy a recession. I have shown below the previous 2 times when the US yield curve inverted in the same meaningful manner – stocks were simply hammered.
Our medium-term target for the US S&P500 of 3000-3050 area has been achieved leaving us cautious, especially when we consider the yield curve.
MM has moved to a neutral and cautious stance on US stocks.
US S&P500 & the yield curve Chart
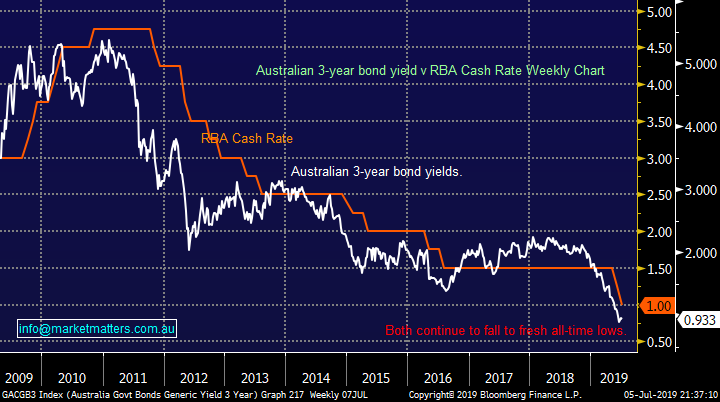
An example that bond yield correlations should not be ignored was demonstrated in recent months: MM used the local 3-year yields falling below the RBA Cash rate in a meaningful manner as the backbone of our view that interest rates would be cut to 1% in Australia in 2019.
MM has moved to a more cautious stance on the next move by the RBA as both rates hover around 1%.
Australian 3-year bond yields v RBA Cash Rate Chart
Question 1
“Hi James, What is your view on KGN? If I read the chart correctly, it seems ready to bounce. Fundamentally, the cut in interest rate could also favour the retail stocks.” – Gregory C.
Morning Gregory,
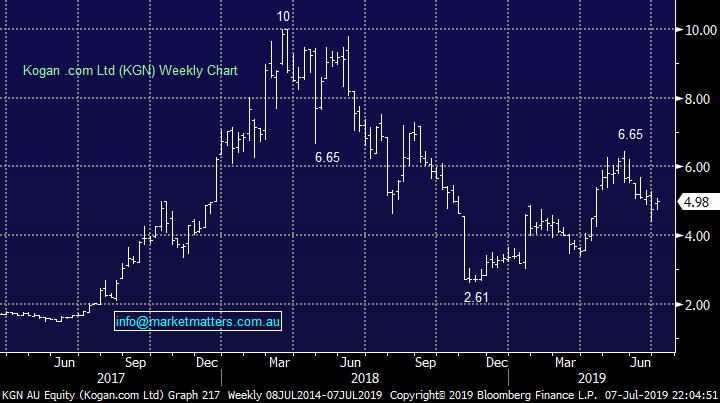
Kogan (KGN) has certainly experienced a huge degree of both volatility and press over the last 18-months with the shares halving – the founders sold $42m worth of stock a year ago around $7 although they tried to sell more!
In their April unaudited quarterly announcement Kogan reported strong growth with revenue up 9.5% versus the previous March quarter, gross profit increased by 28.4% and EBITDA was up 6.4%. Importantly active customer numbers were up over 23% to almost 1.6m with the growth coming from newer areas of its business such as Kogan Mobile and Kogan Internet. Also in the March quarter we saw the launch of its energy price comparison tool, Kogan Energy Compare.
The Kogan brand is recognised by aggressive pricing through its on-line offering, hence it feels safe to assume that it will be undercutting the likes of AGL Energy (AGL) and Origin ORG) in this latest venture, sounds like good news to you and I. The market doesn’t seem to have total confidence in the brand at times although its valuation has it trading at the rich end of the curve compared to many in retail, this makes sense to MM because in tough times shoppers become far more sensitive to price plus of course KGN has shown good growth potential.
Retail remains a questionable area locally as an Australian recession is a very real possibility, all the above plus its founders sell down last year leaves us undecided on KGN. Sorry, a bit 50/50 at the moment Gregory.
MM is neutral KGN.
Kogan.com (KGN) Chart
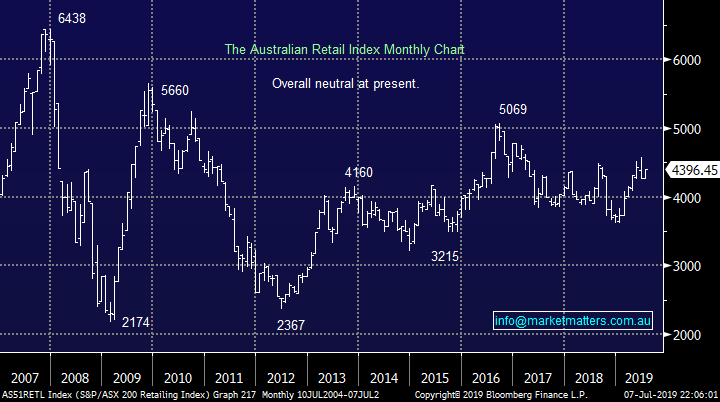
Retail overall has endured a rocky road over the last 2 ½ years and although some stocks have corrected in a very meaningful manner the economic landscape remains an issue i.e. while interest rate cuts is a clear positive for retail the Australian consumer remains weighed down by debt.
Technically MM is neutral the Retail sector at present.
ASX200 Retail Index Chart
Question 2
“I have NXT in my super SMA with a 2% weighting. It is not going anywhere so I was wondering if it is a sell ( if it is any suggestion on its replacement ) or a hold.” - David M.
Hi David,
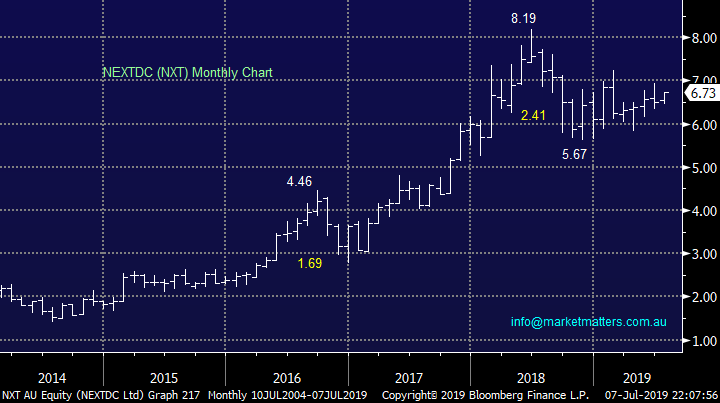
Data centre business NXT is having a rest in our opinion following its strong appreciation over the last few years but admittedly it’s been an underperformer during the last year. The stock was hit relatively hard in February following a disappointing half year result which showed revenue up 17%, a net loss after tax of $3.1m on customer numbers up by 25%.
We like NEXTDC as a business and believe it’s well-positioned to deliver solid growth over the years ahead. However, due to the shares valuation we are cautious seeing little room for error in the company’s execution, in other words its a high risk option in our opinion.
Also NXT is the 4th most shorted stock on the market with a 14.6% sold short position – the professional investors have no confidence in the Brisbane based business.
MM is neutral NXT at best.
NEXTDC (NXT) Chart
Question 3
“I refer to your recommendation reducing the banks. We have 5 banks in the MM portfolio. I note that Macquarie is different but I’m wondering rather than recommending 3 separate occasions of small reductions of NAB, WBA and CBA why don’t you just recommend selling one of the 3 large banks? Also I’m sitting on a 71% gain on Altium. I’m wondering whether it’s time to sell.” - Thanks Ken
Hi Ken,
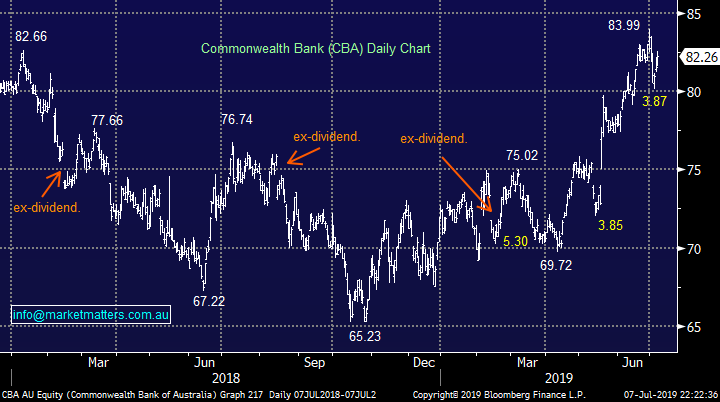
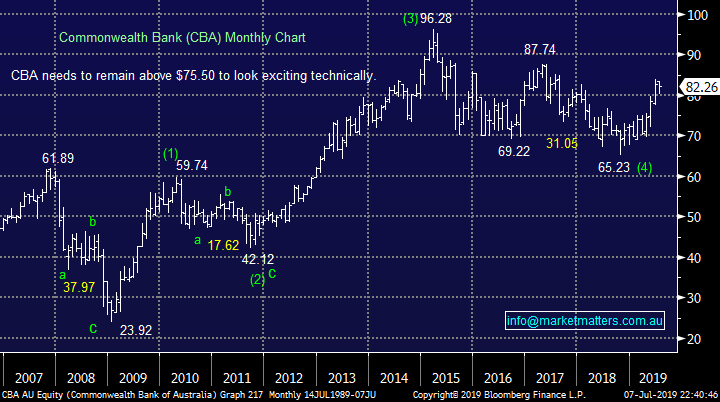
Your point on our bank position makes perfect sense and there isn’t a huge differential between either approach although in the last quarter CBA has been a major outperformer hence which stock is selected to be sold can be important. If / when CBA hits our technical target of around $85 we are seriously considering doing just that and cutting one of our holdings – our 26% in the sector remains overweight the index, although less so than we were.
MM is considering reducing our banking exposure a further 3-4% higher.
Commonwealth Bank (CBA) Chart
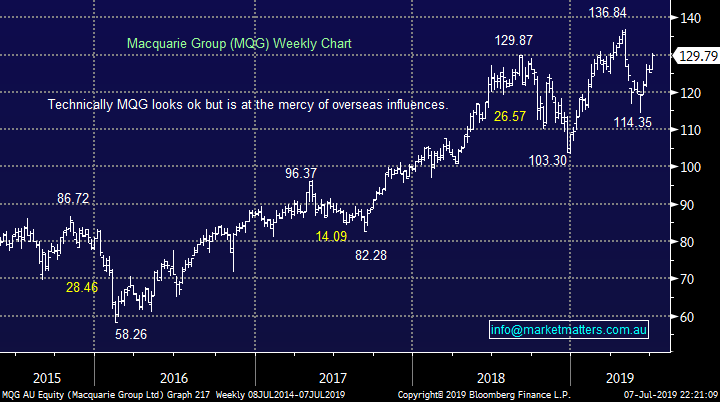
Macquarie Group (MQG) is the least correlated to the index with the stock down -0.8% over the last 3-months compared to CBA which is up 16%.
MM is considering selling / switching out of MQG in the near future.
Macquarie Bank (MQG) Chart
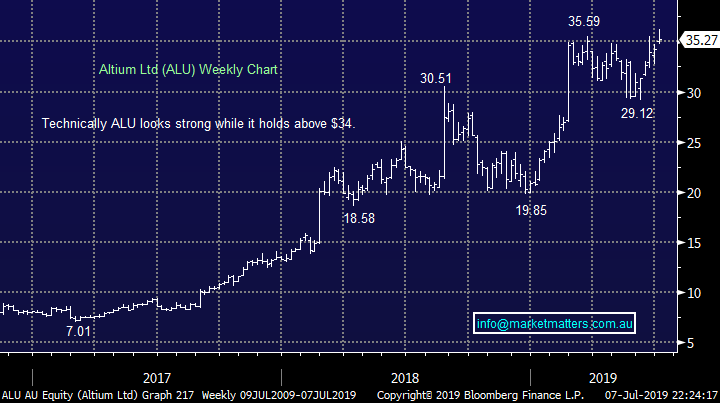
Altium (ALU) has enjoyed an amazing run and we took profit too early on our purchase into the panic November lows, albeit it a nice profit. The issue was then and remains a valuation one, we find it extremely hard to justify the current optimism built into the share price.
Hence we would be playing ALU from a purely technical perspective as valuations have gone out of the window! Technically the stock looks ok while above $34 but my “Gut Feel” is failure is close at hand.
MM likes ALU while it can stay over $34.i.e stops could be placed on a break below $34
Altium (ALU) Chart
Question 4
“James, Iron Ore stocks haven’t mirrored the rise in the Iron Ore price since their peak in mid-April. Why are the juniors like MGX and GRR declining and the majors only showing modest increases (apart from FMG) despite the Iron Ore price going up 27% as of yesterday with another 4% rise today. What is that we don’t know?” – Regards David H.
Hi David,
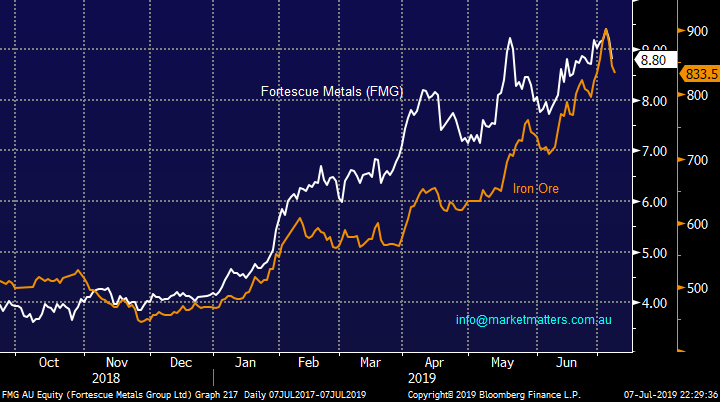
Iron ore has been in the press a lot recently and we are inclined to believe a meaningful high was formed last week following Chinese steelmakers complaining prices were too high.
We simply feel the fact that majors BHP and RIO are diversified resource stocks explains why they haven’t rallied as fast as Fortescue (FMG) which is obviously hugely leveraged to just the iron ore price – remember the likes of copper has been falling which is a negative for the 2 big miners.
With regard to say MGX and GRR it’s a case of the cream floating to the top with FMG a far better company in both our opinion and it would appear the markets. Mount Gibson now trades on a Est P/E for 2019 of 8.9x while yielding ~3% while FMG now trades on an equivalent P/E of 7.4x and an estimated yield of 4.7% making Twiggy Forests stock still far more attractive to MM.
MM is now neutral to bearish iron ore stocks at least short-term. **Watch for alerts**
Fortescue Metals (FMG) & iron ore Chart
Question 5
“I recently re-joined MM. I am endeavouring to re-align my portfolio and wish to know is it possible to quote the Asset Class with each stock .This would make it easier to align the portfolio to the various asset classes.” - Thanking You, Cliff G.
Hi Clifford,
Firstly were delighted to have you back on board at MM. RE Asset classes, the Growth Portfolio are all equities while the income portfolio has a mix of equities, hybrids & debt instruments.
I assume you mean which sector each stock comes into like as a basic example CBA as bank as opposed to traditional asset classes of equities, bonds and cash.
We are in the process of redesigning our website but unfortunately it takes time, any suggestions like this are very much appreciated.
We will endeavour to include more information around each holding in the new format,
Question 6
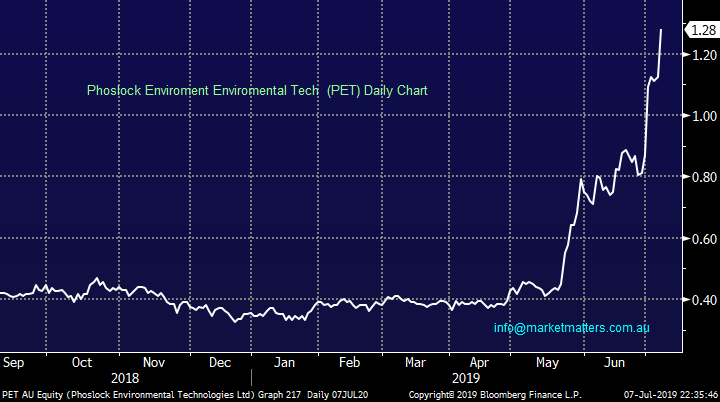
“Do you have a view or comments on Phoslock (PET) and the recent announcement of their deal in China which looks huge.” - Regards Peter Mc.
Hi Peter,
Investors have been aggressively buying PET following the results from their trial of a heavily polluted lake in South West China – remember China is on a huge environmental clean up campaign.
According to the company the trial resulted in a 75% reduction of phosphorus over the first 4- days with the results also showing no effect on fish, plant life, or humans. The results have led to an initial order of ~$1 million worth of Phoslock to be used on a section of the lake, if these results follow through this is extremely exciting news for PET and it’s a case of where to buy for decent risk / reward.
However PET has suddenly got a market cap. over $700m, that’s one great reaction to news but the shares are building in further positive news with our current optimum entry now ~$1.10.
MM is bullish PET technically but stops are currently under 85c.
Phoslock (PET) Chart
Question 7
“" hopefully it’s not retail investors piling into the “yield play” in an almost herd like mentality, a common characteristic of market tops." So I assume there is no CFTC (US) type outfit in Aus reporting on commitment of traders open interest and that your Bloomberg terminal doesn't help in this regard? It would be good to know if retail investors or "dumb money" is responsible for recent parabolic exuberance because you could probably predict a meaningful top. It was helpful when you said in June that funds were caught out with cash and had to buy a rising market to ensure their allocations matched the index at end of year (or at least I think that was the jist). Anyway, some analysts of CFTC COT data ignore mum & dad and assert that big funds are often long and wrong at market tops and their counterparty "commercials" are often in the better position. Anyway, just thoughts really, but am interested in whether your Bloomberg terminal helps with open interest data or maybe you use volume to help tell the story.” – Cheers JK
Hi JK,
An interesting question / thought without a specific answer, more a combination of information we pick up at MM. One way is looking at volume of specific brokers in specific stocks or instruments, retail broker flow is a good indicator of what retail money is doing and we source this through Bloomberg. The other is obviously talking with a lot of retail investors– we get a feel for how retail is feeling about certain asset classes.
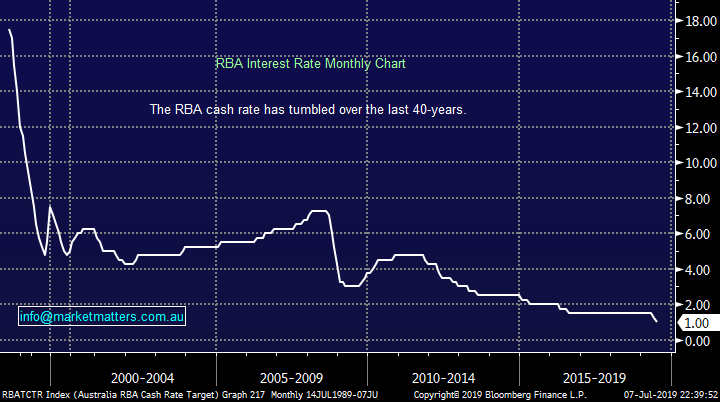
In short, MM looks at a number of sources to gauge investor $ flow but we feel $$ is moving out of fixed interest into riskier assets.
RBA Interest Rate Chart
Long-term CBA looks good implying investors will continue to buy the bank for yield in the years ahead.
Commonwealth Bank (CBA) Chart
Question 8
“Hello MM Team, Can you provide further information on the ETF Portfolio you launched in the Morning Report 03Jul19? This morning 2 recommendations were made for ETFs, however not with the customary percent allocations as applied in other portfolios. Are you planning to allocate % weights to ETFs, and typically how many ETFs would you expect the portfolio to hold at any one time?” - Regards, Lestyn B.
Hi Lestyn,
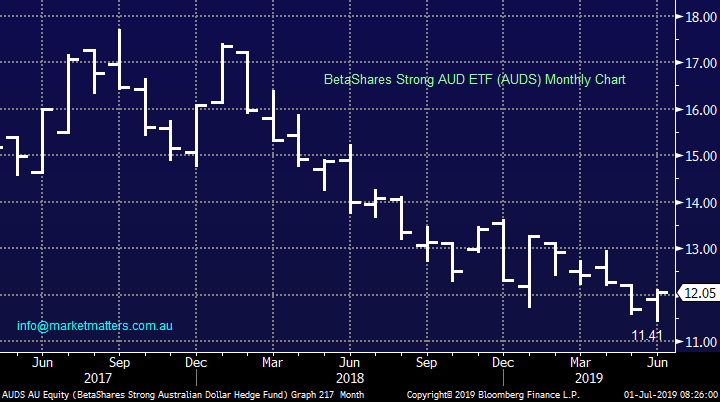
The ETF holdings are as follows: https://www.marketmatters.com.au/new-global-portfolio/
As you can see % allocations a have been included here and will be in future alerts, sorry for any confusion. We expect up to 10 positions at one time.
BetaShares Strong AUD Fund ETF Chart
Overnight Market Matters Wrap
· The US equities market eased back from hitting all-time highs overnight as investors worried about a lower likelihood of rate cuts by the Fed Reserve in the near future, leading the US ten year bonds back above 2%.
· US employment bounced back strongly in June, with 224,000 new jobs created vs expectations of 165,000 in June and 75,000 recorded in May.
· BHP is expected to underperform the broader market after ending its US session down an equivalent of -0.18% from Australia’s previous close.
· The September SPI Futures is indicating the ASX 200 to open marginally lower, testing the 6745 level this morning.
Have a great day!
James & the Market Matters Team
Disclosure
Market Matters may hold stocks mentioned in this report. Subscribers can view a full list of holdings on the website by clicking here. Positions are updated each Friday, or after the session when positions are traded.
Disclaimer
All figures contained from sources believed to be accurate. Market Matters does not make any representation of warranty as to the accuracy of the figures and disclaims any liability resulting from any inaccuracy. Prices as at 08/07/2019
Reports and other documents published on this website and email (‘Reports’) are authored by Market Matters and the reports represent the views of Market Matters. The MarketMatters Report is based on technical analysis of companies, commodities and the market in general. Technical analysis focuses on interpreting charts and other data to determine what the market sentiment about a particular financial product is, or will be. Unlike fundamental analysis, it does not involve a detailed review of the company’s financial position.
The Reports contain general, as opposed to personal, advice. That means they are prepared for multiple distributions without consideration of your investment objectives, financial situation and needs (‘Personal Circumstances’). Accordingly, any advice given is not a recommendation that a particular course of action is suitable for you and the advice is therefore not to be acted on as investment advice. You must assess whether or not any advice is appropriate for your Personal Circumstances before making any investment decisions. You can either make this assessment yourself, or if you require a personal recommendation, you can seek the assistance of a financial advisor. Market Matters or its author(s) accepts no responsibility for any losses or damages resulting from decisions made from or because of information within this publication. Investing and trading in financial products are always risky, so you should do your own research before buying or selling a financial product.
The Reports are published by Market Matters in good faith based on the facts known to it at the time of their preparation and do not purport to contain all relevant information with respect to the financial products to which they relate. Although the Reports are based on information obtained from sources believed to be reliable, Market Matters does not make any representation or warranty that they are accurate, complete or up to date and Market Matters accepts no obligation to correct or update the information or opinions in the Reports. Market Matters may publish content sourced from external content providers.
If you rely on a Report, you do so at your own risk. Past performance is not an indication of future performance. Any projections are estimates only and may not be realised in the future. Except to the extent that liability under any law cannot be excluded, Market Matters disclaims liability for all loss or damage arising as a result of any opinion, advice, recommendation, representation or information expressly or impliedly published in or in relation to this report not withstanding any error or omission including negligence.


