Subscribers questions (KDR, CYB, AWC, BHP, MWR, OSH, JMS, CKF, CHF)
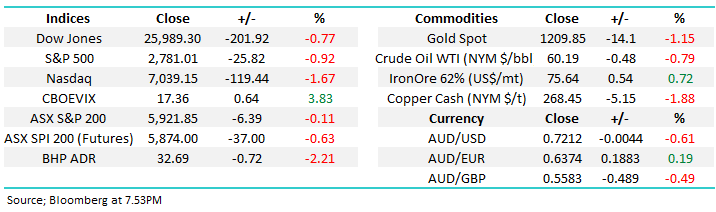
It feel like this morning will be another test of the ASX200’s resolve with some major stocks trading ex-dividend over the next 48-hours plus some negative influences from overseas indices; the combination of ANZ / Macquarie today and Westpac on Tuesday going ex-dividend will take around 15-points from the index.
The news flow was relatively quiet over the weekend although the press almost seem to take pleasure from telling us that Sydney auction clearance rates are nearing historic lows and housing prices are going to continue their recent decline. As we said in the Weekend Report the Hayne Royal commission and APRA have combined to strangle lending in Australia – the RBA and Treasurer are already making noises of concern. We believe this will ultimately become good news for banks as the government / RBA takes the brakes off lending, coming full circle = making money!
MM is sticking with our unpopular thesis that the banks will outperform over the next 1-2 years while providing excellent yields e.g. Westpac (ASX:WBC) 6.8% fully franked on Tuesday.
This morning the resources are likely to come under reasonable early pressure with BHP Billiton (ASX:BHP) closing down 80c / 2.4% in the US, I feel the banks will need to remain firm or we may see a rapid pullback back under 5800 by the local index. We are now far more cautious the ASX200 after its hit our short-term 5925 target – a begrudging pullback towards 5800 is our preferred scenario.
Thanks again for some more excellent questions, and sorry if we could not get to all of them - as always please keep them coming!
ASX200 Chart
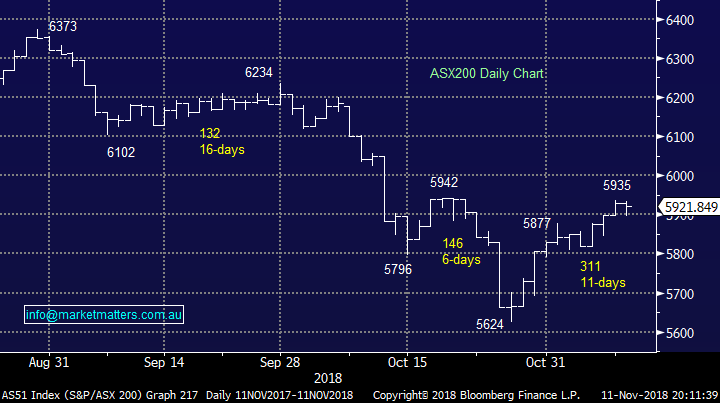
A quick chart for the subscribers who like / follow some of our technical commentary.
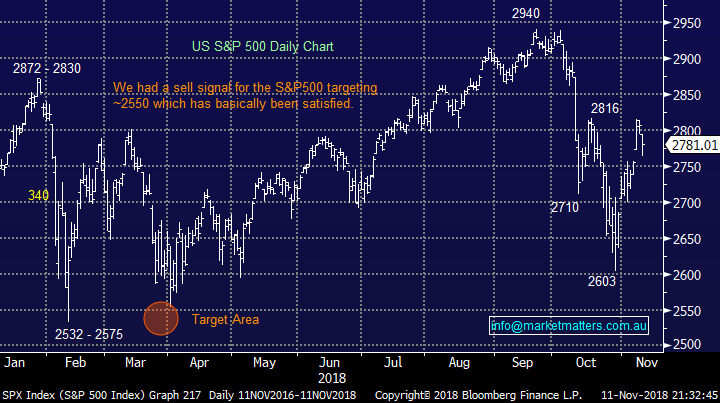
Our preferred scenario for the US S&P500 is a pullback back towards 2700, around 3% before a Christmas rally. i.e buy the higher low before a Christmas rally.
US S&P500 Index Chart
Question 1
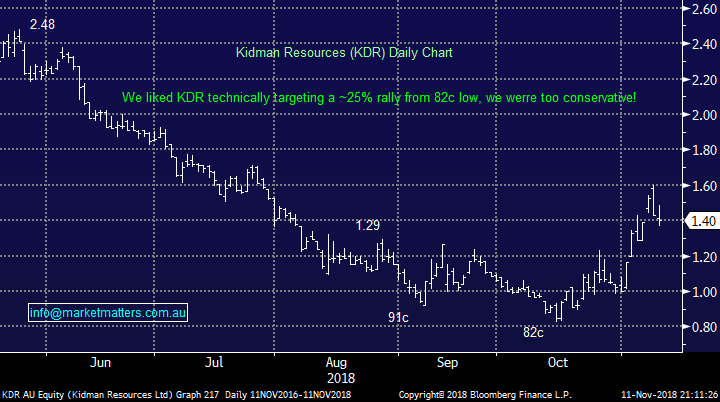
“Hi James, you certainly predicted the right time to buy KDR, 50% gain since in a very short period of time. My question is, why didn’t you buy it? The same goes now for CYB. You are bullish on it, so are you buying? If not, why not?” - Regards, Paul H.
Hi Paul,
MM operates a real money portfolio and at times the constraints of this reality can be frustrating. In the case of Kidman Resources (ASX:KDR) we already hold Mineral Resources (ASX:MIN) in the Growth Portfolio which has significant lithium exposure hence we decided not to double up into the volatile sector – MM had discussed this in previous reports before KDR triggered our technical buy signal. If the overall market was in a more bullish position we may have considered a more aggressive posture in both, but it wasn’t, so we didn’t. Clearly in hindsight, being more aggressive in a volatile sector would have paid off in that instance.
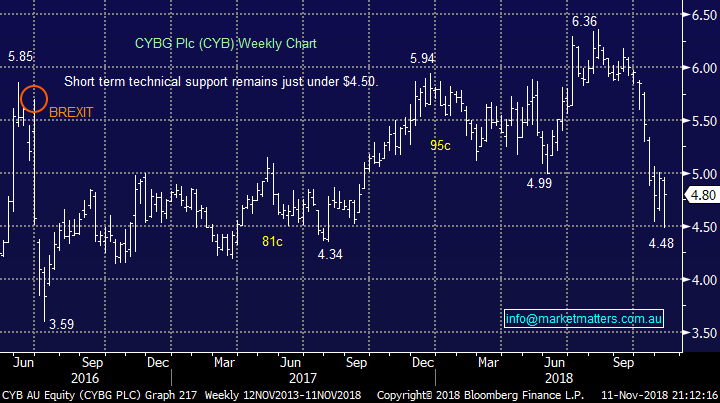
Similarly with CYBG Plc (ASX:CYB) we already hold a large banking exposure and our Janus Henderson (ASX:JHG) holding already has leverage to any positive outcome from BREXIT. Overall we decided not to switch between positions but these situations are an illustration that the way forward over the next few years is active investing.
Kidman Resources (KDR) Chart
CYBG Plc (CYB) Chart
Question 2
“Hi Market Matters. We are self-funded retirees. We have just taken some profit in a shareholding and are looking to re-invest. The banks look interesting at current levels, but we are already heavily invested in CBA, ANZ and NAB at levels about 5% above current prices. Would prefer to diversify. We are very underweight resources. I notice that AWC is today selling at about $2.51, a little under the price point MM entered at in October. P/E very low at about 8.0, excellent yield at 8.0% fully franked (pace bill Shorten!). Do you guys still see AWC as a good buy? Does MM see the dividend as sustainable? How does the technical set up look for an entry at today’s share price? any info much appreciated.” – Karl B.
Hi Karl,
Just a reminder that we can only offer general stock advice which may or may not be relevant for your situation.
In terms of resources there are pockets that offer some excellent yield following in some instances, strong corrections from recent highs although we all have to remain aware of the huge influence of China on the underlying commodity prices – a US-China trade war is bad news for resources and the overall market.
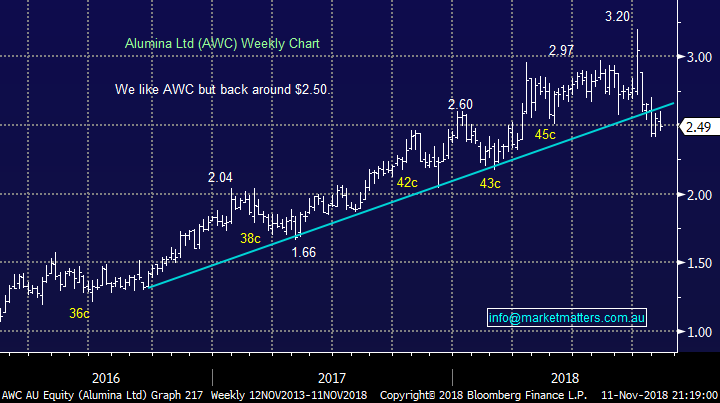
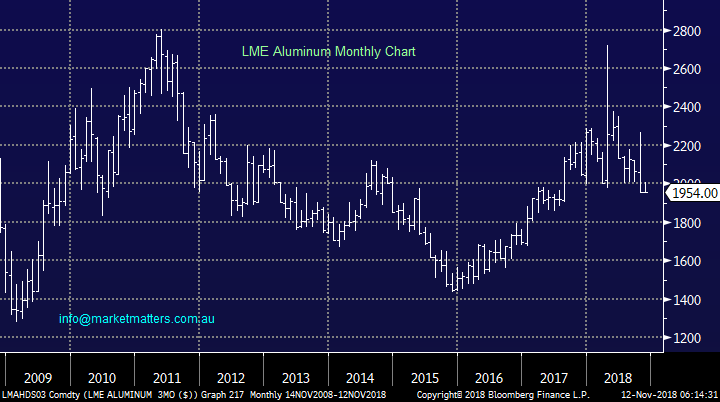
Alumina’s (ASX:AWC) dividend certainly feels sustainable while the aluminium price remains firm but both can always fall, a good reason for diversification when investing for yield. Technically we like the $2.50 area for AWC, well over 20% below the years high, with a period of consolidation feeling likely. In our Income Portfolio we hold AWC and Fortescue (ASX:FMG) which both provide excellent yields.
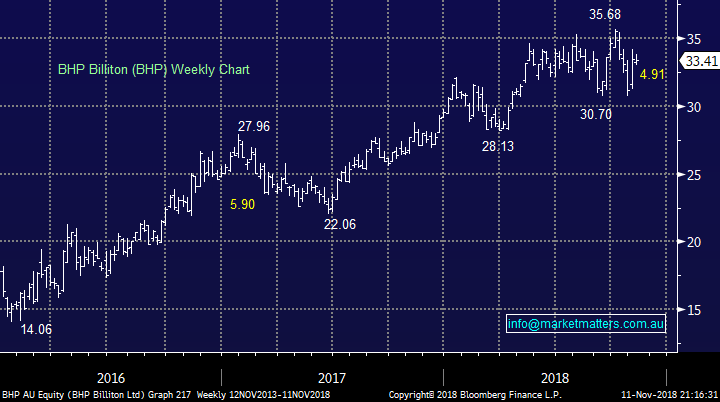
Even market / sector heavyweights BHP (ASX:BHP) and RIO Tinto (ASX:RIO) are currently offering close to 5% fully franked. For those more sophisticated investors, a buy and write option strategy on BHP given the upcoming special dividend could yield an excellent yield over the next 10 months or so. For more information email [email protected]
Alumina Ltd (AWC) Chart
LME Aluminium Price Chart
Question 3
“Hi MM Team, have you run the numbers on the BHP off-market buyback? Assuming that the shares are bought back at the 14% discount, I imagine there is a tax rate below which this makes sense, but for anyone above this threshold the buyback is only worth it if you are looking for a big capital loss?” - Thanks Craig D.
Hi Craig,
The deal is structured as a small capital amount and a large fully franked dividend. The franking benefit for those in a zero or low tax environment creates the opportunity. While the pricing of the deal will play out during 10th to the 14th of December, based on the current prices the offer will make sense for some holders.
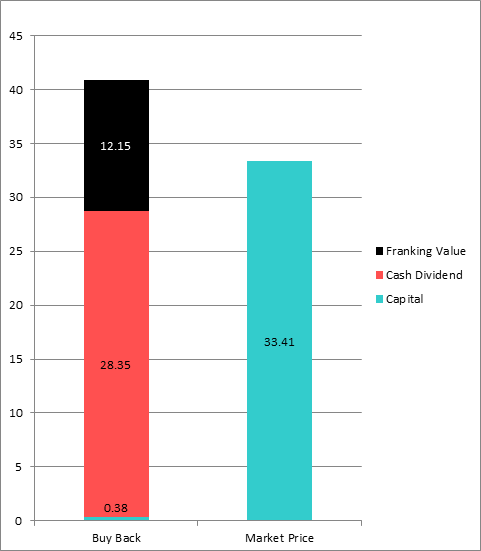
In short, BHP has made an offer to buy back stock at a discount to the market price – somewhere between an 10% and 14% discount. Given recent history the 14% discount will likely play out. So, for explanation sake, based on Fridays close of $33.41 BHP (ASX:BHP) will offer to buy back shares at $28.73 – a poor deal on face value. However, the deal is structured with a small capital component ($0.38) and the balance being a fully franked dividend.
Subtracting the capital component of $0.38 from the assumed offer price of $28.73 ($33.41 minus 14%), we get a dividend amount of $28.35 fully franked. The gross value (after franking) of that dividend is therefore $40.50 ($28.35/0.7) plus the $0.38 capital component giving a total value of $40.88 after tax for those currently enjoying a zero tax environment.
By the look, for those in a super fund paying 15% tax there is still a benefit of around 9% based on the assumed prices. The cut off seems to be around the 27% mark in terms of tax rate, however I’ll endeavour to put out a spreadsheet in the next few days.
Structure of the buy back versus current market price
BHP Billiton (BHP) Chart
Question 4
“Hi James, As a young Dad, I wondered if you thought MWR had some market potential. They look to have a good product that could appeal to anxious parents.” – Nick A.
Hi Nick,
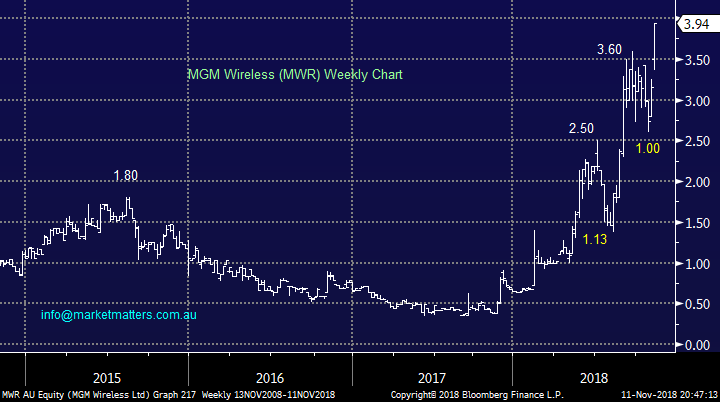
MGM Wireless (ASX:MWR) provides technology solutions for schools, ranging from attendance management, parent engagement to more sophisticated artificial intelligence which relies on predicting algorithms around attendance, behavioural data etc . A great idea and to date a great business which operates in Australia, NZ and America but the stock only has a market capitalisation of $47m with a usual daily turnover under $1m making it impossible for us to invest / recommend due to liquidity.
The stocks more than doubled in 2018 increasing the risks of chasing the shares higher – however it has corrected 52% and 28% in 2018 along the way. Technically I would either look to buy a decent pullback or use stops below $3.50 as the stock’s clearly demonstrated its ability to correct hard.
But in simple terms, I like the story.
MGM Wireless (MWR) Chart
Question 5
“Hi James, do you have a view on the latest CBA hybrid which yields almost 6% as new issue as an addition to an income portfolio? thanks again,” – Robert J.
Hi Robert,
We covered the new CBA Hybrid in the Income Report last week – here’s what we said in case you missed it. CBA have recently launched a new hybrid being the CommBank PERLS XI Capital Notes (CBAPH). It’s being issued to replace the existing CBAPC. Distributions are fully franked, paid quarterly at a floating rate of between 3.70% - 3.90% per annum above the 90 day BBSW rate.
When looking a security like this we review the structure, term, credit quality of the issuer and whether or not the rate stakes up relative to these factors;
Structure; Tier 1 hybrid with all the usual conditions – no issue with this
Term: First call date on 24th April 2024, which is shorter dated than some recent issues – no issues here
Issuer; CBA are sound – no issues here
Rate; Relative to recent issues plus current trading margins for similar securities, the CBAPH looks on the cheap side
All in all, this looks like a good value security, the issue is around availability given the reinvestment offer – it will likely be tight.
Question 6
“Hi James, do you have a view on the emerging listed property debt financing sector? The movement to fill the financing gap vacated by the banks in the wake of the RC is intuitively attractive. However with high returns comes higher risk of course. Higher risk can be addressed by identifying the best managers in this space. Given that Qualitas Real Estate Income Fund (QRI) will be listed on the ASX, does this come within your area of consideration for the income fund?” - regards, Robert
Hi Robert,
This is another Listed Investment Trust (LIT) similar to MXT that is looking to list on the ASX. The MM Income Portfolio already holds MXT which is involved in offering loans to real-estate projects, however the main difference between MXT and Qualitas is that MXT issues loans to borrows whereas the Qualitas fund is looking across the spectrum, including debt and equity for commercial real estate transactions, and that makes it a risker proposition. The fee structure is high at a 1.50% p.a. management fee as well as a 20.00% performance fee for outperformance above the 8.00% p.a mark while MXT charges a 0.70% management fee and 15% outperformance against its benchmark. Fee’s aren’t the be all and end all, however in a real-estate vehicle like this that can invest in debt and equity, the performance fee structure means there is more incentive to focus on higher risk higher return opportunities.
I had a call about this fund some time ago with the promoters, and they were struggling to raise the funds by the sound of it, however they have now raised at least the $150m minimum needed to list with the offer closing tomorrow. Given the Income Portfolio held MXT already and the fee structure I think is too high on Qualitas, I haven’t looked into the offer in any further depth. Evans and Dixon are involved with this deal and they’re known for high fee real-estate products that often involve various parts of their associated businesses collecting fees, although I don’t know if that’s the case this time around. We don’t plan to add this to the Income Portfolio at this stage
Question 7
“After reading the 3rd Oct Morning report I bought OSH at $8.90 as the suggested short term play. Sitting on a loss now as the oil price falls. Should I dig in or cut and run?” – Bruno F.
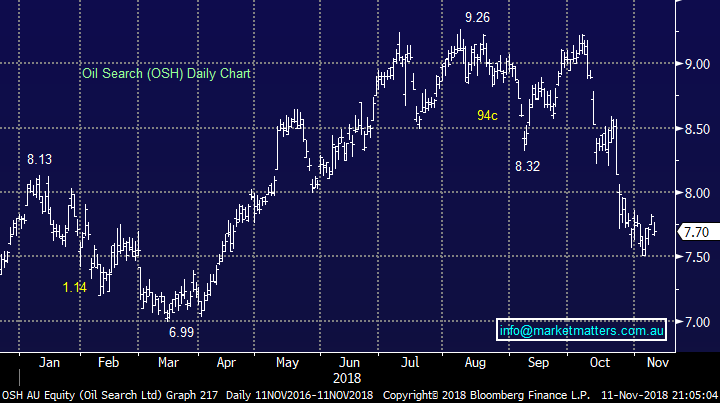
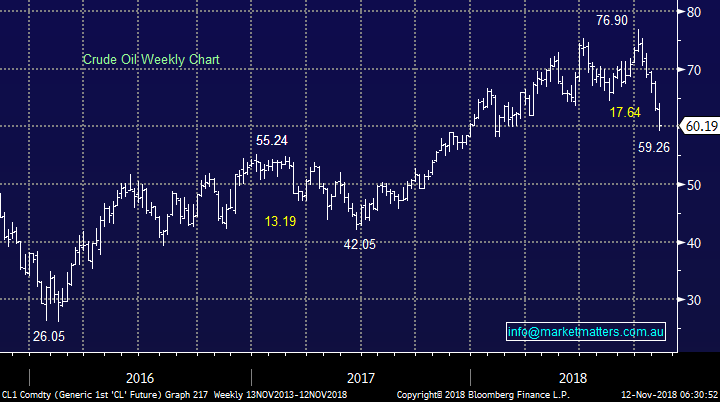
Hi Bruno, Sorry to hear that, it’s certainly been a very tough few weeks for the sector and Oil Search (OSH). We didn’t take the trade at the time, although we didn’t take Kidman either which nearly doubled after we wrote about it. Crude oil fell again on Friday taking its recent decline well over 20%, we believe the $US60/barrel area should offer excellent support for both oil and the energy sector but only time will tell if this 6-week decline can at least take a rest.
From a technical perspective OSH looks to be positioned for a bounce towards $8 but an eventual test of $7.25 would not surprise – the downside momentum is unfortunately solid.
Oil Search Ltd (OSH) Chart
Crude Oil Chart
Question 8
“Hi Guys, thanks again for your informative emails. I would like your thoughts on a couple of stocks I own- JMS, thinking of buying more because of the excellent dividend, and CKF- is it getting close to time to sell?” - Thanks, Richard L.
Hi Richard,
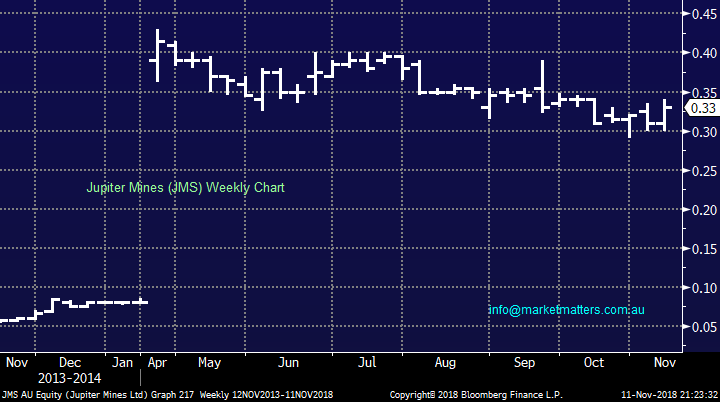
Relisted manganese miner Jupiter Mines (ASX:JMS) has performed ok since Investec exited the company in August.
The stocks IPO in April was one of the resources sectors largest in the last decade with the business performing well on both the targets and cash front.
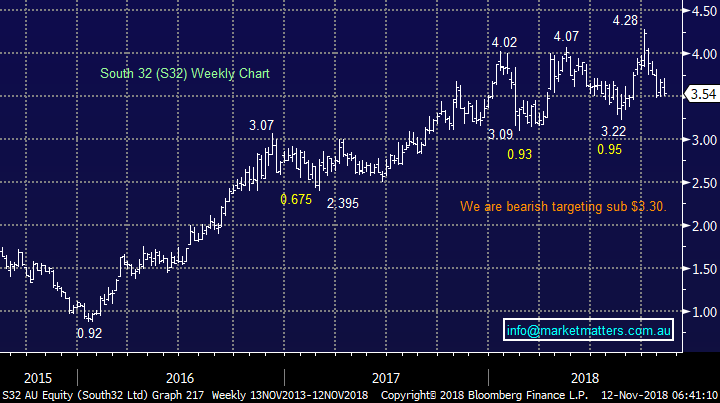
We note that MM is bearish the more established local manganese play South32 (ASX:S32).
With JMS only having paid one dividend so far its hard to gauge the reliability of any dividend flow but they are doing everything correct so far.
Jupiter Mines (JMS) Chart
South32 (S32) Chart
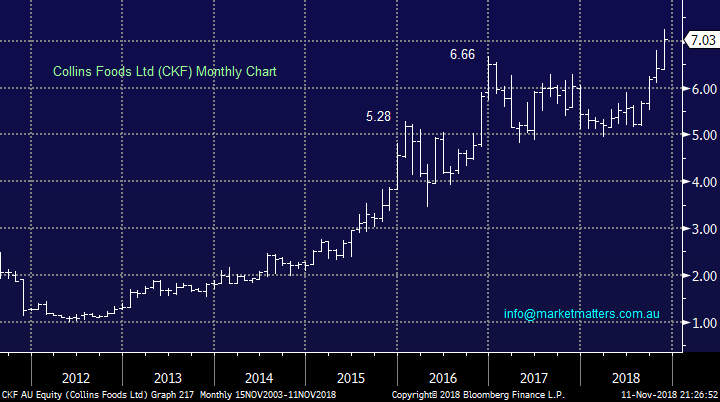
Collins Foods (ASX:CKF) operates convenience restaurants, KFC and the like and has surged higher on optimism around its plans for well known brand Taco Bell although it should be noted they make the most money from KFC. This is 3rd time lucky for Taco Bell in Australia showing the markets confidence in Collins Foods from an implementation perspective. The stock clearly has enjoyed a great 2018 as “fast food” remains a an entrenched part of many people’s daily lives (Alex!)
The stock currently trades on an Est P/E of 18.3x for 2019 while yielding under 3% fully franked – there is clearly some optimism in today’s share price.
While I’ve never eaten Taco Bell I am partial to a Zinger burger however its not a stock I’ve looked at in depth for a while, so I’ll provide a technical angle on this one.
CKF is bullish while it holds above $6.50 although I can see the logic in taking part profit into optimism.
Collins Foods (CKF) Chart
Question 9
“Hi, just wanted your opinion on CHF” - Thanks Ross T.
Hi Ross,
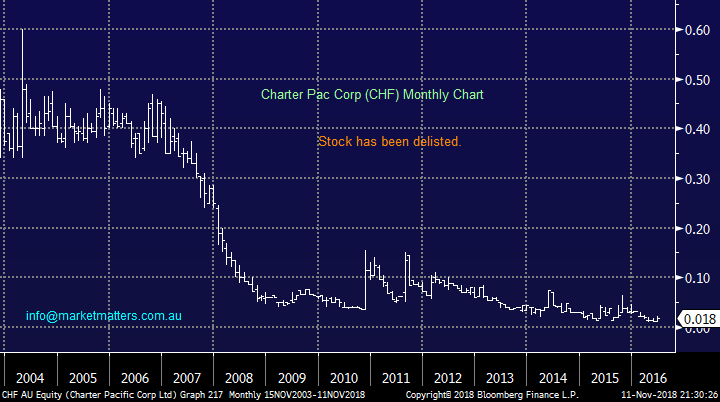
I assumed you meant the stock CHF as opposed to the Swiss Franc. Unfortunately the stock was delisted back in 2017 so not a great deal more I can add. If you meant Challenger (ASX:CGF) and your email was a typo, we mentioned it in Weekend Report liking the stock into current weakness.
Charter Pac Corp (CHF) Chart
Overnight Market Matters Wrap
· The US followed Asia’s lead last Friday, with all 3 majors ending red, as risk was definitely taken off the investors’ table as crude oil continued to slide, along with concerns of growth in China and relative emerging markets region.
· BHP and its relative peers are expected to underperform the broader market after ending its US session down an equivalent of 2.21% from Australia’s previous close.
· Domestically ANZ Bank and Macquarie Group (MQG) are trading ex-dividend paying $0.80 and $2.15 a share respectively.
· The December SPI Futures is indicating the ASX 200 to start the week in the red and open 46 points lower towards the 5875 level this morning.
Have a great day!
James & the Market Matters Team
Disclosure
Market Matters may hold stocks mentioned in this report. Subscribers can view a full list of holdings on the website by clicking here. Positions are updated each Friday, or after the session when positions are traded.
Disclaimer
All figures contained from sources believed to be accurate. Market Matters does not make any representation of warranty as to the accuracy of the figures and disclaims any liability resulting from any inaccuracy. Prices as at 12/11/2018
Reports and other documents published on this website and email (‘Reports’) are authored by Market Matters and the reports represent the views of Market Matters. The MarketMatters Report is based on technical analysis of companies, commodities and the market in general. Technical analysis focuses on interpreting charts and other data to determine what the market sentiment about a particular financial product is, or will be. Unlike fundamental analysis, it does not involve a detailed review of the company’s financial position.
The Reports contain general, as opposed to personal, advice. That means they are prepared for multiple distributions without consideration of your investment objectives, financial situation and needs (‘Personal Circumstances’). Accordingly, any advice given is not a recommendation that a particular course of action is suitable for you and the advice is therefore not to be acted on as investment advice. You must assess whether or not any advice is appropriate for your Personal Circumstances before making any investment decisions. You can either make this assessment yourself, or if you require a personal recommendation, you can seek the assistance of a financial advisor. Market Matters or its author(s) accepts no responsibility for any losses or damages resulting from decisions made from or because of information within this publication. Investing and trading in financial products are always risky, so you should do your own research before buying or selling a financial product.
The Reports are published by Market Matters in good faith based on the facts known to it at the time of their preparation and do not purport to contain all relevant information with respect to the financial products to which they relate. Although the Reports are based on information obtained from sources believed to be reliable, Market Matters does not make any representation or warranty that they are accurate, complete or up to date and Market Matters accepts no obligation to correct or update the information or opinions in the Reports. Market Matters may publish content sourced from external content providers.
If you rely on a Report, you do so at your own risk. Past performance is not an indication of future performance. Any projections are estimates only and may not be realised in the future. Except to the extent that liability under any law cannot be excluded, Market Matters disclaims liability for all loss or damage arising as a result of any opinion, advice, recommendation, representation or information expressly or impliedly published in or in relation to this report notwithstanding any error or omission including negligence.


