Subscriber’s Questions (IRE, PDN, NWH, RFG, KDR)
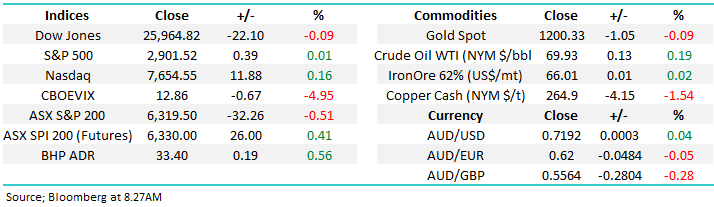
Today is the first trading day of spring and it looks likely to be a positive start for stocks with the futures calling the ASX200 to open up around 35-points. With the US on holiday tonight expect volumes to be muted which could result in potentially large market moves if any major news does cross the screens.
However, the weekend provided little in the way of news with housing auction clearance rates remaining subdued below 60%, no great surprise to many. Later in the week Australian investors / traders will be watching the countries growth figures (GDP) for any signs of a negative influence from the drought with data outside of expectations is likely to have an impact on the $A which is already trading at 20-month lows while I type, around 71.85c.
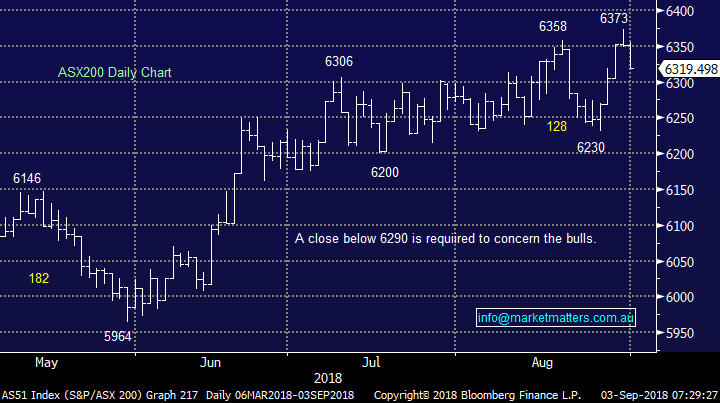
· We are neutral the ASX200 while the index holds above 6290 but we remain in “sell mode” albeit still in a patient manner.
Thanks again for some more great questions, we love answering them so please keep the coming!
ASX200 Chart
Question 1
“Hi James, your morning reports say you are in “Sell” mode, so why are you buying? Sorry, I’m confused.” - Paul H.
Hi Paul,
A great question because in hindsight the same point may have confused a number of subscribers.
We believe global equities are in the late stages of the longest bull market in history, one that has been in part fuelled by almost “free money” post the GFC – in the Weekend Report we pointed out this very same ultra-low interest rate environment has led to a remarkable doubling of global debt compared to before the GFC, a scary thought in our opinion.
When stock markets are in the later stages of bull markets they tend to rally strongly, often further and for longer than many expect, this one already feels testament to this characteristic.
Our view for the global figurehead Dow Jones has not changed in any meaningful way since January, and is illustrated by the chart below.
US Dow Jones Chart
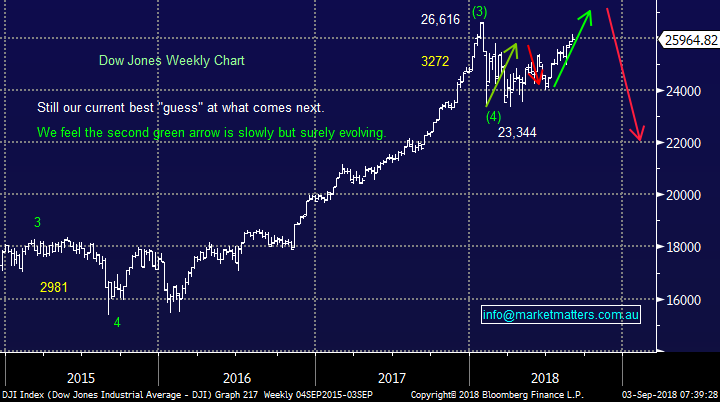
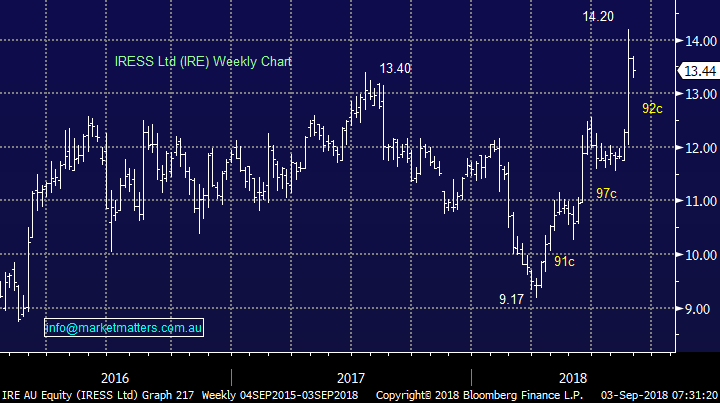
This shows we believe US stocks are close to a reasonable pullback towards the 2018 lows BUT we have not yet received any major “sell signals”. We remain comfortable to initiate more short-term investing oportunities when they present themselves, our recent 17% gain from Iress (IRE) was a great example of this.
Consider the market since early 2016 the ASX200 is up +34%, BHP +136% but CBA is down over -16% - all returns are before dividends. The point being in rising market some stocks / sectors fall and vice versa. Currently we believe the embattled resources sector is slowly presenting some good risk / reward, MM actually sold out of the sector while we were still bullish equities earlier in the year.
In conclusion, our “sell mode” is reflected by a cash position of 18% plus 2 short stock market ETF positions i.e. the Bear & BBUS.
Over recent years when we have been bullish we have held alomost 100% stock market exposure while when we were bearish in 2015 our cash position was over 50%, at present we are slowly migrating towards the later.
Iress (IRE) Chart
Question 2
“James or Harry, do either of you know how to determine levels of cash that fund managers globally are holding?” – Shayne G.
Hi Shayne,
We use the Bank of America fund managers’ survey which comes out monthly, we often refer to it in our reports – July’s results can already be largely sourced with a little bit of Google search skill.
Presently fund mangers see a trade war as the largest risk to assets and have significantly reduced their exposure to emerging markets with the greatest withdrawal in over 2-years.
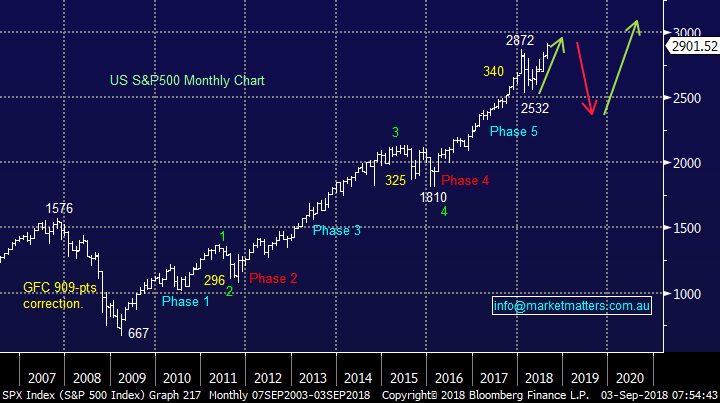
Fund managers are still sitting 19% overweight global equities but it’s now at the lowest level since November 2016, however they increased their exposure to US stocks to 9% overweight hence our “quasi bond” analogy in the Weekend Report.
US S&P500 Index Chart
Question 3
“Hi Guys, I have been enjoying the trial of your reports. Just wondering if you do this for options at all?” - Thanks & Regards, Jason H.
Hi Jason,
The simple answer is yes we do, over the years MM has initiated a number of option trades when opportunities presented themselves, especially when volatility was ridiculously low in 2016/7.
Obviously the majority of subscribers do not use options but If you are after some specific assistance please drop myself, or Harry, a line.
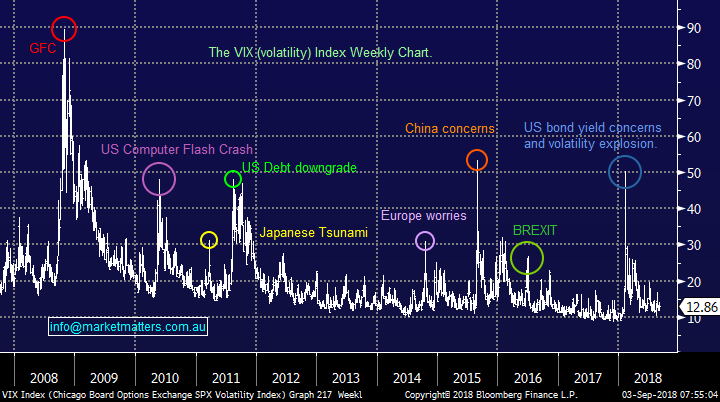
Volatility Index (VIX) Chart
Question 4
“Hi Team, keep up the good work. Any new thoughts on Paladin post the FY18 result and new Investor Presentation? The September Journal of Energy Policy notes Uranium in China to grow 7.7%pa to 2065 and that the Chinese govt should take advantage of 13-year lows in spot price to buy on market. The full paper makes a very bullish case for Uranium and the publishers advise the Chinese Government. Thanks in advance” – Rodney F.
Hi Rodney,
We have touched on PDN a few times over recent months with the stock garnering a fair bit of press since Paradise investments took a position earlier in the year.
There are plenty of arguments both for and against the uranium space and at this stage the uranium price is too low, however as you touched on increased China usage may slowly address this issue.
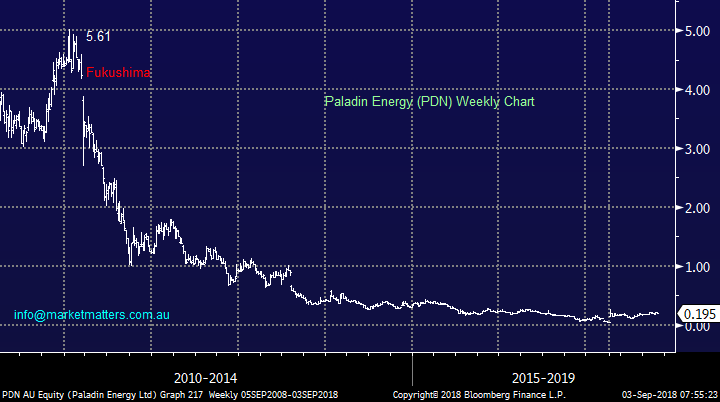
PDN is currently up 90% from its June low but from a longer term perspective it clearly is an unpopular stock.
· We could consider PDN as an aggressive long-term play around 17-18c, no need to chase yet, but we would be prepared for the stock to go to zero such are the present headwinds.
Paladin (PDN) Chart
Question 5
“Hi Guys, thanks for your daily emails, they make good reading. A question for you Monday email- I’ve held NWH from lower levels and they have had a bit of a run, what’s your view of the stock?” - Thanks Richard L.
Hi Richard,
The civil contracting services company based in WA has had a great few years along with other engineering / mining services stocks Worley Parsons (WOR) and Downer EDI Ltd (DOW).
The stock now trades on an Est. P/E of 15.7 while yielding just over 1%.
This is not a company we follow closely but management are forecasting revenue growth to pick up ~40% in 2019, exciting numbers. Our only concern is the mining stocks themselves have largely corrected 15-20%, unlike the mining services sector hence which we believe they now offer better risk / reward with regard to the major global trade war concerns.
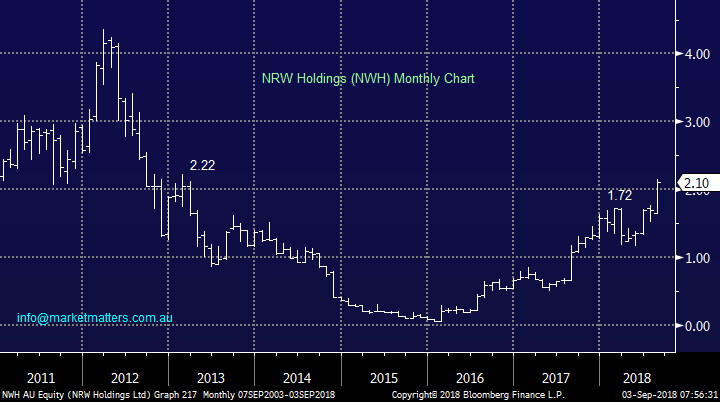
· Technically the NWH looks great while it can hold above $1.70.
NRW Holdings (NRW) Chart
Question 6
“Hi I was wondering if you could provide some commentary on the RFG result. I understand they have quite a bit of debt, I am more interested in the cash flow going forward. Also, in light of the coke takeover of Costas coffee, in the UK, doesn’t it show there is potential for this business?” – Arthur H.
Hi Arthur,
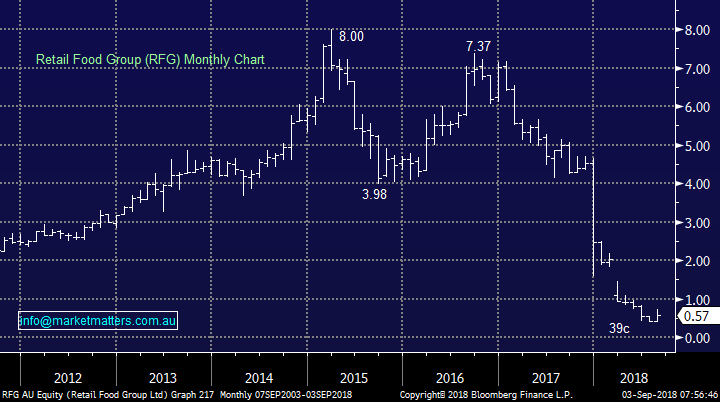
You have certainly taken us into the speculative end of town with RFG now trading below 60C after being a $7 stock about only 18-months ago.
RFG’s recent report missed expectations which were not that high to start with – a $307m loss, 123 stores closed and net debt above $250m compared to a market cap just over $100m.
The company is understandably considering a sale of assets and / or a cap raise to help pay off its debt. Selling assets would reduce RFG’s ability to earn income going forward while a cap raise would dilute existing shareholders but it’s hard to see any alternative. A little “financial engineering” may well see the stock pop higher short term.
· Unfortunately we now put RFG into the casino basket of trading shares and although its likely to bounce strongly at times it’s not for us.
Retail Food Group (RFG) Chart
Question 7
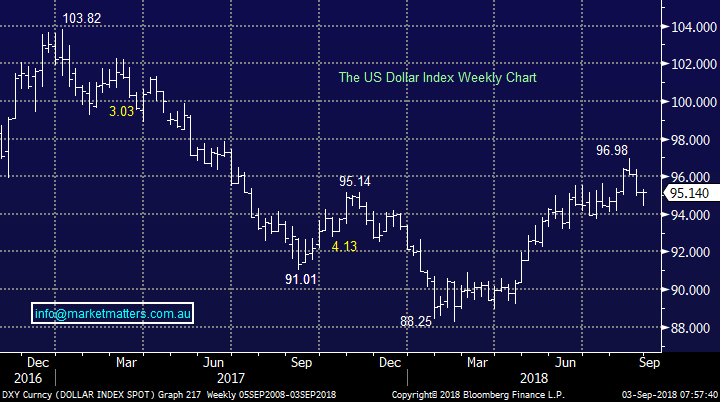
“Hi, the $A is falling but the $US looks to have peaked and US bond yields have stop rallying, isn’t the $A poised to bounce sending $US earners lower?” – Andrew W.
Hi Andrew,
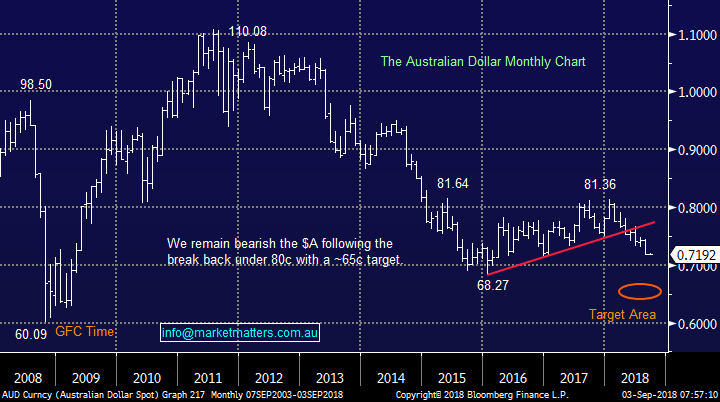
The $A has fallen around 10% already this year and a bounce would not surprise but there are 2 major issues keeping MM long the $US via an ETF’s:
1. The US economy continues to look far better positioned than our own especially into 2019/20 for reasons like household debt levels and our ingrained dependency on property prices which are currently struggling.
2. US interest rates look set to continue increasing while our own look likely to remain unchanged for at least another year producing far great income for holders of cash in $US.
If / when we do get a meaningful correction in $US earning stocks we may look to be buyers.
Australian Dollar ($A) Chart
$US Index Chart
Question 8
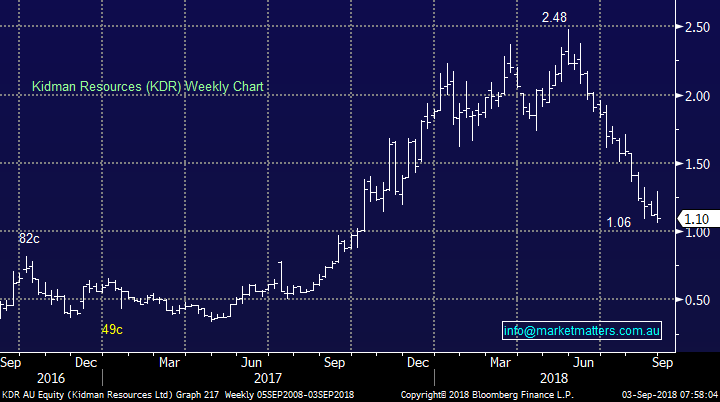
“Hi I have seen other high-profile commentators like KDR recently but it’s been savaged, is it time to be brave?” – Steve W.
Hi Steve,
I do believe KDR looks very interesting down here BUT I also did at $1.50!
· We like KDR around $1.10 looking for at least a 15% bounce – an aggressive play.
Kidman Resources (KDR) Chart
Overnight Market Matters Wrap
· The US closed with little change overnight as investors sit on the sideline digesting the current situation with the US-Canada trade talks as US President Trump makes headlines again, threatening to terminate NAFTA as both parties fail to reach an agreement.
· Domestic data where we envisage would impact our market this week are the RBA interest rate decision tomorrow and GDP on Wednesday.
· BHP is expected to outperform the broader market this morning, after ending its US session up an equivalent of 0.56% from Australia’s previous close.
· The September SPI Futures is indicating the ASX 200 to open 35 points higher towards the 6355 level this morning.
Have a great day!
James & the Market Matters Team
Disclosure
Market Matters may hold stocks mentioned in this report. Subscribers can view a full list of holdings on the website by clicking here. Positions are updated each Friday, or after the session when positions are traded.
Disclaimer
All figures contained from sources believed to be accurate. Market Matters does not make any representation of warranty as to the accuracy of the figures and disclaims any liability resulting from any inaccuracy. Prices as at 03/09/2018
Reports and other documents published on this website and email (‘Reports’) are authored by Market Matters and the reports represent the views of Market Matters. The MarketMatters Report is based on technical analysis of companies, commodities and the market in general. Technical analysis focuses on interpreting charts and other data to determine what the market sentiment about a particular financial product is, or will be. Unlike fundamental analysis, it does not involve a detailed review of the company’s financial position.
The Reports contain general, as opposed to personal, advice. That means they are prepared for multiple distributions without consideration of your investment objectives, financial situation and needs (‘Personal Circumstances’). Accordingly, any advice given is not a recommendation that a particular course of action is suitable for you and the advice is therefore not to be acted on as investment advice. You must assess whether or not any advice is appropriate for your Personal Circumstances before making any investment decisions. You can either make this assessment yourself, or if you require a personal recommendation, you can seek the assistance of a financial advisor. Market Matters or its author(s) accepts no responsibility for any losses or damages resulting from decisions made from or because of information within this publication. Investing and trading in financial products are always risky, so you should do your own research before buying or selling a financial product.
The Reports are published by Market Matters in good faith based on the facts known to it at the time of their preparation and do not purport to contain all relevant information with respect to the financial products to which they relate. Although the Reports are based on information obtained from sources believed to be reliable, Market Matters does not make any representation or warranty that they are accurate, complete or up to date and Market Matters accepts no obligation to correct or update the information or opinions in the Reports. Market Matters may publish content sourced from external content providers.
If you rely on a Report, you do so at your own risk. Past performance is not an indication of future performance. Any projections are estimates only and may not be realised in the future. Except to the extent that liability under any law cannot be excluded, Market Matters disclaims liability for all loss or damage arising as a result of any opinion, advice, recommendation, representation or information expressly or impliedly published in or in relation to this report notwithstanding any error or omission including negligence.
To unsubscribe. Click Here


