Subscribers questions (IFL, JHG, WOR, SSM, SFR, TLS, CAR, CYB, CYR)
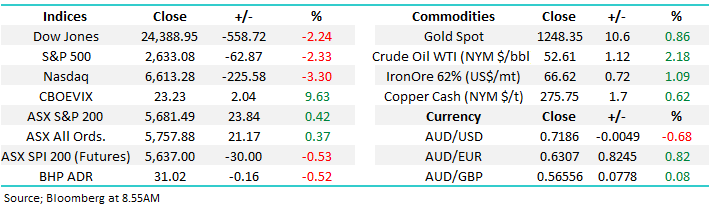
The ASX200 is likely to receive a real test this morning with the Dow tumbling over 550-points on Friday night, China’s economic data disappointing on Saturday plus Trump’s added some pressure to the mix as he lost his 2nd chief of staff in less than 1 ½ years. The SPI’s Saturday morning call for the ASX200 to open down around 40-points unfortunately feels optimistic this morning.
As discussed in the Weekend Report we remain bullish into January but with reduced conviction than over previous weeks i.e. we must remain open-minded that our contrarian call maybe wrong.
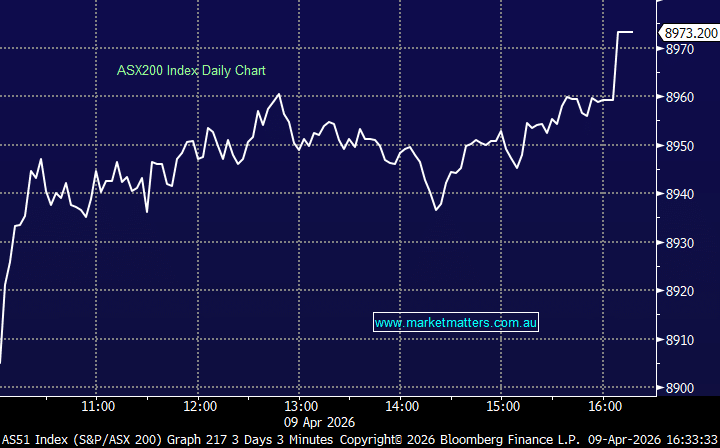
We remain short-term bullish the ASX200 short-term targeting the 5950-6000 area.
Thanks again for some great questions.
ASX200 Chart
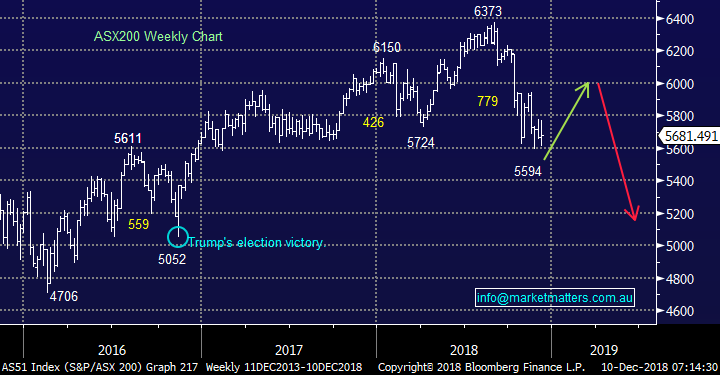
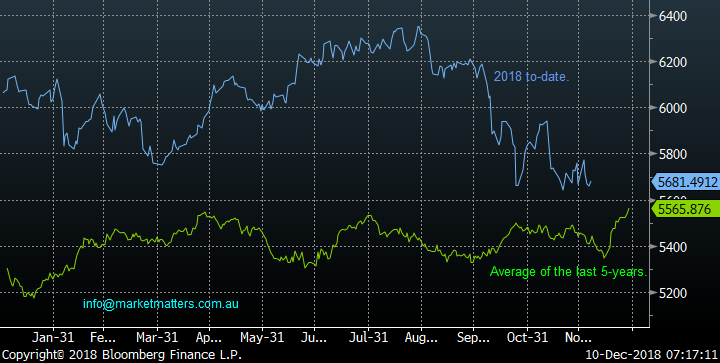
However, we must remember as doubts creep into our bullish call for the ASX200 into January that this week is the optimum timeframe for the start of a Christmas rally – it feels like crunch time is nigh for local stocks.
ASX200 Seasonality Chart
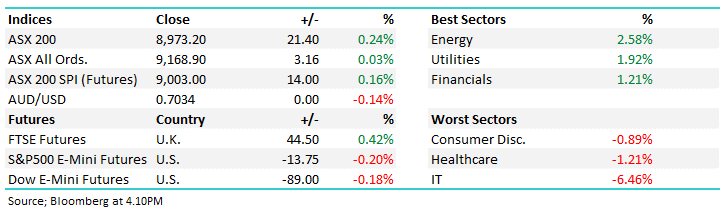
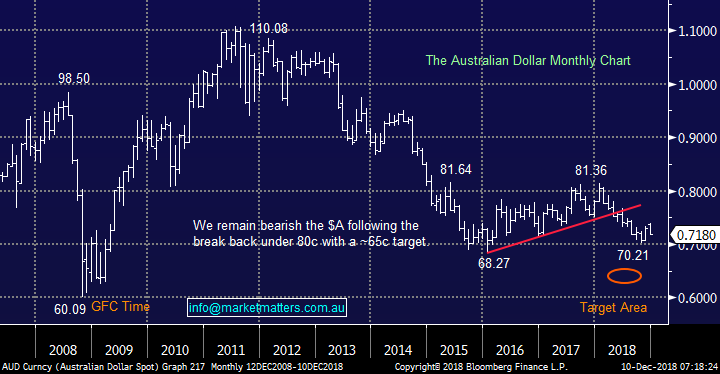
The $A this morning has fallen ~0.4% well below the psychological 72c area. Two quick takeout’s from this:
1 – The poor Chinese data is being recognised by markets which implies a tough day for risk assets like equities.
2 – The $US earners should continue to outperform following last weeks strong showing e.g. CSL Ltd (ASX: CSL), Cochlear (ASX: COH) and ResMed (ASX: RMD).
The Australian $A Chart
Question 1
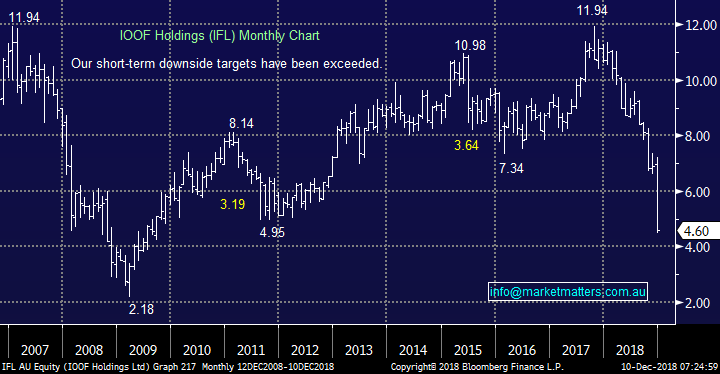
“Hi James, I know you do not give personal advice but what are your thoughts on IFL do you think it's a top up after today's sell off, I am sitting on quite a bit of cash at the moment” - Kind regards Malcolm F.
Hi Malcolm,
Well played sitting a decent cash levels as stocks test their 2018 lows, a ~12% correction from the years high. Thanks for acknowledging we cannot give Personal Advice but I can give our opinion on IFL and another stock in the sector:
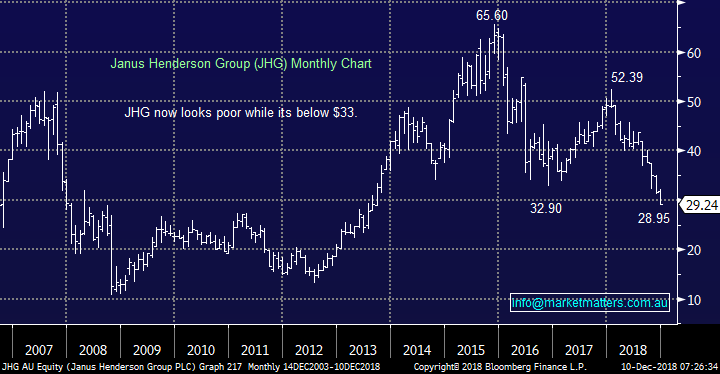
As I touched on in the Weekend Report MM would not be considering IFL after last week’s news, remember how long / far AMP fell after they came foul of the corporate regulator, a lot more than a few days! We prefer Janus Henderson (ASX: JHG) in the space, a stock we own in the Growth Portfolio. JHG is extremely out of favour at present that its valuation is so low the stocks yield has risen to 6.4% (unfranked).
That said, at this stage I think the momentum is clearly on the downside for JHG, at the moment and some semblance of supports needs to be found first. Moving into 2019 we can see the ASX200 at 5000 in the next 1-2 years so therefore, we would only be deploying cash in a slow selective manner i.e. we expect to be overweight cash for large periods of 2019.
IOOF Holdings (ASX: IFL) Chart
Janus Henderson (ASX: JHG) Chart
Question 2
“Hi MM Team, like to know your technical/fundamental view for WorleyParsons (ASX: WOR) and Service Stream (SSM). Also, you have traded Oz minerals in the past but in your recent reports you have mentioned Sandfire (ASX: SFR), just wondering why??” - Thanks Tim C.
Hi Tim,
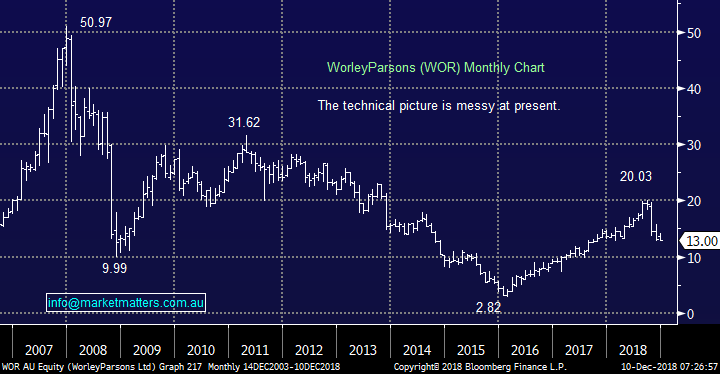
WOR is Australia’s largest oil and gas engineering group which is now set to almost double its revenue after announcing that it was buying the energy, chemicals and resources (ECR) division of US-listed Jacobs Engineering Group Inc for $4.6 billion. However the purchase came at a cost with a share entitlement offer at $15.56 which was at a 12.8% discount to the share price but now the extra purchased shares are over 16% underwater. However we did love to see the Chairman buy $100m of the entitlement offer, that’s a lot of skin into the game!
We liked the deal but when the oil price tumbles, as it has, WOR has not surprisingly followed.Technically at this stage we have no decent risk / reward signals and the extra stock on issue from $15.56 will likely provide a decent cap on the share price for while
MM is Neutral here on WOR
WorleyParsons (ASX: WOR) Chart
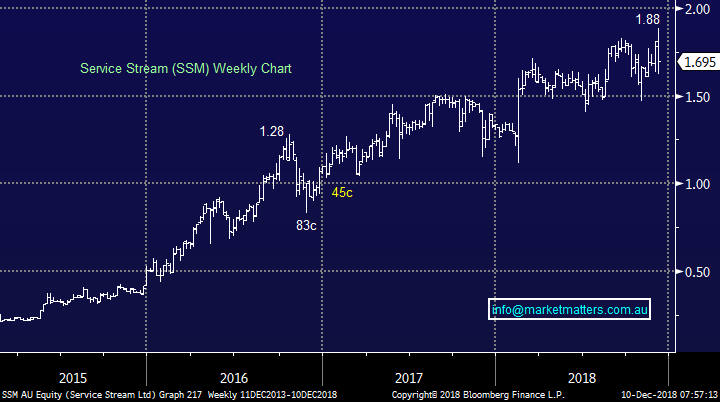
Telecom network services provider SSM is not a company we have mentioned often but its undoubtedly enjoyed a strong few years. The stock surged higher in February when they announced a major buyback, since the company has acquired and cancelled 4.6 million shares with share buybacks likely to continue.
The stocks is relatively cheap trading on an Est P/E for 2019 of 13.1x while it yields 4.4% fully franked.
Technically we can see a retracement below $1.50 and ideally ~$1.35.
MM likes SSM and a move below $1.50/$1.40 would be a good entry point.
Service Stream (ASX: SSM) Chart
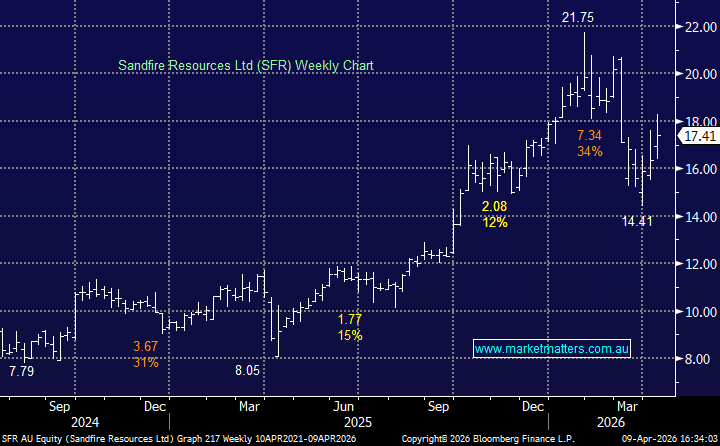
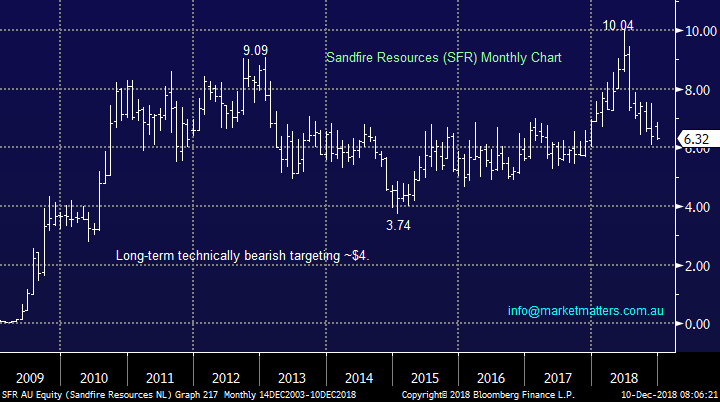
Lastly we simply prefer Sandfire (ASX: SFR) on a valuation basis, it is now trading on an Est. P/E for 2019 of 8.7X compared to Oz Minerals (ASX: OZL) which is trading on an Est P/E for 2018 of 13x.
However in both cases, the stocks now look bearish longer term.
Sandfire Resources (ASX: SFR) Chart
Question 3
“As I understand it, the auction for the remainder of the Australian 5G spectrum is pending in December, and Telstra have forecast expectations that this will be a big growth area for them.
I expect they’ll bid fairly aggressively at the auction. Do you see a short-term share price stimulus from a successful bid, or are 5G rights already priced into the TLS share price?” – Thanks Charlie N.
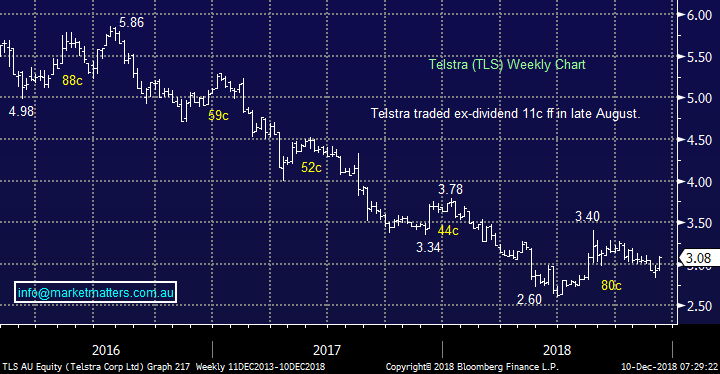
Hi Charlie, I would expect a decent bounce if they are successful but it must be at a fair price! We also see TLS benefitting from a “safety bid” if the ASX200 does continue to struggle – usually an environment when the Telco’s outperform.
MM likes TLS around $2.75 while also planning to sell / reduce our holding above $3.50.
NB 5G is the upcoming super-fast next generation mobile network and this mobile space should be highly profitable for whoever dominates.
Telstra (ASX: TLS) Chart
Question 4
“HI, I love your work it’s been rewarding. When possible, can your team comment on CAR?? It has dropped steadily by about 25% over last 4-months on no really bad news that I can discern. Is there something going on in their space that is making their outlook bad??
Also, I would appreciate a clarification about how you arrive at your “ABC” targets--I always used an “A to B will equal C to D “style thing, but yours seems different?” - Kind Regards Paul A.
Hi Paul,
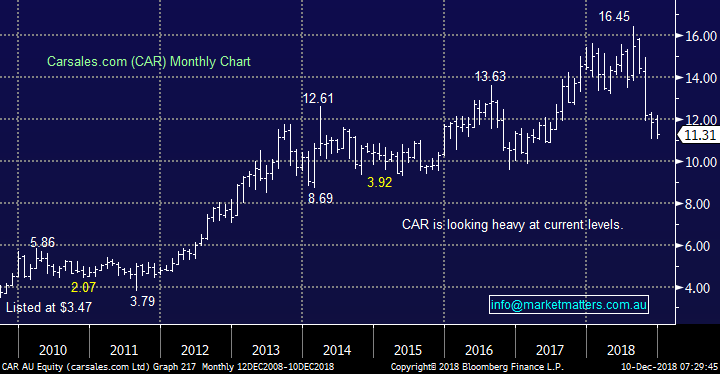
CAR is caught up in the weakness of most high growth / valuation stocks which have ran so hard since 2015, and in CAR’s case since it listed – the position of Seek (ASX: SEK) for example is very similar.
We believe CAR is approaching value but the current momentum could easily take the stock well under $10.
MM likes CAR below $10.
On the ABC matter we do usually look for AB and CD to be of similar length, could you let me know the particular stocks / markets are confusing you?
Carsales.com (ASX: CAR) Chart
Question 5
“Hi, I hold CYB and am getting a bit concerned with this holding. What are your thoughts on CYB and do you think it has much further to fall, or conversely, much upside? Thanks Peter T.
Hi Peter,
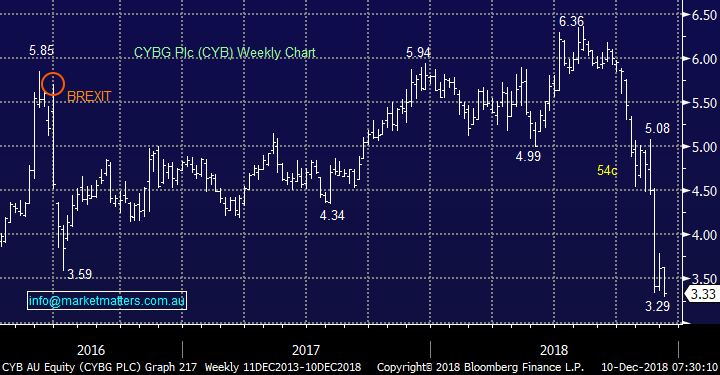
CYB fell over 25% in November following the result of its full year results which were clearly very disappointing, largely around growth or lack of it, but also around the way in which they are reducing costs, which has been their big claim to fame. They also warned that even if Brexit unfolds positively (50-50) conditions are likely to slow noticeably in 2019 and 2020 due to a decline in property purchases in the UK market – this ties in with our bearish outlook for the 1-2 years ahead.
I think CYB has now fallen so out of favour that its unlikely to enjoy a meaningful correction for a while.
We can see a ~15% bounce soon but likewise sub $3 looks highly likely in the next 6-months.
In short – it seems all too hard and its not a stock we’ll be buying
CYBG (ASX: CYB) Chart
Question 6
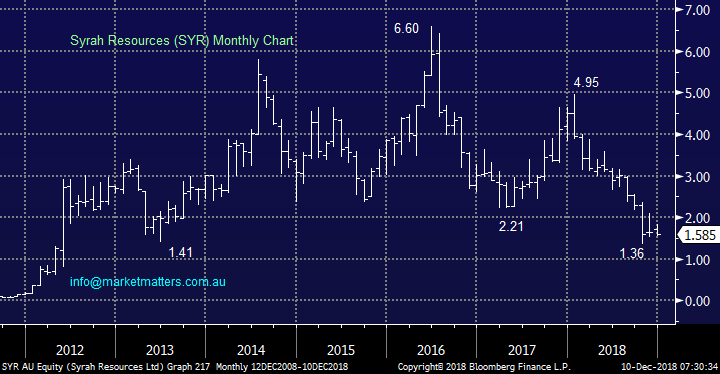
“Dear James, the continuing decline in the share price of SYR is frustrating. While I am aware that the stock is heavily shorted, recent company reports (as the world's largest graphite producer) seem to be very positive. Can I get your view as to why the share price continues to fall despite all the "positive" company news?” - many thanks John K.
Hi John,
As you say SYR has a large short position, actually the second largest on the market with 16.58% of its stock sold short = huge! I am always very wary investing against these professional players, they often get it right e.g. 2 other heavily shorted stocks are IOOF Holdings and Myer and we all know what’s happened to those two.
One glimmer of hope is over the years I have noticed that traders often take some profit in their short positions into Christmas / New Year which may help SYR this month. The traders are simply betting that SYR will fail to transition this graphite production to a meaningful profit, unfortunately they have a track record of missing production targets making it easy for investors to steer clear.
The company are now targeting positive cash flows from its Balama operations in Q1 of 2019, rather than late 2018 as previously flagged i.e. another miss.
Syrah Resources (ASX: SYR) Chart
Question 7
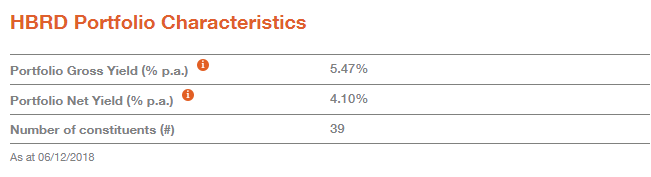
"Hi James, do you have a view on investing in the latest CBA and WBC hybrids versus just buying an ETF such as HBRD? (assume one pays enough tax to utilise franking credits when (if?) Labour gets in).” - best regards, Rob J.
Hi Rob,
The Hybrid ETF would provide more diversification but it also charges a fee of 0.55% for the privilege. Both the recent CBA and WBC securities you mentioned were around fair value at time of issuance and should do reasonable well in the secondary market. Here’s a quick run down of the ETF from Betashares. The strategy is run by Chris Joy from Coolabah Capital who funnily enough was very anti hybrids for a long time!
Hybrid ETF (HBRD)
Overnight Market Matters Wrap
· The Equity markets ended a volatile week’s trading on a low point with all three key indices dropping between 2.2%-3.3% last Friday after weaker than expected employment numbers. The US economy created 155,000 jobs vs consensus of 198,000 suggesting slowing economic growth. This was reflected in the bond market, with 10 year bonds hovering around 2.85% on expectations that the Federal Reserve was close to the end of raising rates.
· A sell off in technology stocks in particular saw the Nasdaq 100 lose 3.30%, while the Dow dropped 2.2% to below 24,400. Export related stocks like Boeing and Caterpillar were also sold off heavily on continuing concerns over the US-China trade wars, despite last Sunday’s 90 day truce.
· Oil prices rallied nearly 3% after the OPEC members plus allied nations like Russia agreed to cut production by 1.2mb/d in the first half of 2019. Commodities generally were slightly firmer with the gold price in particular hitting a 5 month high of US$1250/oz. while base metals were also a little stronger.
· BHP is expected to underperform the broader market, after ending its US session down an equivalent of -0.52% from Australia’s previous close.
· The December SPI Futures is indicating the ASX 200 to open 47 points lower, towards the 5635 level this morning.
Have a great day!
James & the Market Matters Team
Disclosure
Market Matters may hold stocks mentioned in this report. Subscribers can view a full list of holdings on the website by clicking here. Positions are updated each Friday, or after the session when positions are traded.
Disclaimer
All figures contained from sources believed to be accurate. Market Matters does not make any representation of warranty as to the accuracy of the figures and disclaims any liability resulting from any inaccuracy. Prices as at 10/12/2018
Reports and other documents published on this website and email (‘Reports’) are authored by Market Matters and the reports represent the views of Market Matters. The MarketMatters Report is based on technical analysis of companies, commodities and the market in general. Technical analysis focuses on interpreting charts and other data to determine what the market sentiment about a particular financial product is, or will be. Unlike fundamental analysis, it does not involve a detailed review of the company’s financial position.
The Reports contain general, as opposed to personal, advice. That means they are prepared for multiple distributions without consideration of your investment objectives, financial situation and needs (‘Personal Circumstances’). Accordingly, any advice given is not a recommendation that a particular course of action is suitable for you and the advice is therefore not to be acted on as investment advice. You must assess whether or not any advice is appropriate for your Personal Circumstances before making any investment decisions. You can either make this assessment yourself, or if you require a personal recommendation, you can seek the assistance of a financial advisor. Market Matters or its author(s) accepts no responsibility for any losses or damages resulting from decisions made from or because of information within this publication. Investing and trading in financial products are always risky, so you should do your own research before buying or selling a financial product.
The Reports are published by Market Matters in good faith based on the facts known to it at the time of their preparation and do not purport to contain all relevant information with respect to the financial products to which they relate. Although the Reports are based on information obtained from sources believed to be reliable, Market Matters does not make any representation or warranty that they are accurate, complete or up to date and Market Matters accepts no obligation to correct or update the information or opinions in the Reports. Market Matters may publish content sourced from external content providers.
If you rely on a Report, you do so at your own risk. Past performance is not an indication of future performance. Any projections are estimates only and may not be realised in the future. Except to the extent that liability under any law cannot be excluded, Market Matters disclaims liability for all loss or damage arising as a result of any opinion, advice, recommendation, representation or information expressly or impliedly published in or in relation to this report notwithstanding any error or omission including negligence.